Using and Collecting Fine-Grained Usage Data to
Improve Online Learning Materials
Leo Lepp¨anen, Juho Leinonen
Department of Computer Science University of Helsinki
Helsinki, Finland
{leo.leppanen, juho.leinonen}@helsinki.fi
Petri Ihantola
Department of Pervasive Computing Tampere University of Technology
Tampere, Finland [email protected]
Arto Hellas
Department of Computer Science University of Helsinki
Helsinki, Finland [email protected]
Abstract—As educators seek to create better learning materi-als, knowledge about how students actually use the materials is priceless. The advent of online learning materials has allowed tracking of student movement on levels not previously possible with on-paper materials: server logs can be parsed for details on when students opened certain pages. But such data is extremely coarse and only allows for rudimentary usage analysis. How do students move within the course pages? What do they read in detail and what do they glance over? Traditionally, answering such questions has required complex setups with eye tracking labs.
In this paper we investigate how fine-grained data about student movement within an online learning material can be used to improve said material in an informed fashion. Our data is collected by a JavaScript-component that tracks which elements of the online learning material are visible on the student’s browser window as they study. The data is collectedin situ, and no software needs to be installed on the student’s computer. We further investigate how such data can be combined with data from a separate learning environment in which students work on course assignments and if the types of movements made by the students are correlated with student self-regulation metrics or course outcomes.
Our results indicate that the use of rather simple and non-invasive tracking of students’ movements in course materials allows material creators to quickly see major problem-areas in their materials and to highlight sections that students keep returning to. In addition, when the tracking data is com-bined with student course assignment data, inferring meaningful assignment-specific areas within the course material becomes possible. Finally, we determine that high-level statistics of user movements are not correlated with course outcomes or certain self-regulation related metrics.
Index Terms—student behavior; course material usage; e-learning; learning material evaluation; heat map; visualization
I. INTRODUCTION
Course materials are traditionally written by an instructor with expert domain knowledge on a subject, possibly working in collaboration with researchers and other instructors to cover necessary content needed for achieving a set of learning objectives. Constructing such materials is hard, and relying on expert domain knowledge might not lead to the best outcomes for the students, as the instructors’ assumptions on what the challenging topics are do not necessarily align with students’ experiences [1]. Furthermore, the structure of classical e-learning courses may make it challenging to identify the parts
of the material that are most challenging for the students: If student learning is measured only after longer intervals, certain material sections can present challenges to – or they might be considered as irrelevant by – students without the instructors noticing. On the other hand if the material is split into very small sections immediately followed by short quizzes, it is possible for the students to score well on the tests due to just having read the relevant sections, even if they are simultaneously failing to “properly” commit the knowledge into long term memory.
In this work, we study students’ movements within online course materials with embedded course assignments, aiming to infer information that can be used to improve said material. The analysis is conducted on fine-grained data that is gathered in situ as the students view or browse the course materials, and combined with timestamped data from an automated assessment server that students submit their coursework to. We also take the first steps in analyzing whether student move-ments are correlated with student background variables or course outcomes by searching for correlations between course outcomes or self-regulation specific Motivated Strategies for Learning Questionaire (MSLQ) [2] variables and high-level movement statistics.
Information on students’ behavior with the course mate-rial and assignments could, among other things, be used to highlight important and trivial content. This could be used to provide material authors further suggestions on material contents that should be added, removed or modified, as well as possible locations in the material where additional interaction, for example assignments or shorter quizzes, would be benefi-cial. Furthermore, such data could be used to facilitate social navigation support where students could be shown information on the assignment-specific parts of the course materials that other students have considered important, as well as to improve other similar material personalization schemes.
Previous work on studying course material interaction has mostly focused on data collected from e.g. server logs as students move from page to page [3] or from working on online tasks [4] and has shown that such interaction can provide valuable information to educators on how the learning material is used, and also provide hints on what to improve. In addition, within the field of computing education, there exists
a stream of research that seeks to identify struggling students from working process data [5].
Compared to analysis completed on traditional server log data, our approach is able to infer more information about student movement on pages that do not fit on the average screen at once. On material pages that fit to the average screen at the same time, the methodology detailed in this paper provides at least the same amount of information as “classic” server log based data analysis.
This article is organized as follows. In Section II, we visit the relevant streams of research. Section III outlines our methodology and the data in more detail. Section IV presents and discusses our results. Section V concludes the article and outlines future research directions.
II. BACKGROUND A. Linearity of e-learning materials
E-learning material can be roughly divided into two cate-gories: linear and non-linear. Linear texts refer to traditional book-like texts that are intended to be read in a specific order. Non-linear texts take advantage of the hypertextuality of online content and consist of many separate sections which can be read in multiple orders.
Text type seems to have an effect on which material style is more beneficial: Zumbach and Mohraz [6] linked non-linearity of material to an increased cognitive load and decreased knowledge acquisition in narrative texts. Participants found it more difficult to access narrative texts in a non-linear fashion than in a linear fashion and simultaneously had significantly worse learning outcomes after reading a narrative text using non-linear navigation. At the same time, Zumbach and Mohraz report that non-linearity in encyclopedic text did not affect knowledge acquisition.
The effects of linearity also seem to be dependent on student learning styles. Analysing student movement in an online material, Liegle & Janicki [3] classified students into two basic categories:explorersandobservers. Explorers tended to prefer to ”jump around”, while observers preferred to access the material linearly. Both groups tested worse when they acted counter to their instinctive category. Similar results have been reported when classifying students as field-independent and field-dependent [7]–[9].
A further factor seems to be student background and previ-ous knowledge in the subject. Chen et al. [9] report that ex-perts benefit from a non-linear, less structured material, while novices are better helped by linear and structured materials. As for teaching computing, Niederhauser et al. [10] report that ”extensive use” of hypertext to contrast and compare different concepts was negatively correlated with test scores.
According to research on knowledge spaces by Doignon & Falmage [11], [12], learning can be simplified to near-atomic units of learning that have directed relations: learning X surmises learning Y. Due to how these relations map out, Hasse diagrams can be used to build graphs that represent these surmising-relations and essentially map out prerequisites for each fact or concept the student is expected to learn. The
fact that such visualizations are sensible and useful already suggests that the learning process is at least semi-linear, which in turn suggests that learning materials should be at least semi-linear.
Taking all this into consideration together with research on the effects of scaffolding as well as our knowledge of schema construction (see f.ex. [13] for an overview), it seems that especially in the context of an introductory programming course, at least partial linearity and clear structure is required. Indeed, many of the online study materials used in introductory programming are on at least some level linear – although the materials contain hyperlinks, authors still often assume that students consume the material at least approximately in a certain order. These assumptions have an especially large effect on accompanying assignments, in that the assignments are often constructed so that the students can complete them based on the knowledge they have attained so far.
B. Analyzing students’ use of online learning materials While general online usage analytics already take advantage of client side data collection [14], the majority of research on online learning materials seems to be focused on inter-page movement rather that intra-page movement.
Multiple researchers such as Romero et al. [15] and Khribi et al. [16] have shown that page level server logs can be used to mine usage patterns from online learning materials and to recommend content to users based on their behavior combined with models created from previous student interactions.
Visual analysis has also been extensively used to analyze inter-page movement and usage patterns. Wells et al. [17] visualized (among other things) student usage of discussion forums. Similar work has been performed by Kop et al. [18] who created graphs of the social interactions between MOOC participants, as well as by Hocheiser & Schneiderman [19] and Stones & Sobol [20].
Visualizations have also been used as parts of student dash-boards: [4], [21], [22]. While students find such dashboards useful [21], these dashboards seem to often focus on larger scale trends of the material, i.e. they focus on completion of assignments or on how often and for how long certain material pages have been accessed, and do not necessarily provide students (or teachers) with extremely finely grained data on how the material is used.
III. METHODOLOGY A. Research Questions
Upon analysis of the previously published literature on the topic, it becomes evident that most of the work is focused on large-scale transitions, and does not account for within page movements (i.e., in which order the fragments of the web based content are viewed). Our hypothesis is that such in-page movement data can be used to locateareas of interestin the online learning material, and further that knowledge about these areas of interest can be used as a basis for improving the learning material.
Our curiosity towards understanding the areas of interest in our study material is broad. We are not only interested in understanding where students spend most of their time but we want to find out how students move within the (linear) study material and especially where (in the previous material) they return when studying a specific new topic. Moreover, we are also interested in understanding what parts of the study material are used for each of the assignments.
Our first research question is as follows: RQ1: Can fine-grained movement data be used to locate meaningful areas of interest in an online learning material?In order to answer our first research question, we have conducted a case study where we focus on the following three smaller research questions:
1) RQ1.1: “Can we identify meaningful areas of interest from the course as a whole?”
2) RQ1.2: “Can we identify meaningful areas of interest within individual sessions and material pages?”
3) RQ1.3: “Can we identify meaningful areas of interest for individual exercises?”
For each of these smaller research questions, we further seek to understand how any areas of concern found differ from the surrounding material and whether these differences indicate that said sections should be improved.
Furthermore, we wish to investigate whether high level statistics on student movement within the learning material are correlated with course outcomes or MSLQ metrics that measure rehearsal, organization, metacognitive self-regulation, effort regulation as well as time and study environment man-agement. To this end, our second research question is as fol-lows:RQ2:“Are course outcomes or MSLQ metrics that mea-sure rehearsal, organization, metacognitive self-regulation, effort regulation or time and study environment management correlated with high-level student movement statistics?” B. Data and Setup
Our data for this analysis comes from an introductory pro-gramming course organized during Spring 2016 at a research oriented university in Europe. The course uses a blended online textbook with over 130 embedded programming as-signment prompts. The material is split into seven long web pages, where each web page is released weekly as the course progresses; due to space limitations, we limit our analysis to the first five web pages. One of the authors of this article is also the author of the online material.
The embedded assignments prompts are associated with assignment templates, fetched automatically by a plugin called TestMyCode [23] that is integrated to the NetBeans IDE. The students are instructed to switch to the NetBeans IDE when they encounter a prompt and to finish the assignment before continuing with the material. As the students work to complete the assignment in the NetBeans IDE, they are able to check their solution for correctness – as specified by automated tests – using the TestMyCode plugin. When the solution is determined to correct, the students submit their solution to a TestMyCode server using a one-click workflow. This server component checks the solution for correctness one final time
Table I
DEMOGRAPHICS FOR THE PARTICIPANTS PRESENT IN THE DATA SET USED TO ANSWER RESEARCH QUESTIONS1.3AND2.
Total 77 Gender
Male 38 Female 35 Other / Not Disclosed 4 Age -20 11 21 - 29 58 30 - 8 Programming Background None 44 Some 33 Educational Background Upper Secondary 48 Bachelor’s 23 Master’s 6
and assigns the student points. There is no penalty for checking for correctness multiple times either locally or using the server. The points accrued by completing these assignments ac-count for 70% of the course grade with the rest coming from a paper exam and a computer exam. The pen-and-paper exam was primarily on theoretical concepts whereas the computer exam contained concrete, timed, programming tasks. To pass the course the students were required to successfully complete at least 75% of the programming assignments and the highest grade required a completion rate of at least 90%. The students were also required to obtain at least 50% of the marks available from both the exams. At the end of the course, some extra assignments were provided. These extra assignments allowed the students to make up for up to one week’s worth of missed programming assignments.
When opening the course material, participants are prompt-ed for the username they use in the accompanying automatprompt-ed assessment system. If a user declined to provide a username, the data generated from that session was discarded from the analysis. Furthermore, certain known instructor accounts were removed from the data set. A total of 153 unique usernames were present in the final data set. This number is higher than the number of students (n= 127) that submitted answers to the assignment evaluation service. This discrepancy is likely caused by the fact that the page did not authenticate the user, and subsequently users were able to identify using mis-typed usernames. For RQs 1.1 and 1.2, we used the whole data-set of 153 distinct usernames, as there was no need to combine them with other data sources. At the same time, for RQs 1.3 and 2, we further narrowed the data set to only those users that also answered the MSLQ background questionnaire and attended the course final exam (n = 77). Demographics for these 77 students are presented in Table I
Material usage data was gathered using a custom JavaScript component1 that was embedded into all course material web pages. The component adds a sequential identifier to each elementof the web page. We chose to assign identifiers to each distinct vertical block of the material, that is to each page wide image, widget, code sample and paragraph. These identifiers
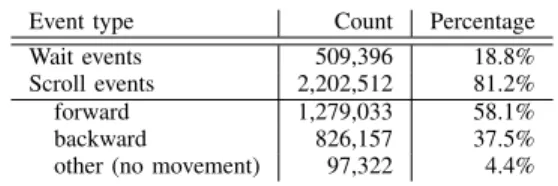
Table II
KEY STATISTICS OF THE MATERIAL MOVEMENT DATA. SCROLL EVENTS ARE FURTHER SPLIT DOWN INTO EVENT TYPES THAT DEPICT THE
DIRECTION OF THE MOVEMENT.
Event type Count Percentage
Wait events 509,396 18.8%
Scroll events 2,202,512 81.2%
forward 1,279,033 58.1%
backward 826,157 37.5%
other (no movement) 97,322 4.4%
are in practice indices of ”interesting” elements, going from the top to the bottom of the page.
When a user moves forward or backward in the material (e.g. scrolls down or up), or stays put in the same place for more than 10 seconds, aneventis recorded by the JavaScript-component. These events are not recorded if the browser window is inactive, i.e. the material page is in an inactive tab or another program covers the material page or no actions have been taken in a few minutes. Each event holds at the minimum the following information: a student identifier, timestamp of the event, event type (scroll, wait), the URL of the page that generated the event, the identifier (index) of the top-most element that is visible on the user’s screen and the identifier (index) of the bottom-most element that is visible on the user’s screen, and distance from the current view to the topmost part of the page. The events are stored in the browser cache and periodically sent to a database server where they are recorded. When a user closes or opens a material page, any events that have not been previously sent are sent to the database. Table II displays key movement statistics recorded by the component; in the data used in the analysis, there are a total of 2.7 million events.
In addition to the course page movement data, we extracted the times when the students submitted their programming assignments to the automated assessment system. This data was combined with the material usage data for RQ1.3.
Finally, the course material contained embedded question-naires, including a general student background survey and a Motivated Strategies for Learning Questionnaire [2]. Answer-ing these questionnaires was completely voluntary.
C. Analysis
Our data collection tool records the parts of the learning material the students are viewing on a per-element basis. At any point in time, the student’s screen can include multiple elements, and as such, the data needs to be processed to determine movement and active areas in the page.
For RQs 1.1 and 1.2, the collected events are grouped based on the user identifier and then ordered sequentially based on the timestamps. This data is then used to construct the global element transition count matrix C as follows: Process each user’s temporally ordered list of events, designating each event in turn as startEvent. For each startEvent, look at every subsequent event in order, designating each subsequent event
in turn asendEvent. For each such(startEvent, endEvent) pair in turn, find all elementss
s|s∈startEvent∧s6∈endEvent, as well as all elementse
e∈endEvent.
For all pairs (s, e) in that (startEvent, endEvent) pair, increment C[s][e] by one. Essentially, the transition count in C is incremented for all the elements that disappear from the screen to all the elements that are visible on the screen after the transition.
The resulting matrix C can now be scaled to values in the range [0,1] and then visualized as a heat map. Splitting the rather large matrix into several sub-graphs seems to be beneficial for easier visual analysis. This visualization can be used to address RQ1.1: ”Can we identify meaningful areas of interest from the course as a whole?”.
The procedure can be modified so that we only look at a certain subset of(startEvent, endEvent)pairs, for example only those that occur within a single user session or within a single page. We define sessions as the sets of events that occur between two subsequent page load events, which are determined based on the material page. Analyzing this data as a heat map (Figure 2) allows us to answer RQ1.2: ”Can we identify meaningful areas of interest within individual sessions and material pages?”.
We can also combine the material usage data with as-signment submission data to determine which sections of the material were most viewed by students when they were completing a certain exercise. To do this, we filter the set of events to those that occur between the time the student submitted the previous assignment and the time the student submitted the assignment under scrutiny with slight overlap in time allowed in both directions. For each of these sections, a popularity metric can be calculated for each element of the material. We chose to simply divide the number of events during which the element was visible by the number of students that submitted a fully correct solution. Visualizing this data as a graph (see Figure 3) allows us to answer RQ1.3: ”Can we identify meaningful areas of interest for individual exercises?”.
IV. RESULTS ANDDISCUSSION
In this section, we first present our results pertaining to the research questions outlined in Section III, and discuss how said results appear in the larger context detailed in Section II. A. Identifying areas of interest in an online learning material as a whole
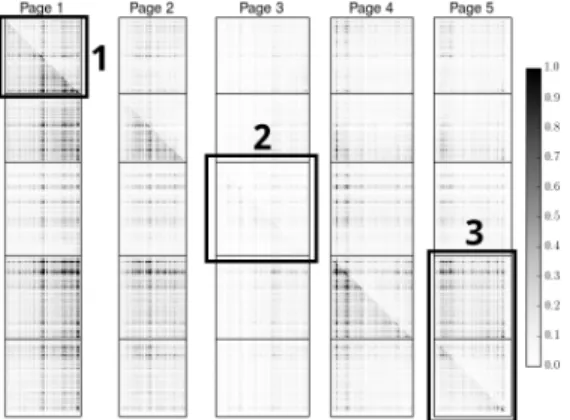
To identify areas of interest in the online learning material as a whole, we visually analyze the heat map generated using the method described above. We chose to limit the analysis to the first five weeks (and therefore the first five pages) of the course due to space concerns. This heat map is presented in Figure 1. Each row and column of the graph correspond to a
Figure 1. Visualization of the global element transition count matrix split by material page with the effect of an outlier section at the start of week four removed. This graph includes transitions over multiple sessions. White areas have seen the least activity and black areas the most. Horizontal black lines have been added at the page transitions and interesting sections highlighted. The diagonal line between the top left corner and the bottom right corner of the figure splits the pages into areas with backtracking (upper triangle) and forward movement (lower triangle).
certain element of the course material, ordered by page and by location in the page. Each column contains data on how often elements were visitedafterthe element corresponding to that row was first visited. In other words, the darkness of the pixel at location (X, Y) shows how often element Y was visited after element X was first visited. The(0,0) is located in the left corner of the visualization. The diagonal from top-left to bottom-right corresponds to instances of users visiting certain element again after already having visited that element. The original heat map contained a cluster of extremely high activity at the start of the fourth week of the course. This area contains an extensively long assignment prompt for an assignment that multiple students report having excessive troubles with, with more than one going as far as to say “I worked on this for multiple days before getting it right”. The assignment was in fact a slightly rephrased “rainfall problem”, that has previously been shown to be very difficult to students (See [24] for overview).
Due to the values in the map being normalized to a range from 0 to 1, this outlier area made visual analysis of the other material difficult, as most of the normalized values were in a very small range near the zero. To allow for easier analysis, we decided to force a ceiling on the values, so that the effect of this outlier was reduced enough for visual analysis of the rest of the heat map to be possible.
The clamped heat map contains several interesting sections. Visual analysis points to three major areas of interest. Looking at the contents of material related to these areas in more detail, possible explanations for the abnormalities were located. Refer to the highlighted areas in Figure 1.
1) Based on the rather active (dark) area in the top-right corner of the first page, the week seems to require a lot of backtracking from the students when compared to subsequent weeks two and three. This has likely been unnoticed before because of two basic reasons. First,
students who struggle extensively with the first week are probably more likely to drop out before the end of the course, so the students who make it to the end would not exhibit problems with the contents of that week. Second, the first week is very basic in contents, handling such subjects as output, variables, arithmetic, if, else and whilestatements, etc. Anyone who makes it to the end of the course is bound to have learned the contents the first week at some point, so no indicators of trouble during the first week would be exhibited in the course final exam. In other words, an analysis of the course final exam likely only brings to light problems with later sections of the material.
2) Based on the relatively light area, the third week of the course sees very little refreshing. Around half of this week is content on good programming practices and on clean and beautiful code. It is possible that these sections feel unnecessary to beginner programmers who do not yet concern themselves with code maintainability and readability. The rest of the week goes over common String operations and acts as a very light introduction to lists.
3) The dark areas in the top of the highlighted area indicate that many students backtrack from page five to page four. Page four introduces objects and goes over collections such as lists and maps, while page five builds and expands on both of these. In a sense, pages four and five form a single ”unit” comparable to what the other pages form independently.
Based on the areas of concern identified from the heat map, the following improvement opportunities were identified: The first week introduces a lot of new concepts very fast. At the same time, the first two thirds of the third week seem excessively light in content and assignments. This suggests that weeks one through three can be rebalanced so that all of said weeks see an approximately equivalent amount of back-tracking. While good programming practices are important, they don’t necessarily need such a long section and would be better taught “on the side”. Similarly, more of the material on collections could be moved from the fourth week to the third. Finally, the extensive amount of backtracking from week five to areas of week four that handle collections indicates that the start of week five would benefit from a refresher section on the contents of week four.
Based on the above findings, we can answer RQ 1.1 in the affirmative: it is possible to identify meaningful areas of interest from the course as a whole using fine-grained movement data.
B. Identifying within-session areas of interest
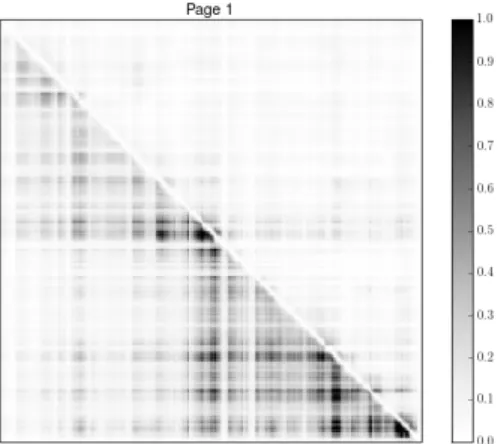
To answer research question 1.2, a visualization of the within-session transitions for the first page of the material (Figure 2) was analyzed. To make the patterns in the image better visible in print, the image was modified by applying a ceiling effect unto the values before normalization to the range
Figure 2. Visualization of the first week’s data in the global element transition count matrix, with data split into sessions by page loads. White areas have seen the least activity and black areas the most. The image has been slightly modified (a ceiling was applied to pre-normalization numbers) so that the near-white areas appear more clearly in print.
0 to 1 range. Analysis of this image revealed two interesting properties.
First, the middle and the end of the page see relatively large amounts of traffic. This suggests that these areas are either difficult or that the students consider them interesting. The middle section of activity corresponds roughly to the section that first introduces reading input from user, with the most activity corresponding roughly to an area that contains a summary with examples of how to read text (strings) and integers as input. Understanding input is a prerequisite for completing the rest of the week’s assignments. The area of activity near the end of the page (bottom-right area of the graph) corresponds roughly to an area that introduces loops, and the very end of the page contains three longer assignments, the final of which is very long compared to the rest of the week and involves writing code for a robot that moves boxes around on the screen automatically.
Secondly, the bottom half of the figure under the diagonal has three distinct areas: a rectangle of less activity and two triangles of more activity. This hints that students tend to complete the week in two discrete sessions, first working until approximately the half-way point and then completing the rest of the week in a subsequent session. No other pages displayed such an effect as clearly.
The areas of most activity very much correspond to our expectations. Still, the fact that the first half of the week sees a lot less activity than the second half raises the question of whether the material should focus more on the loop structures. This further supports the idea of moving material forwards from weeks 1 and 2 towards week 3, as suggested in conjuncture with our answer to RQ1.1.
While this analysis revealed no new immediately obvious opportunities for improving the material, the results were aligned with those of presented in the previous sub-section in relation to RQ 1.1, and supported the interpretations made based on them. Due to this, we can answer RQ 1.2 in the
Figure 3. Material usage whilst working on specific programming assign-ments. The x-axis indicates individual elements within the page, and y-axis denotes their popularity. Popularity is measured in terms of observed events where specific elements are visible, normalized over the number of students submitting a solution that assignment. Due to the location of the assignments in the course and the grading scheme, essentially all students completed all of the assignments depicted here.
affirmative: it is possible to identify areas of interest within individual sessions and material pages using fine-grained movement data.
C. Identifying areas of interest for individual assignments The online learning material under scrutiny is built in a lin-ear fashion where theory and assignments are intertwined. The goal is to have students read the relevant pieces of information just before they start to work on the assignment (or whilst working on the assignment) so that they can immediately apply what they have just read.
To answer RQ 1.3, a subset of the course assignments that focus on the use of conditionals was selected. Figure 3 shows the areas in the material that students focus on when working on the specific assignments, which are as follows (element number range for the assignment prompt in parentheses):
Orwell(252 - 254): Create a program that asks for a number. If the user inputs1984, print ”Orwell”.
Greater Than(270 - 274): Create a program that reads two numbers and prints the greater of the two.
Age Check(292 - 296): Create a program that asks for the age of the user and verifies that the given age is between 0 and 120.
Odd or Even (314 - 317): Create a program that reads a number and tells whether it is odd or even.
Leap Year(337 - 342): Create a program that reads a number and tells whether it is a leap year or not.
In the material, the assignment Orwell is preceded by the introduction to the use of anif-statement – the material has already introduced basic input and output – and followed by an introduction to the use of if-else, after which the assignment Greater Than is given. Before the Age Checkassignment, examples of logical operations (and,or) are given, after which there exists a paragraph on the usages ofmoduloin programming, followed by the assignmentOdd or Even. Finally, a section on splitting a task to smaller pieces is given before theLeap Yearassignment.
Table III
STUDENT FEEDBACK AVERAGES FOR THE ASSIGNMENTS INSPECTED IN IN CONJUNCTURE WITHRQ 1.3. ANSWERS ON ALIKERT-SCALE FROM1TO
5,WHERE THE VALUE1INDICATED THE LEAST DIFFICULT,INSTRUCTIVE OR WORK HEAVY.
Assignment Difficulty Instructiveness Workload
Orwell 1.33 2.15 1.24
Greater than 1.78 2.54 1.56
Age Check 1.36 2.64 1.51
Odd or Even 1.50 2.67 1.32
Leap Year 2.71 3.15 2.46
The areas within the course materials that are looked at whilst working on the assignments are mostly related to the assignments. The first two assignments see small bumps in the vicinity of element 220. This bump seems to have a simple explanation: moving up the page from the assignment prompts, said location contains the first code example that (among other things) contains examples for reading strings and integers from the user.
Very little forward movement is detected during the as-signments, except for the last assignment shown in Figure 3. For the Leap Yearassignment, some seek for information also in the material after the assignment, which may indicate struggles with the assignment, followed by a need to scan further for material that could help in the process.
After submitting a correct answer to the exercises, the students were prompted for (voluntary) feedback on how difficult, work-heavy and instructive the assignment was. Ag-gregated data for these five exercises is presented in Table III. Comparing the tabulated values to the graph, one notices that the assignment with the largest spread over the material (“Leap Year”) also was identified by the students as the most difficult. These findings indicate that at least two types of information can be inferred from the per-assignment movement data: First, it seem to be possible to detect difficult exercises by looking for situations where students explore the material forwards while working on the exercise. Second, it is possible to detect areas of the material that contain prerequisite information for completing an assignment. All in all, these findings allow us to answer RQ 1.3 in the affirmative: it is possible to identify meaningful areas of interest for individual exercises.
D. Inferring areas of interest from fine-grained movement data Our ability to answer research questions 1.1 through 1.3 affirmatively indicates that our methodologies of data collec-tion, analysis and visualization are able to present educators and learning material creators with information for data driven development of their learning materials on levels not possible based solely on server-side access and usage logs. In the context of the experiment, it allowed the authors to detect previously undetected areas of interest in the course material, namely sections where activity differed from the surrounding material. Some of these locations were identified as prime locations for improvement of the material. Therefore, we can answer research question 1 in affirmative: ”Fine-grained move-ment data canbe used to locate meaningful areas of interest
in an online learning material, with the aim of improving the material.”
In general, analysis of the areas of the material relating to individual assignments allows the educator to validate how well the assignments fit into the flow of the material: large amounts of jumps far back in the material likely indicate that the assignment handles topics which need refreshing. In such cases, adding an easier refresher-assignment before the harder assignment might be beneficial.
The data collection methodology also shows promise for other analytics and possibly learning material personalization. Being able to detect locations where students commonly end sessions allows for improvement of the material from the spacing point of view, allowing the educator to construct the material so that students find major theme changes in areas where they tend to pause naturally. At the same time, such data could be used to drive social navigation features, to show students which sections of the material he or she has not read yet in detail or as additional data for building student models.
E. Student movements, key MSLQ metrics and course out-comes
In our second research question we wish to determine whether high-level student movement statistics are correlated with MSLQ metrics that measure rehearsal, organization, metacognitive self-regulation, effort regulation as well as time and study environment management, or with course outcomes. Here, we define “course outcomes” as the exam scores the students achieved on the course-final exams.
To determine whether such correlations exist, we searched for correlations between the the relative event counts by type (scroll forwards, scroll backwards, staying still) and both course outcomes and said MSLQ metrics. The results are tabulated in Table IV.
Only the relative amount of forward movement events and exam total scores showed a statistically significant correlation at r = −0.26, p = 0.04. After a correction for multiple comparisons was applied, even that correlation lost its sta-tistical significance. Based on these findings, we can answer our second primary research question as follows: “Course outcomes or MSLQ-metrics that measure rehearsal, organi-zation, metacognitive self-regulation, effort regulation or time and study environment management are not correlated with high-level student movement statistics”.
It has to be noted that while this very rudimentary analysis failed to reveal any correlations, it is still possible that more complex movement patterns or statistics could be correlated with course outcomes or student backgrounds. Searching for movement based student archetypes and how they correlate with course outcomes is something that warrants in our view more research: Finding such correlation and archetypes could reveal insights into how and why the students struggle, as well as to how automated systems could detect “struggling-like behavior”.
Table IV
PEARSON’S CORRELATION COEFFICIENTS(r)BETWEEN THE RELATIVE NUMBERS OF DIFFERENT TYPES OF EVENTS WITH BOTH COURSE FINAL EXAM SCORES AND RELEVANTMSLQMETRICS. AN ASTERISK INDICATES
THAT THE VALUE IS SIGNIFICANT ATp <0.05BEFORE A CORRECTION FOR MULTIPLE COMPARISONS IS APPLIED.
Forwards Backwards Still Combined Self-Regulation 0.12 -0.09 -0.01
Effort Regulation 0.07 -0.08 0.02
Metacognitive Self-Regulation 0.02 0.01 -0.02
Organization 0.22 0.07 -0.17
Rehearsal 0.15 0.01 -0.09
Time & Study Env. Manag. 0.19 -0.16 0.01
Exam Total -0.26* -0.03 0.16
F. Limitations
Our material consisted of large pages with embedded as-signment prompts. On very short pages that fit on a screen at once, the methodologies described here should work on a level equal to “classical” page request data.
The data collection method would need improvements for extremely dynamic pages, where JavaScript is used to add and remove larger sections of the material. Similarly, a learning material with multiple intersecting ”paths” for learners of different skill levels would likely be hard to visualize using the techniques we have presented here.
Extracting meaning from the data and the visualizations requires an in-depth understanding of the material contents as well as expert domain knowledge of the content being taught. The visualizations also only show areas of high activity and not all of these areas are necessarily in need of improvement. Thus, the information inferred from the visualizations require large amounts of interpretation from the educator.
As the analysis of the visualizations is subjective, a possi-bility of confirmation bias remains. As such, further study is required to determine how well the interpretations of multiple independent experts agree when they are asked to assess the same online learning material based on the same visualiza-tions.
Since the data is collected on the participants’ computers, certain data validity issues arise. The participants are in theory able to send forged data and to disable the data collection altogether. The requirement for having JavaScript enabled in the browser could lead to self selection issues, if students with better programming skills turned out to be more aware of their privacy and therefore more likely to disable the data collection. Finally, our visualization methods were only tested with a highly linear learning material. This raises the question of whether it is applicable to non-linear learning materials. We estimate that the session-limited visual analysis would produce sensible results even with non-linear material, but more work is warranted to verify this expectation.
V. CONCLUSIONS ANDFUTUREWORK
In this work, we sought to determine whether fine-grained movement data harvested automatically from an online learn-ing material could be used to infer areas of interest in said
learning material with the aim of finding areas where the material could be improved. The data was collected using a JavaScript-plugin that identified the specific elements that were visible on students’ screens and recorded the students’ movements across and within course pages. Based on our successes in answering several questions about student move-ment and usage within a specific learning material, we were able determine that “fine-grained movement data can be used to locate meaningful areas of interest in an online learning material”, with the aim of improving the material.
Analysis revealed small hot-spots that students re-visit over and over again. These would not have been noticed with coarser page-level analysis. We also identified content that was largely ignored. By dividing the data into sessions, we were able to locate areas that students were most likely to work on during a single session, and to identify material locations that were often followed by a pause. Further, by combining this browsing data with student assignment submission data, we were able to determine which areas of the course material students were browsing while working on each exercise, including exercises that seemed to cause excessive trouble to some students. This analysis was in line with student responses about exercise difficulty.
The presented methodology allows educators to detect ap-proximate student interest in the material on the scale of individual HTML elements, allowing for more fine-grained analysis of the quality of the sections of the material than what is possible from page-load data or logs of clicked links. This in turn allows educators to do more informed decisions on how to construct and change their (semi)linear course materials for better learning outcomes.
At the same time, we determined that “course outcomes or MSLQ-metrics that measure rehearsal, organization, metacog-nitive self-regulation, effort regulation or time and study environment management are not correlated with high-level student movement statistics”.
While this latter result is somewhat disappointing, our view is that more research is required to determine how student movements are linked with learning outcomes and student backgrounds, especially insofar as more complex movement models are concerned. As a part of our ongoing work, we are analyzing the influence of students’ background variables such as programming experience on the material usage behavior, combining material usage behavior with other data sources such as source code snapshots, and exploring the possibilities of adding social navigation support to the course materials so that students could gain knowledge of the areas that other students have visited when working on specific tasks.
This work has focused on the student population as a whole: future work should attempt to identify more complex student archetypes based on their activity patterns, and whether those archetypes are correlated with student background variables or learning outcomes. Similarly, research should be conducted to determine explicitly whether student movement in the context of a single assignment is correlated with student views on the assignment’s difficulty.
ACKNOWLEDGEMENTS
We thank the anonymous reviewers for their valuable feed-back, which helped improve and clarify the paper. We also thank Tony Kovanen and Hanna M¨aenp¨a¨a for their contribu-tions to the development of the original data collection tool. This work was partially funded by Academy of Finland under grant number 303694,Skills, education and the future of work and Tekes/Digile Need4Speed projects.
REFERENCES
[1] N. C. Brown and A. Altadmri, “Investigating novice programming mistakes: Educator beliefs vs. student data,” inProceedings of the Tenth Annual Conference on International Computing Education Research, ser. ICER ’14. New York, NY, USA: ACM, 2014, pp. 43–50. [Online]. Available: http://doi.acm.org/10.1145/2632320.2632343
[2] P. R. Pintrichet al., “A manual for the use of the motivated strategies for learning questionnaire (mslq).” 1991.
[3] J. O. Liegle and T. N. Janicki, “The effect of learning styles on the navigation needs of web-based learners,”Computers in human behavior, vol. 22, no. 5, pp. 885–898, 2006.
[4] C. Monroy, V. S. Rangel, and R. Whitaker, “Stemscopes: contextualizing learning analytics in a k-12 science curriculum,” inProceedings of the 3rd Int. Conf. on Learning Analytics and Knowledge. ACM, 2013, pp. 210–219.
[5] P. Ihantola, A. Vihavainen, A. Ahadi, M. Butler, J. B¨orstler, S. H. Edwards, E. Isohanni, A. Korhonen, A. Petersen, K. Rivers, M. A. Rubio, J. Sheard, B. Skupas, J. Spacco, C. Szabo, and D. Toll, “Educational data mining and learning analytics in programming: Literature review and case studies,” in Proceedings of the 2015 ITiCSE on Working Group Reports, ser. ITICSE-WGR ’15. New York, NY, USA: ACM, 2015, pp. 41–63. [Online]. Available: http://doi.acm.org/10.1145/2858796.2858798
[6] J. Zumbach and M. Mohraz, “Cognitive load in hypermedia reading comprehension: Influence of text type and linearity,” Computers in Human Behavior, vol. 24, no. 3, pp. 875–887, 2008.
[7] L.-H. Chen, “Web-based learning programs: Use by learners with various cognitive styles,”Computers & Education, vol. 54, no. 4, pp. 1028–1035, 2010.
[8] S. Chen, “A cognitive model for non–linear learning in hypermedia programmes,”British journal of educational technology, vol. 33, no. 4, pp. 449–460, 2002.
[9] S. Y. Chen, J.-P. Fan, and R. D. Macredie, “Navigation in hypermedia learning systems: experts vs. novices,”Computers in Human Behavior, vol. 22, no. 2, pp. 251–266, 2006.
[17] M. Wells, A. Wollenschlaeger, D. Lefevre, G. D. Magoulas, and A. Poulovassilis, “Analysing engagement in an online management programme and implications for course design,” inProceedings of the Sixth International Conference on Learning Analytics & Knowledge. ACM, 2016, pp. 236–240.
[10] D. S. Niederhauser, R. E. Reynolds, D. J. Salmen, and P. Skolmoski, “The influence of cognitive load on learning from hypertext,” Journal of educational computing research, vol. 23, no. 3, pp. 237–255, 2000. [11] J.-P. Doignon and J.-C. Falmagne, “Spaces for the assessment of
knowledge,” International journal of man-machine studies, vol. 23, no. 2, pp. 175–196, 1985.
[12] ——,Knowledge spaces. Springer Science & Business Media, 2012. [13] J. van Merri¨enboer, “How people learn,”Wiley Handbook of Learning
Technology, pp. 15–34, 2016.
[14] J. Srivastava, R. Cooley, M. Deshpande, and P.-N. Tan, “Web usage mining: Discovery and applications of usage patterns from web data,”
Acm Sigkdd Explorations Newsletter, vol. 1, no. 2, pp. 12–23, 2000. [15] C. Romero, S. Ventura, J. A. Delgado, and P. De Bra, “Personalized
links recommendation based on data mining in adaptive educational hypermedia systems,” inEuropean Conference on Technology Enhanced Learning. Springer, 2007, pp. 292–306.
[16] M. K. Khribi, M. Jemni, and O. Nasraoui, “Automatic recommendations for e-learning personalization based on web usage mining techniques and information retrieval,” in2008 Eighth IEEE International Conference on Advanced Learning Technologies. IEEE, 2008, pp. 241–245. [18] R. Kop, H. Fournier, and J. S. F. Mak, “A pedagogy of abundance or
a pedagogy to support human beings? participant support on massive open online courses,”The International Review Of Research In Open And Distributed Learning, vol. 12, no. 7, pp. 74–93, 2011.
[19] H. Hochheiser and B. Shneiderman, “Using interactive visualizations of www log data to characterize access patterns and inform site design,”Journal of the American Society for Information Science and Technology, vol. 52, no. 4, pp. 331–343, 2001.
[20] C. Stones and S. Sobol, “Dmasc: A tool for visualizing user paths through a web site,” inProceedings of the 13th International Workshop on Database and Expert Systems Applications. IEEE Computer Society, 2002, pp. 389–393.
[21] J. L. Santos, S. Govaerts, K. Verbert, and E. Duval, “Goal-oriented visu-alizations of activity tracking: a case study with engineering students,” inProceedings of the 2nd international conference on learning analytics and knowledge. ACM, 2012, pp. 143–152.
[22] S. Bull, B. Ginon, C. Boscolo, and M. Johnson, “Introduction of learning visualisations and metacognitive support in a persuadable open learner model,” inProceedings of the Sixth International Conference on Learning Analytics & Knowledge. ACM, 2016, pp. 30–39.
[23] A. Vihavainen, T. Vikberg, M. Luukkainen, and M. P¨artel, “Scaffolding students’ learning using test my code,” inProceedings of the 18th ACM conference on Innovation and technology in computer science education. ACM, 2013, pp. 117–122.
[24] O. Sepp¨al¨a, P. Ihantola, E. Isohanni, J. Sorva, and A. Vihavainen, “Do we know how difficult the rainfall problem is?” inProceedings of the 15th Koli Calling Conference on Computing Education Research. ACM, 2015, pp. 87–96.