2017 2nd International Conference on Computational Modeling, Simulation and Applied Mathematics (CMSAM 2017) ISBN: 978-1-60595-499-8
Channel Selection with EEG Source Imaging
Ming-ai LI
*, Chun-ting ZHANG and Yan-jun SUN
Faculty of Information Technology, Beijing University of Technology, Beijing 100124, China
*Corresponding author
Keywords: EEG, Channel selection, EEG source imaging, Motor imagery, Wavelet transform.
Abstract. Brain computer interface (BCI) is a technology recording brain signals and translate into machine language to drive device movement. To improve the convenience and practicability of BCI systems, it is necessary to reduce the number of channels of EEG without reducing classification accuracy. In this paper, a channel selection method was proposed. Combine continuous wavelet transform (CWT) with EEG source imaging (ESI), we can find out the source distribution of two kinds of motor imagery (MI) tasks on the cortex. Then the different value of source distribution on the cortex was projected to scalp. The value on the scalp was treated as a criterion for channel selection. While ESI was applied for locating the active areas, we can not only find out the prior channels clearly, but also figure out the expected areas briefly. The satisfying results show that the combination of CWT and ESI is a potential method for dealing with MI tasks.
Introduction
For those people suffering from motor disabilities but being cognitively intact, BCI technology has provided an optional method to communication with the environment. On account of the low cost and high resolution, EEG is becoming the most popular brain signal in Clinical application and scientific research [1]. To achieve a productive EEG classification performance, most EEG-based BCIs acquire multiple signals of electrodes on the scalp [2,3]. However, different recorded signals at different scalp will not provide the same discriminatory information [4], a large number of channels will bring noisy and excrescent information which bring down the performance of BCI [5,6]. In addition, numerous channels will lead to a time-consuming performance that affects the convenience in the use of the BCI. It would be inconvenient for clinical device widely used with a mass of channels. Thus a moderate number of channels will balance the required accuracy and the needs for performance and convenience.
Various methods have been proposed for channel selection [8,9]. Fisher discriminant analysis was introduced to find out the desired channels for right hand and right foot classification based on time segment and channel positions [7], the results provided to be effective in reducing training time with a rare decrease of classification performance. CSP-rank was proposed to reduce the number of channels [10]. In each filter, the absolute value of the filter coefficients were sorted and searched the largest coefficient by turn from two spatial filters. This method removed those channels with low contribution for classification and the high accuracy confirmed the feasibility of MI classified into two class in the range of electrodes. However, the previous research concentrated on the signals obtain scalp, analyzed the difference of each channel and found out the features of a series of channels between two kinds of MI [7,8,9,10]. Although the signals were produced in the cortex, few studies pay attention to the source distribution.
For ESI technique, numbers of scholars have made in-depth studies. Low-Resolution electromagnetic tomography (LORETA) [12] was first proposed by R.D. Pascual-Marqui, which applied into two different sets of evoked potential data, the result provided to be physiologically meaningful but in many solutions unsuccessful. Then R.D. Pascual-Marqui came up with another method named standard low-resolution electromagnetic tomography (sLORETA) [13] with zero location error. Brad Edelman[11] used weighted minimum norm estimate (WMNE) to search out the optimal source distribution; the results showed that four-class classification of right hand tasks by using EEG source imaging approach were able to improve nearly 10% compared with traditional technology. Xu et al. proposed NEtwork based SOurce Imaging (NESOI) method [14]. Compared with other methods, NESOI was a potentially useful method for EEG source imaging without the use of Functional Magnetic Resonance Imaging (FMRI) priors. With the help of source analysis methods, we can figure out cortex distribution as the reflection of the real cortex distribution.
In this paper, we proposed an ESI-based method for channel selection. For all tasks, the same kind of trials strung together and continuous wavelet transform (CWT) was used for further analysis. The mean of wavelet coefficients of two MI in particular frequency band were analysed by ESI and the source distribution on the cortex were generated respectively. Then the different values of source distribution on the cortex were projected into scalp. The top value of the channel on the scalp was regarded as the optimal channel. This paper is organized as follows: experimental data and the preprocessing procedure were shown in section 2, channel selection method was illustrated in section 3, experimental results were presented in section 4.
Data Description and Preprocessing
The EEG data used in this study is from BCI competition III dataset IVa, provided by Fraunhofer FIRST (Intelligent Data Analysis Group) and Campus Benjamin Franklin of the Charite-University Medicine Berlin (Neurophysics Group) [15], with two classes: right hand and right foot MIs. On account of using 128 channel Ag/AgCL electrode cap and 118 EEG channels were recorded at position of the extended international 10/20-system, this dataset is appropriate to us for channels selection. During the experiment, with the reminder visual cues, each experiment lasted for 3.5s, with a resting time between two trials was randomized from 1.75 to 2.25 seconds. Each class of EEG signals consists of 140 trials. The signal recorded was band-pass filtered between 0.05-200HZ, and digitized at 1000HZ.
Research show that while imaging movements of different body parts, the phenomenon of event-related desynchronization (ERD) and event-related synchronization (ERS), causing the power attenuation or enhancement in relevant cortex areas[16]. While imaging right hand movement, the energy of right hand representation area in the left brain will increase, however, a foot movement would lead to the ERS phenomenon in right hand representation areas of both sides of the brain [17]. Based on the phenomenon of ERD/ERS, we can figure out different body parts of MI, which turn the MI BCI feasible. By this way, the EEG data we used that were downsampled at 100 Hz from 1000HZ, and band-pass filtered to the 8–32 Hz frequency band by FIR filters. This band contains the Mu (8-12HZ) and Beta (18-25HZ) rhythms which have been reported to desynchronize in the MI task [24]. These neurological phenomena have been provided to be successful in the application of BCI systems to classify EEG signals.
Channel Selection Method
Continuous Wavelet Transform
present study, the signals of each channel were calculated by complex Morlet’s wavelets approach. The same kind of imaginations strung together. Then the mean of wavelet coefficients from 8-30HZ for all 118 channels of two MI tasks were extracted for further work.
ESI for Channel Selection
NESOI [21] is used for solving EEG source imaging problem in this paper. Three-sphere head model was used and the lead-field matrix was figured out for canonical mesh by Fieldtrip software [22]. In this research, each mesh was regarded as a dipole, which include 8196 diploes with uniform distribution on the cortex.
With the help of NESOI, we could found the most obvious activity areas on the cortex. The top values on the cortex of different MIs are identified as dipole locations and included in the region of interest (ROI). In order to convert data from source domain to sensor domain, an EEG based model was provided to describe the scalp value and source activity. The selected topography was mapped onto 118 channels on the scalp through Equation (1), where A presented the lead field and X the source activities, b presented the scalp value. The channels with top values were regarded as the major channels.
b=AX (1)
Experiment Result
Feature Mapping
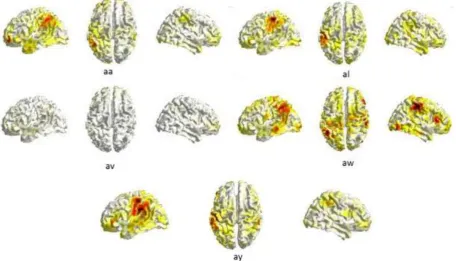
[image:3.595.71.528.503.764.2]The selected channels of data set “aa” “al” “av” “aw” “ay” ranked using EEG source imaging method are presented in this paper. The source distribution is shown in Fig. 1. Most subjects review the similar phenomenon in the left representation areas on the cortex (“aa” “al” “aw” “ay”) except one (“av”). The selected ROI position, which distribute on the surface of the cortex, turn to be distinct for each subject. For major subjects (“aa” “al” “ay”), the selected ROI are mainly spread around the similar areas but not absolutely uniform, which lead to the selected channels various. It is worth noticing that “aw” shows a special result, both left representation areas and right representation areas emerge strong in ROI, because the ERD phenomenon is strong in those areas and ERS occur robust in the opposite side of the areas (“aw”).
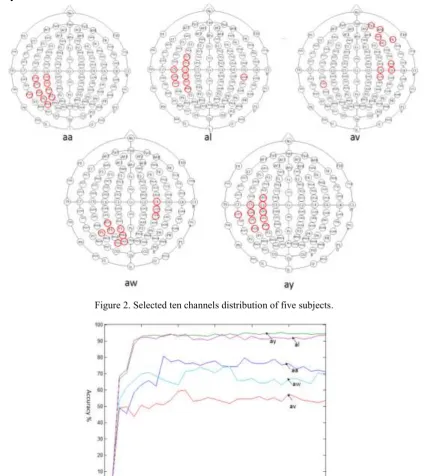
The selected channels distribution (only top ten channels are presented) are shown in Fig. 2. Most subjects have the adjacent channels (“aa” “al” “ay”) which proved to be hypothetical for further analysis. Subjects “aa” “al” “ay” share the same channels of CCP5, CCP3, CP5, CP3, PCP3 while subjects “al” “av” “aw” provide the channels on both side of the brain.
Classification result
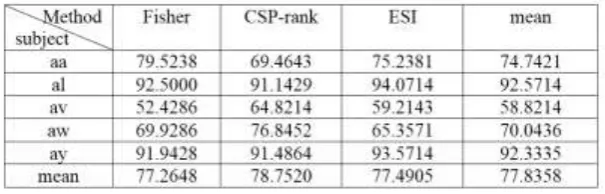
[image:4.595.83.509.236.713.2]CSP was used for feature extraction and SVM for classification in this paper. The classification rates are shown in Fig. 3 and the selected channels number are from 2 to 30. As shown Fig. 3, subjects “aa” and “ay” have the similar performance in classification result, five top channels perform perfect action and the accuracy keep steady above 90%. For all subjects, ten channels are sufficient enough to present all channels for classification without a significant reduction in accuracy.
Figure 2. Selected ten channels distribution of five subjects.
[image:4.595.171.414.551.745.2]
Figure 3. Classification of different selected channels of five subjects.
are shown in Table 1. Compared with fisher discriminant and CSP-rank, ESI manifests a high accuracy for subject “al” and “ay”. ESI perform better than CSP-rank in subject “aa” and Fisher discriminant in subject “av”. However, it is regrettable that ESI is inferior to other methods for subject “aw”.
Table 1. Classification result.
Summary
In this paper, we proposed a method based on CWT and ESI algorithm to reduce the channel number and finds those best distinguish between two classes of EEG imagery task. This achieved figure out clearly of electrodes with the help of ESI, which was regarded as the prior channels. The value of the channels was treated as the contribution degree of source location. CSP algorithm and SVM was applied for classification. With the prior channels selected, cut down a large number of channels, the performance of BCI systems keep stable.
However, noise is a factor that can’t be ignored and would greatly influence the selection of channels. Since not all 8-32HZ frequency band includes major information of particular MI, different people with various frequency bands, also diverse source location could produce disparate frequency band. The precise frequency band is beneficial for us to find out the combination of channels. In the future work, we will focus on how to reduce the influence of noise and shrinkage frequency band.
Acknowledgement
This work is financially supported by the National Natural Science Foundation of China (No.81471770) and the Natural Science Foundation of Beijing (No.7132021). We would like Technology for the database. The authors are grateful to the anonymous referee for carefully checking the details and for helpful comments that improved this paper.
References
[1] B. He, S.K. Gao, H. Yuan, J.R. Wolpaw, Brain-computer interfaces. Neural Engineering. Springer US, 2013. 87-151.
[2] L.R. Hochberg, D. Bacher, B. Jarosiewicz, N.Y. Masse, J.D. Simeral, J. Vogel, S. Haddadin, J. Liu, S.S. Cash, P. van der Smagt and J.P. Donoghue, Reach and grasp by people with tetraplegia using a neurally controlled robotic arm. Nature, 485.7398 (2012): 372.
[3] S.K. Gao, Y.J. Wang, X.R. Gao, B. Hong. Visual and auditory brain-computer interfaces, IEEE Transactions on Biomedical Engineering, 61.5 (2014): 1436-1447.
[4] G. Dornhege, B. Blankertz, M. Krauledat, F. Losch,G. Curio and K.R. Müller, Optimizing spatio-temporal filters for improving brain-computer interfacing, Advances in Neural Information Processing Systems. (2006): 315-322.
[5] F. Popescu, S. Fazli, B. Yakob, B. Blankertz and K.R. Müller, Single trial classification of motor imagination using 6 dry EEG electrodes, PloS one2.7 (2007): e637.
Scholkopf, Support vector channel selection in BCI, IEEE transactions on biomedical engineering 51.6 (2004): 1003-1010.
[7] T.N. Lal, M. Schroder, T. Hinterberger, J. Weston, M. Bogdan, N. ¨Birbaumer, and B. Scholkopf, Support vector channel selection in BCI, IEEE Trans. Biomed. Eng., vol. 51, pp. 1003-1010, 2004.
[8] Y. Yang, O. Kyrgyzov, J. Wiart and I. Bloch, Subject-specific channel selection for classification of motor imagery electroencephalographic data, Acoustics, Speech and Signal Processing (ICASSP), IEEE International Conference on. IEEE, 2013:1277-1280.
[9] J Yang, H Singh, EL Hines, F Schlaghecken, DD Iliescu, MS Leeson, NG Stocks, Channel selection and classification of electroencephalogram signals: an artificial neural network and genetic algorithm-based approach. Artif. Intell. Med. 55, 117-126 (2012).
[10] W. K. Tam, Z. Ke, K. Y. Tong, Performance of common spatial pattern under a smaller set of EEG electrodes in brain-computer interface on chronic stroke patients: a multi-session dataset study. Engineering in Medicine and Biology Society, EMBC, 2011 Annual International Conference of the IEEE. IEEE, 2011.
[11] B.J. Edelman, B. Baxter, B. He, EEG Source Imaging Enhances the Decoding of Complex Right Hand Motor Imagery Tasks. IEEE Transactions on Biomedical Engineering. 63.1 (2016): 4-14.
[12] R.D. Pasqual-Marqui, C.M. Michel, D. Lehmann, Low resolution electromagnetic tomography: a new method for localizing electrical activity in the brain. International Journal of psychophysiology 18.1 (1994): 49-65.
[13] R.D. Pascual-Marqui, Standardized low-resolution brain electromagnetic tomography (sLORETA): technical details. Methods Find Exp Clin Pharmacol 24. Suppl D (2002): 5-12.
[14] X. Lei, P. Xu, C. Luo, J.P. Zhao, D. Zhou and D.Z. Yao. fMRI functional networks for EEG source imaging. Human Brain Mapping 32.7 (2011): 1141-1160.
[15] Information on http://ida.first.fraunhofer.de/projects/bci/competition iii/desc IVa.h
[16] G. Pfurtscheller, C. Brunner, A. Schlögl and F.L. Da Silva, Murhythm (de)synchronization and EEG single-trial classification of different motor imagery tasks, NeuroImage, 31.1 (2006): 153-159.
[17] G. Pfurtscheller and F.L. Da Silva, Event-related EEG/MEG synchronization and desynchronization: basic principles, Clinical Neurophysiology 110.11(1999): 1842-1857.
[18] F. Cincotti, D. Mattia, F. Aioise, S. Bufalari, L. Astolfi, F.D.V. Fallani, A. Tocci, L. Bianchi, M.G. Marciani, S. Gao and J. Millan, High-resolution EEG techniques for brain-computer interface applications, Journal of Neuroscience Methods 167.1 (2008): 31-42.
[19] D. Mattia F. Cincotti, M. Mattiocco, G. Scivoletto, M.G. Marciani and F. Babiloni, Motor-related cortical dynamics to intact movements in tetraplegics as revealed by high-resolution EEG, Human Brain Mappping 27.6 (2006): 510-519.
[20] V. N. Vapnik and V. Vapnik. Statistical learning theory. Vol. 1. New York: Wiley, 1998.
[21] Information on http://www.leixulab.net/
[22] Information on http://fieldtrip.fcdonders.nl/download.php