5
IV
April 2017
gave an accuracy of 93.27%, a True Positive Rate of 92.27% and a False Positive Rate of 4%. Also the system was faster than the software implementation.
Keywords: Pedestrian detection, HOG, LSVM, feature extraction, classification
I. INTRODUCTION
Pedestrian detection is an important aspect due to the ever-growing number of vehicle to pedestrian accidents every year. Apart from preventing road accidents, it may also be used in security systems, robotics industry etc. However the system was mainly developed to be used in Advanced Driver Assistance System (ADAS). As per World Health Organisation (WHO) 22% of 1.25 million people die in road accidents caused by vehicle to pedestrians. Hence it’s the need of hour to prevent such a misery.
II. RELATEDWORK
A lot of research work has been done with respect to pedestrian detection detection system and is still going on. The main requirements of the system are accuracy and speed. The system comprises of feature extraction of an image, followed by classification. The researchers have tried to use the best feature extraction algorithm and the best classification algorithm to meet the needs of real time system. In 1995, there was a major success in this field when Dalal and Triggs came up with a system using HOG and LSVM in [1]. The HOG algorithm itself comprises of several steps that can be modified in a variety of ways. The researchers then experimented with different combinations and came up with their research work trading off between accuracy and speed. In [2], HOG was implemented on zynq with a detection accuracy of 90.2% and FPR of 4%. It used region of Interest (ROI), binaristaion and approximated L1-normalisation that lowered the accuracy. In [3], HOG-DOT algorithm and SVM classification was implemented on FPGA and the accuracy was further improved by CPU filtering. It achieved TPR of 94%. However it’s FPR was 5.5 % which was a little high. In [4], HOG-DWT and SVM algorithm was implemented with speed up of 27.12%, but the accuracy was greatly reduced to 85.12%. The algorithm proposed in [5] used sobel filter and L2-normalisation for high accuracy. However it wasn’t implemented on any standard dataset. In [6], [7], [8] HOG-LBP algorithm was implemented for higher accuracy but the increased computation reduced the speed greatly. In [9], Gaussian filter was used with HOG for better accuracy and virtex-5 FPGA implementation for higher speed. In [10], normalisation was replaced with binarisation to reduce the latency and complexity of the algorithm. However this reduced the overall accuracy. This was further implemented on low end Spartan-3e FPGA for higher speed. In [11], bigger block size and L1-normalisation further increased the speed but greatly decreased the accuracy. Thus we see that HOG algorithm gives the best accuracy with high speed required for real time application. Also SVM is the best classification technique for further getting higher speed. It is based on a well-defined mathematical concept unlike neural networks. Also SVM has less computation than Adaboost classification algorithm. In [12] it has been shown why SVM performs the best with HOG features. Since these algorithms involve large parallel computation it can be implemented on parallel architecture like FPGA or GPU. GPU consumes more power than FPGA and hence FPGA is preferred to GPU for further hardware acceleration in this paper.
III. ALGORITHMFORDETECTIONANDCLASSIFICATION
Technology (IJRASET)
Fig. 1 Pedestrian Detection System
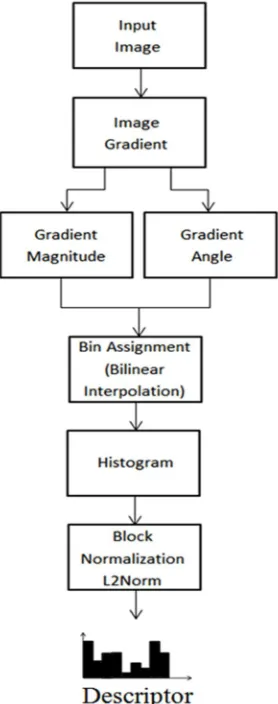
A. Histogram of Oriented Gradients (HOG)
HOG is used for feature extraction. For an image of 128x64 it gives an array of 3780 features. The steps involved in HOG is shown in Fig. 2 and further described in detail.
[image:3.612.247.386.342.694.2]= arctan (4)
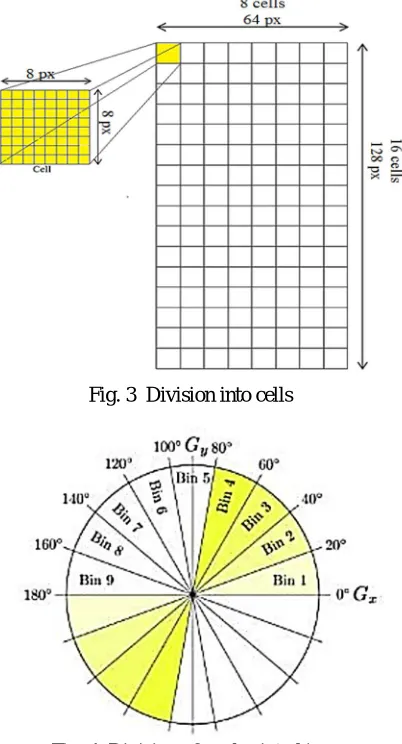
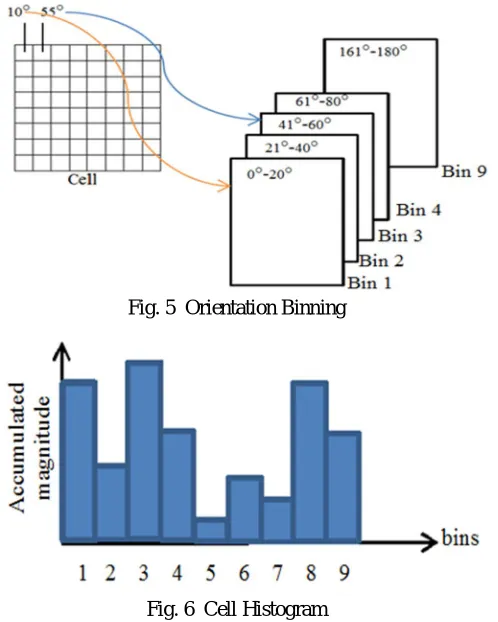
4) Cell Histogram: The image is divided into equal regions of 8x8 cells as shown in Fig. 3. Cell histogram is then computed for each cell. Histogram is an array of 9 bins in our case. We have used orientation binning to form a histogram of cell as shown in Fig.4. We have used unsigned angles and the angles between 0° to 180° are divided in equal sections of 20° each. Every span of 20° then corresponds to its respective histogram bin i.e. all angles in between 0° to 20° correspond to bin 1, angles between 20° to 40° correspond to bin 2 and so on shown in Fig. 5. For each pixel in a cell, we add its magnitude to the bin that corresponds to its angle. However the magnitude is not added directly to the bins, instead it’s bi-linearly interpolated between the bin it belongs to and the
next higher bin. Hence, we get a cell histogram as shown in Fig. 6.
[image:4.612.211.412.324.696.2]Fig. 3 Division into cells
Technology (IJRASET)
Fig. 5 Orientation Binning
Fig. 6 Cell Histogram
5) Block Histogram: The image is divided into blocks of 2x2 cells with 50% overlap as shown in Fig. 7. We simply concatenate the cell histograms of each block to get a block descriptor of 36 elements as shown in Fig. 8. For better detection accuracy the block
descriptor is further normalised using L2-normalisation technique as in (5). In (5) vk is the normalised block histogram, ||vk|| is
absolute normal of kth block and is a small constant to prevent the result from being infinite.
ν= νk
||νk|| +ε
(5)
[image:5.612.82.540.414.729.2]Fig. 9 HOG descriptor of an image
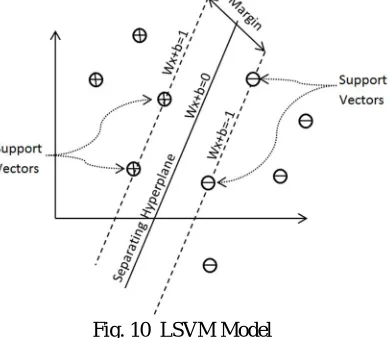
C. Linear Support Vector Machine (LSVM)
SVMs are widely used today because of its speed and simplicity. It aims to find the best separating hyperplane between the two classes of classification in our system. The concept of LSVM is depicted in Fig. 9. The largest margin between two classes is the hyperplane. The largest distance between the two classes is the margin and support vectors are the feature vectors closest to the hyperplane.
Fig. 10 LSVM Model
A hyperplane is uniquely defined by a normal vector or weight vector, w and an offset or bias, b. The LSVM algorithm is used further to find the weight vector and bias from the feature vectors of the training images. This results in a pre-trained SVM model. The steps of LSVM algorithm are detailed below:
1) Augment the Support Vectors: The support vectors or the feature set of every training image is augmented with 1 which is considered as a bias input.
2) Determine Alpha Constants, αi: For a training set of three datasets and hence three support vectors the LSVM architecture is shown in Fig. 11. The constants are then found using (6). The equations representing pedestrian class were equated to +1 and others were equated to -1.
[image:6.612.215.410.410.579.2]Technology (IJRASET)
( ). ( ) + ( ). ( ) + ( ). ( ) =−1
Φ is a mapping function which is an identity function for a LSVM And hence we get (7). The tilde symbol is used for support vectors to indicate that it is augmented with 1.
α . +α . +α . = +1
α . +α . +α . =−1 (7)
α . +α . +α . =−1
3) Weight Vector and Bias, b: We use (8) to find the augmented weight vector, w ̃. The last element of this vector is the bias, b and
the remaining elements form the weight vector, w.
=∑ = [w b] (8)
4) Classification: The weight vector, w and bias, b represent the predefined model and used to classify testing image into pedestrian and non-pedestrian classes. This is done using (9) and if the result is positive it is a pedestrian class else a non-pedestrian class.
( ) = ( × + ) (9)
Fig. 11 LSVM Architecture
IV. SOFTWARESIMULATION-MATLAB
The design was coded and simulated in Matlab R2015a. The INRIA dataset was used for simulation as it is one of the most widely used standard dataset. The details of the INRIA dataset in [16] are shown in Table I.
TABLEIINRIADATASET
Image Set Total No.
Training Images 3327
Positive training Images 2416
Negative Training Images 911
Test Images 1426
Positive Test Images 1126
Negative Test Images 300
Training Images 3327
False Positive Images 12
Correctly Detected Images 1327
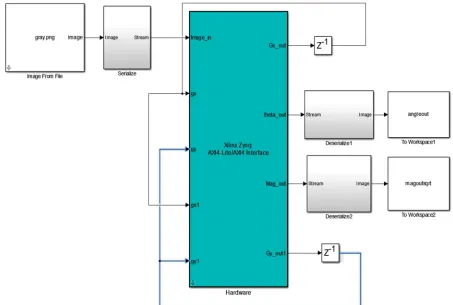
V. HARDWAREACCELEARATIONUSINGFPGA
[image:8.612.85.538.401.706.2]Technology (IJRASET)
Fig. 13 FPGA design with the IP Core
VI. CONCLUSIONS
The hardware accelerated system was successfully executed using Zed board and Matlab. The accuracy of software simulation as retained while speeding up the system. The system can be further optimised by incorporating the entire system on the FPGA itself. However as the FPGA is fixed point hardware the accuracy will be reduced. Also the same design can be used for high-resolution images with detection windows of 128x64.
REFERENCES
[1] N. Dalal and B. Triggs, “Histograms of Oriented Gradients for Human Detection,” in Proceedings of the 2005 International Conference on Computer Vision
and Pattern Recognition, vol. 2, 2005, pp. 886-893.
[2] Jens Rettkowski, Andrew Boutros, Diana Göhringer, “Real-Time Pedestrian Detection on a Xilinx Zynq using the HOG Algorithm," International Conference
on Reconfigurable Computing and FPGAs, Dec. 2005.
[3] Luca Maggiani, Cedric Bourrasset, Jean-Charles Quinton, Francois Berry, Jocelyn Serot, “Bio-inspired heterogeneous architecture for real-time pedestrian
detection applications”. Journal of Real-Time Image Processing, Springer Verlag, April 2016.
[4] Hong GS, Kim BG, Hwang YS, Kwon KK., “Fast multi-feature pedestrian detection algorithm based on HOG using DWT”. Multimedia Tools and
Applications, Springer, Jan. 2015.
[5] Berkant BAŞA., “Implementation of hog edge detection algorithm on fpga’s” In: Elsevier, Procedia - Social and Behavioral Sciences 174, 1567 – 1575, 2015.
[6] V. Campmany, S. Silva, A. Espinosa, J.C.Moure, D. V´azquez, M.L´opez, “GPU-based pedestrian detection for autonomous driving”, In: Elsevier B.V, 2016.
[7] Zhang J, Huang K, Yu Y, Tan T., “Boosted local structured hog-lbp for object localization”. In: Computer Vision and Pattern Recognition (CVPR), 2011
IEEE Conference on, IEEE, pp 1393-1400, 2011.
[8] Jun Tanabe, Sano Toru, Yutaka Yamada, Tomoki Watanabe, Mayu Okumura, Manabu Nishiyama, Tadakazu Nomura, Kazushige Oma, Nobuhiro Sato,
Moriyasu Banno, Hiroo Hayashi, Takashi Miyamor, “18.2 A 1.9TOPS and 564GOPS/W heterogeneous multicore SoC with color-based object classification accelerator for image-recognition applications”. In: Solid-State Circuits Conference-(ISSCC), 2015 IEEE International, IEEE, pp 1-3, 2015.
[9] Michael Hahnle, Frerk Saxen, Matthias Hisung, Ulrich Brunsmann, Konrad Doll, “FPGA-based Real-Time Pedestrian Detection on High-Resolution Images”.
In: IEEE, Conference on Computer Vision and Pattern Recognition Workshops, 2013.
[10] Shuai Xie; Yibin Li; Zhiping Jia; Lei Ju., “Binarization based implementation for real-time human detection”, Field Programmable Logic and Applications
(FPL), 2013 23rd International Conference on , vol., no., pp.1,4, 2-4, Sept. 2013.
[11] M. Kachouane, S. Sahki, M. Lakrouf, N. Ouadah, “HOG based fast human detection (Matlab)” In: IEEE 24th International Conference on Microelectronics,
2012.
[12] Hilton Bristow and Simon Lucey, “Why do linear SVMs trained on HOG features perform so well?”. Available at: http://arxiv.org/abs/1406.2419, June 2014.
[13] Support Vector Machines (SVM). MathWorks Documentation Center. http://www.mathworks.com/help/stats/support-vector-machines-svm.html
[14] Support vector machines: The linearly separable case. Stanford University. Cambridge Press.
http://nlp.stanford.edu/IR-book/html/htmledition/support-vector-machines-the-linearlyseparable-case-1.html. 2008.