ISSN: 1992-8645 www.jatit.org E-ISSN: 1817-3195
183
ABSTRACT
Complexities of interpretation of various ECG findings in patients with myocardial infarction are well known. This study is an attempt to find out the utility of point scoring system in diagnosing myocardial infarction. The present study was done as an analysis of the data available in the database PTB from the public domain “Physionet” where 12 lead simultaneous signals of Normal patients and Myocardial Infarction are available. Multi-lead ECGs acquired simultaneously improves the accuracy in the diagnosis of heart diseases. The signals were analyzed for each of the 34 normal patients and 33 patients who have been diagnosed to have myocardial infarction. Point score as a feature and Naïve Bayes classifier were used to assess the ECGs. The point scores and Naïve Bayes classifier found the maximum diagnostic accuracy in the lead V6 where the area under curve is 0.968 and 95.65% individuals were correctly classified. Kappa score for all the leads when both the point score and Naïve Bayes classifier was used ranged between 0.78 and 0.96 with 93% sensitivity but with the exclusion of the point scores, the same ranged between 0.61 and 0.87. We found the combination of both point scores and Naïve Bayes classification to be good predictive utility in diagnosing myocardial infarction.
Keywords—ECG, MI, Naïve Bayes, PCA
1. INTRODUCTION
Clinical symptoms and signs and
electrocardiogram forms the mainstay of diagnosis of MI as ECG reflects the cardiac physiology and serves as the prime investigation for determining the presence and location of MI [3, 4]. ST segment elevation, ST segment depression, inversion of T waves and appearance of a large Q waves have been found to indicate MI of various severity [5]. However, ST segment changes are difficult to predict earlier in the course of disease and is challenging even to experienced physicians. The ability of an independently developed QRS point score to estimate the size of infarcts predominantly within the anterior third of the left ventricular was
evaluated by quantitative
pathologic-electrocardiographic correlation. Ideker et al [6] has
proposed QRS point score for detecting myocardial infarction and the same has been validated in 21 patients where the correlation between infarct size and the point score has been found to be 0.80.
Similarly, Wagner et al [7] evaluated a similar QRS
scoring system for estimating infarct size using observations of Q- and R-wave durations and R/Q and R/S amplitude ratios in the standard 12-lead ECG and achieved a 98% specificity and 91% intra and inter-observer variability. Hence, considering the lacunae of a better strategy for diagnosing MI through electro physiologically we conducted the present study to find out the diagnostic accuracy of point scores in patients with myocardial infarction.
ECG is obtained by mapping the waves of depolarization and repolarization using electrodes placed on the extremities and chest wall. The electric potential of the heart is measured from 12 different angles using 12 leads (six each of augmented limb leads that lie vertically and pre-cordial chest leads which lie transversely) over a period of 10 seconds in each lead. ECG is a non-invasive, cost-effective diagnostic procedure widely employed to detect various cardiac diseases. Considering the automation of the ECG and availability of the portable machine to assess the same, it has become one of the prime
IMPROVED MODEL FOR THE DETECTION OF MYOCARDIAL
INFARCTION FROM MULTILEAD ECG USING
QRS POINT SCORE AS AN ADDITIONAL FEATURE
SMITA L KASAR1, MADHURI S JOSHI2
1
ASSISTANT PROFESSOR, JAWAHARLAL NEHRU ENGINEERING COLLEGE, AURANGABAD, MAHARASHTRA, INDIA
2
PROFESSOR, JAWAHARLAL NEHRU ENGINEERING COLLEGE, AURANGABAD, MAHARASHTRA,
INDIA.
ISSN: 1992-8645 www.jatit.org E-ISSN: 1817-3195
184 investigational tool in all the primary health care units in today’s world.
The ECG is a noninvasive technique that represents the extracellular electrical behavior of the cardiac muscle tissue [16]. In the Time domain the ECG signal is identified by different waves viz., P, Q, R, S, T and U. The letters P, Q, R, S, and T were chosen arbitrarily in the early days of ECG history. The ECG waveform is as shown in fig.1.1. The P wave represents atrial depolarization. The Q, R & S waves together make up a complex, QRS
complex, which represents ventricular
depolarization and T wave corresponding to the period of ventricular repolarisation. The interval between S wave and the beginning of the T wave is called the ST segment. In some ECGs an extra wave can be seen on the end of the T-wave, called as U wave. Its origin is uncertain, though it may represent repolarisation of the papillary muscles. If a U wave follows a normally shaped T wave it can be assumed to be normal. If it follows a flattened T-wave it may be pathological[17].
Fig: 1 Electrocardiogram Signal
The frequency of ECG signal varies from 0.05 Hz to 100Hz whereas the associated amplitude values vary from 0.02 mV to 5 mV. The amplitude values of human body bioelectrical signals are measured in micro volts (mV). The amplitude values of these signals are small voltage values and are being measured using traditional electronic devices.
The American heart association defines
myocardial infarction as “the damaging or death of an area of the heart muscle (myocardium) resulting from blocked blood supply to the area; medical term for a heart attack”. If severe myocardial ischemia continues, the cells die (necrosis) and acute myocardial infarction occurs. Changes in ECG appear as morphological changes in T-wave, ST-segment and (eventually Q-wave) as the different regions of the heart goes through varying degrees of ischemia, injury and infarction. Abnormal T-waves appear within seconds of an acute myocardial transmural infarction for leads that face the ischemic zone of the heart. The T-waves become abnormally tall and peaked. The QT-intervals are usually prolonged. The
ST-segment becomes highly elevated because of injury current generated by the leakage of ions across the cell membranes. ST-segment elevation indicates severe and extensive myocardial ischemia and injury. The segment is usually considered elevated if the segment is 0.1mV or greater above baseline. While leads facing the zone of ischemia record an elevation, opposite (reciprocal) leads record a
depression. ST-segment elevation is often
accompanied by increased amplitude in the QRS-complex during the early stages of AMI. ST-segment depression in the facing leads indicates the occurrence of subendocardial ischemia and injury, and may appear down sloping, horizontal or up sloping. Usually no Q-wave results from this less severe form of AMI [18]
ISSN: 1992-8645 www.jatit.org E-ISSN: 1817-3195
185 [24] uses automatic extraction of both time interval
and morphological features, from the
Electrocardiogram (ECG) to classify ECGs into
normal and arrhythmic. Classification is
implemented by artificial neural networks and Linear Discriminant Analysis.
2.METHODS
The present study was done as an analysis of the data available in the public domain. “Physionet” (http://www.physionet.org/) is an online web access to a large collection of ECG signals from various spectrums of individuals ranging from normal healthy volunteers to different cardiac diseases. This is the largest available online database of ECG containing 549 records from 290 individuals of which 148 were diagnosed to have acute myocardial infarction. Each record includes 15 simultaneously measured signals: the conventional 12 leads (i, ii, iii, AVr, AVl, AVf, V1, V2, V3, V4, V5, V6) together with the 3 frank lead ECGs. The signals were analyzed for each of the 34 normal patients and 33 patients who have been diagnosed
to have myocardial infarction.
The proposed system is divided into four steps (i) ECG preprocessing, (ii) Data reduction, (iii) Calculation of feature vector, and (iv) Classification by Naïve Bayes Classifier
ECG preprocessing : In the signal processing applications it is desired to remove the distortions or noise leaving the original signal unchanged. There are different sources for ECG signal distortions. Few of the ECG contaminants are Electrode contact noise, Motion artifact, muscle
contractions, baseline wander, powerline
interference. [25]. A second order IIR notch filter is used for preprocessing the ECG signal. The notch filter is designed to remove the powerline interference and the low pass filter removes the baseline wander. . Moreover the classification depends on the morphological features of the signal , so excessive filtering is avoided.
Data reduction and calculation of Feature Vector: QRS complex is the most prominent feature in electrocardiogram because of its specific shape; therefore it is taken as a reference in the feature extraction. Detection of R wave are very useful in analyzing ECG features, thus form the basis of ECG feature extraction. Modern era of medical science is supported by computer aided feature extraction and disease diagnostics in which
various signal processing techniques have been utilized in extracting features from the biomedical signals and analyzes these features. The objective of computer aided digital signal processing of ECG signal is to reduce the time taken by the cardiologists in interpreting the results. R peak detection is the first and foremost step in finding the QRS complex. Other morphological features like RR interval are calculated.
Figure 2: R Peak Detected For Signal S0021arem From PTB
Principal component analysis (PCA) is a statistical technique , a way of identifying patterns in data, and expressing the data in such a way as to give emphasis to their similarities and differences. Since patterns in data can be difficult to find in data of high dimension, PCA is a powerful tool for analyzing data. The principal components are derived as a linear combination of the variables of the data set, with weights chosen so that the
principal components become mutually
uncorrelated. Each component contains new information about the data set, and is ordered so that the first few components account for most of the variability[26] .
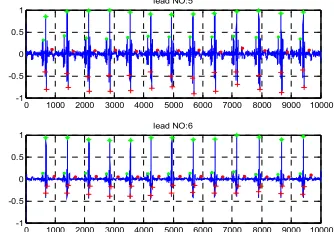
The Principal component analysis is applied on
[image:3.612.335.502.583.699.2]the simultaneous 12 lead ECG signal. The fiducial points P,Q,R,S,T are located in each of the 12 leads and the corresponding features like R duration, Q duration, ST deviation are calculated for each lead separately.
Fig. 3: Features Extracted From Leads After Applying PCA.
0 1000 2000 3000 4000 5000 6000 7000 8000 9000 10000 0
0.1 0.2 0.3 0.4 0.5 0.6 0.7 0.8 0.9 1
R Peak
0 1000 2000 3000 4000 5000 6000 7000 8000 9000 10000 -1
-0.5 0 0.5 1
lead NO:5
0 1000 2000 3000 4000 5000 6000 7000 8000 9000 10000 -1
-0.5 0 0.5 1
ISSN: 1992-8645 www.jatit.org E-ISSN: 1817-3195
186
Okajima et al [8] scoring system was
[image:4.612.91.287.225.404.2]followed in the current study. Point scores are obtained by summing the scores for the leads meeting the respective criteria(Table 1).Detection of anterior, lateral or inferior myocardial infarction, or a combination of the two or three of them, is made by this point score. The point allocation system is given as follows,
Table 1. Point Scoring System For Identification Of Myocardial Infarction Okajima Et Al [8]
Position
criteria
Anterior Lateral Inferior
V2 V3 V4 I V5 V6 II III aVF
Q/R≥1/3 & Q≥36
(34,32)ms 3 3 3 3 3 3 3 2 3
Q/R≥1/3 & Q≥28
(26,24)ms 2 2 2 2 2 2 2 1 2
Q/R≥1/4 & Q≥24
(22,20)ms 1 1 1 1 1 1 1 0 1
With all three leads T<-0.1mV
3 3 3
With two leads T<-0.1mV
2 2 2
With one lead T<-0.1mV
1 1 1
Threshold values for Q durations are aligned in the following order: criteria for adults aged over 18 years, for those aged between 12-17 years and for those aged below 11 years.
In case of point score on both QRS and negative T criteria:
[image:4.612.84.306.546.655.2]≥8: definite infarction; ≥6: possibility of infarction; ≥4: cannot rule out infarction.
TABLE 2 : POINT SCORE CALCULATION FOR SIGNAL S0015lrem FROM PTB DATABASE
Lead Amplitude
Ratio (Q/R) Q Duration
T Amplitude
Remark
I 0.0865 29 -0.0146
Definite Infarction
II 0.2444 33 0.1837
III 0.5327 33 0.2779
aVF 0.3536 37 0.2307
V2 2.3129 34 0.0696
V3 3.5663 36 0.0359
V4 0.4694 40 0.0471
V5 0.0847 40 0.0511
V6 0.1197 16 0.0126
Classification using Naïve Bayes classifier
Naïve Bayes is one of the simplest probabilistic classifiers. The model constructed by this algorithm is a set of probabilities. Each member of this set corresponds to the probability
that a specific feature fi appear in the instances of class c, i.e., P(fi¦c). These probabilities are estimated by counting the frequency of each feature value in the instances of a class in the training set. Given a new instance, the classifier estimates the probability that the instance belongs to a specific class, based on the product of the individual conditional probabilities for the feature values in the instance. The exact calculation uses Bayes theorem and this is the reason why the algorithm is called a Bayes classifier. The algorithm is also characterized as Naïve, because all the attributes are independent given the value of the class variable. Naive Bayes [9] is a simple technique for constructing classifiers models that assign class labels to problem instances, represented as vectors of feature values, where the class labels are drawn from some finite set and morphological, transform and calculated features constitute the feature vector for the classification. The point score plays very important role in the signal analysis. The attributes used in the Naïve Bayes are P, Q, R, S and T wave amplitudes, QR and RS amplitude ratios, point score, Q and R duration and ST deviation. Tests of diagnostic accuracy (sensitivity, specificity with 95% confidence intervals) were used to find out the association between point score and diagnosis of myocardial infarction. Kappa statistics was used for finding out the agreement of the classification into normal and myocardial infarction.
3. RESULTS
ISSN: 1992-8645 www.jatit.org E-ISSN: 1817-3195
[image:5.612.93.527.42.415.2]187 Bayes classifier, 92% sensitivity was obtained (Table 5).
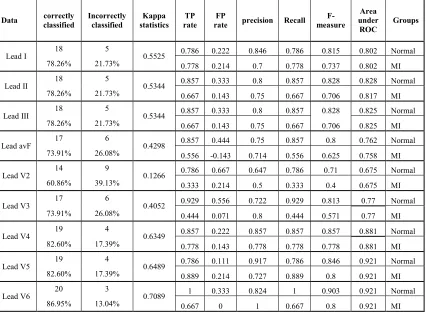
The Table 6 shows accuracy achieved by the classifier for lead V6 dropped to 86.95% in the absence of point score in the feature vector. The kappa statistic also dropped to 0.7089.
[image:5.612.307.513.151.362.2]Fig 4: Comparison Of Kappa Statistics
Fig 5: Comparison Of Correctly Classified Percentage Including And Excluding Point Score In The Feature Set.
Predictive analytics, a table of
confusion (sometimes also called a confusion matrix), is a table with two rows and two columns
that reports the number of false positives, false
negatives, true positives, and true negatives. This allows more detailed analysis than mere proportion of correct guesses (accuracy). Each row in the confusion matrix represents an observed class, each column represents a predicted class, and each cell counts the number of samples in the intersection of those two classes. The Confusion matrix for the present work is given below.
Table 4: Confusion Matrix With Point Score As One Of The Feature
Lead
I
N MI
Lead
V3
N MI
N 10 4 N 12 2
MI 0 9 MI 1 8
Lead
II
N MI
Lead
V4
N MI
N 11 3 N 13 1
MI 1 8 MI 1 8
Lead
III
N MI
Lead
V5
N MI
N 11 3 N 12 2
MI 2 7 MI 0 9
Lead
aVF
N MI
Lead
V6
N MI
N 11 3 N 13 1
MI 1 8 MI 0 9
Lead
V2
N MI
N 11 3
MI 1 8
Table 4: Confusion Matrix Without Point Score As One Of The Feature
Lead I
N MI
Lead V3
N MI
N 11 3 N 13 1
MI 2 7 MI 5 4
Lead II
N MI
Lead V4
N MI
N 12 2 N 12 2
MI 3 6 MI 2 7
Lead III
N MI
Lead V5
N MI
N 12 2 N 11 3
MI 3 6 MI 1 8
Lead aVF
N MI
Lead V6
N MI
N 12 2 N 14 0
MI 4 5 MI 3 6
Lead V2
N MI
N 11 3
MI 6 3
Table 5: Tests Of Diagnostic Accuracy Of The Point Score Between Normal And Patients With Myocardial Infarction In The Lead 12 With And Without Point Score
Into Consideration
With Point Score
Without Point score
Sensitivity 93% 78.50%
Specificity 1 0.33
4. DISCUSSION AND CONCLUSION
ECG forms a mainstay of diagnosing many cardiovascular diseases like ischemic heart disease, arrhythmias and drug induced cardiac effects. ECG interpretation has been considered as one of the most difficult task by many physicians throughout the world both in the developed and developing
countries [11]. A study from France by Snoey et al
that had analyzed the ECG interpretation of the emergency physicians and cardiologist in the emergency department of a tertiary care hospital in 300 consecutive ECG’s (of which 154 errors were considered to have clinical significance by the cardiologist) and found that the concordance was weak (kappa = 0.32) [12]. Another recent study from Turkey (a developing country) also revealed the difficulty in understanding/interpreting, poor knowledge and a need for intensive training of the physicians in ECG in the field of emergency
medicine [11]. Masoudi et al [13] evaluated the
0 0.2 0.4 0.6 0.8 1 L ea d 1 L ea d 2 L ea d 3 L ea d a vF L ea d v2 L ea d v3 L ea d v4 L ea d v5 L ea d v6 K ap p a S tat is ti c s ECG Leads
score taken as a feature
[image:5.612.320.517.424.479.2]ISSN: 1992-8645 www.jatit.org E-ISSN: 1817-3195
188 impact of misinterpretation of ECGs in patients with acute myocardial infarction in a retrospective cohort study in around 1700 patients and found that high-risk ECG findings suggestive of myocardial infarction was missed in 12% of the patients. Further the authors of the same study had documented a mortality of 8% resulting from such misinterpretation of ECGs. The diagnosis of myocardial infarction has to be as quick as possible because the best results will be achieved only if thrombolytics are administered within first two
hours of diagnosing the condition [14]. Berger et al
analyzed the outcome of patients with myocardial infarction who were treated with thrombolytics at different time points and found out that the 30-day mortality rate was significantly lower for patients treated within the first 30 minutes while delay in the therapy initiation beyond 30 and 90 minutes were associated with an increase in 1-year mortality rates of 9% and 27%, respectively, compared with delays for patients treated within 30 minutes [15]. Considering the difficulty that vest with the ECG interpretation especially in diagnosing the ST segment changes in patients with ischemic heart disease, few authors suggested point score as an alternative to diagnose myocardial infarction.
Wagner et al [7] evaluated 29 criteria of point
scoring in patients with myocardial infarction and found that all the criteria had established at least 95% specificity and all the criterions put together had 98% specificity even in the presence of various confounding factors like ventricular hypertrophy, bundle branch and fascicular blocks.
The morphology of P, Q, R, S, T waves changes depending on the lead position. Multi-lead ECGs acquired simultaneously improves the accuracy in the diagnosis of heart diseases. The proposed model with the improved feature vector has been presented to classify ECG signals. The point score is calculated depending on QRS complex and T amplitude from nine leads. The improved feature vector enhances the performance to recognize and classify the ECG with better accuracy for Myocardial Infarction signals. The present study assessed the utility of a point scoring system in diagnosing patients with myocardial infarction from the largest available collection of ECG signals. We found out that a combination of both the point score and Naïve Bayes classifier in 09 leads predicts better than either of it alone. To conclude, we found that the combination of both point scores as one of the feature and Naïve Bayes classifier to be good
predictive utility in diagnosing myocardial
infarction. Further large scaled studies are required
to confirm the same.
REFERENCES:
[1] Murray CJ, Vos T, Lozano R, Naghavi M,
Flaxman AD, Michaud C, et al.
Disability-adjusted life years (DALYs) for 291 diseases and injuries in 21 regions, 1990–2010: a systematic analysis for the Global Burden of Disease Study 2010. Lancet 2012;380:2197– 23.
[2] Moran AE, Forouzanfar MH, Roth GA,
Mensah GA, Ezzati M, Flaxman AD, et al. The
global burden of ischemic heart disease in 1990 and 2010: the Global Burden of Disease 2010 study. Circulation 2014;129:1493–1501.
[3] Brandt RR, Hammill SC, Higano ST.
Electrocardiographic diagnosis of acute
myocardial infarction during ventricular
pacing. Circulation 1998;97:2274-75.
[4] Birnbaum Y, Drew BJ. The electrocardiogram
in ST elevation acute myocardial infarction: correlation with coronary anatomy and prognosis. Postgrad Med J 2003;79:490-504.
[5] Cardiology teaching package from The
University of Nottingham. Available at: http://www.nottingham.ac.uk/nursing/practice/r esources/cardiology/acs/changes.php
[6] Ideker RE, Wagner GS, Ruth WK, Alonso
DR, Bishop SP, Bloor CM, et al. Evaluation of
a QRS scoring system for estimating myocardial infarct size. II. Correlation with quantitative anatomic findings for anterior infarcts. Am J Cardiol. 1982;49:1604-14.
[7] Wagner GS, Freye CJ, Palmeri ST, Roark SF,
Stack NC, Ideker RE, et al. Evaluation of a
QRS scoring system for estimating myocardial infarct size. Circulation 1982;65:342-7.
[8] Okajima M, Okamoto N, Yokoi M, Iwatsuka
T, Ohsawa N. Methodology of ECG
interpretation in the Nagoya program. Methods Inf Med. 1990;29:341-5.
[9] Naive Bayes algorithm. Available at:
http://www.cs.columbia.edu/~mcollins/em.pdf
[10]Afonso VX. ECG QRS detection. Available at:
http://www.physik.uni-freiburg.de/~severin/ECG_QRS_Detection.pdf
[11] Ahmedali A, Sener A, Kavaakli HS, Celik
GK, Icme F, Otal Y, et al. Determination of the
level of emergency medicine resident
physicians to recognize the
ISSN: 1992-8645 www.jatit.org E-ISSN: 1817-3195
189
[12] Snoey ER, Housset B, Guyon P, ElHaddad S,
Valty J, Hericord P. Analysis of emergency
department interpretation of
electrocardiograms. J Accid Emerg Med. 1994;11:149-53.
[13] Masoudi FA, Magid DJ, Vinson DR, Tricomi
AJ, Lyons EE, Crounse L, et al. Implications
of the failure to identify high-risk
electrocardiogram findings for the quality of care of patients with acute myocardial infarction. Circulation 2006;114:1565-71.
[14] White HD, Van de Werf FJJ. Thrombolysis
for acute myocardial infarction. Circulation 1998;97:1632-46.
[15] Berger AK, Radford MJ, Krumholz HM.
Factors associated with delay in reperfusion therapy in elderly patients with acute
myocardial infarction: Analysis of the
Cooperative Cardiovascular project. Am Heart J 2000;139:985-92
[16]Jaakko Malmivuo, Robert Plonsey ,
Bioelectromagnetism : Principles and
Applications of Bioelectric and Biomagnetic Fields
[17]John R. Hampton, ‘The ECG made Easy”,
Churchill Livingstone Elsevier, ISBN 978-0-443-06826-3
[18]Gari Clifford, Advanced methods and tools for
ECG signal Analysis, Springer
[19]J.Pan, W.J.Tompkins, ‘A real time QRS
detection Algorithm’,IEEE Transactions on
Biomedical Engineering,Vol, BME-32, No. 3, March 1985
[20]Gary M, Friesen, Thomas C. Jannett, Manal
Afify Jadallah, Standford L. Yates, Stephen R.Quint, H.Troy N Nagle, ‘A Comparision of the Noise Sensitivity of Nine QRS Detection
Algorithms’, IEEE Transactions on Biomedical
Engineering,Vol, 37, No. 1, March 1990
[21]V. S. Chourasia, A. K. Tiwari, R.
Gangopadhyay and K. A. Akant, Foetal phonocardiographic signal denoising based on
non-negative matrix factorization, Journal of
Medical Engineering & Technology, 2012; 36: 57–66.
[22]S. Karpagachelvi, Dr.M.Arthanari,
M.Sivakumar,ECG Feature Extraction
Techniques - A Survey Approach, (IJCSIS)
International Journal of Computer Science and information Security, Vol. 8, No. 1, April 2010
[23]Iva Bogdanova, Francisco Rincon, David
Atienza , ‘A Multi-Lead ECG Classification
Based On Random Projection Features’,
ICASSP 2012: IEEE Transactions on
Information Technology in Biomedicine, Mar 25-30, 2012, Kyoto, Japan, pp 625-628
[24]C Alexakis, HO Nyongesa, R Saatchi, ND
Harris, C Davies, C Emery, RH Ireland, SR Heller, Feature Extraction and Classification of Electrocardiogram (ECG) Signals Related to
Hypoglycaemia, IEEE Computers in
Cardiology 2003, pp 537−540.
[25]Gary M, Friesen, Thomas C. Jannett, Manal
Afify Jadallah, Standford L. Yates, Stephen R.Quint, H.Troy N Nagle, ‘A Comparision of the Noise Sensitivity of Nine QRS Detection
Algorithms’, IEEE Transactions on Biomedical
Engineering,Vol, 37, No. 1, March 1990
[26]Varun Gupta, Ramveer Singh, Gavendra
Singh, Rajvir Singh,An Introduction to
Principal component Analysis and Its
ISSN: 1992-8645 www.jatit.org E-ISSN: 1817-3195
190
Table 6: Comparison Of Kappa Statistics
Kappa Statistics: Lead I Lead II Lead III Lead avF Lead v2 Lead v3 Lead v4 Lead v5 Lead v6
Point score taken as a feature 0.6618 0.6489 0.5525 0.6489 0.6489 0.7315 0.8175 0.8244 0.9105
[image:8.612.85.531.195.400.2]Point score not taken as a feature 0.5525 0.5344 0.5344 0.4298 0.1266 0.4052 0.6349 0.6489 0.7089
Table 7. Summary Of The Features Extracted For Each Of The Leads (N=67) In Mean (Sd)
Lead s Amplitud e ratio Q/R Q duration T amplitud e Point Score Amplitude Ratio R/S
P amplitud
e
R duration ST
Deviation S amplitud
e
N M N M N M N M N M N M N M N M N M
I 0.08 0.11 4.24 4.6
2 0.0 6 0.0 7 1.0 4 4.8
1 3.67 6.81
0.0 2 0.1 1 13.3 5 17.5 1 0.0 6 0.0 7 0.1
2 0.1
II 0.05 4.32 4.37 5.7
5 0.0 7 0.1 3 1.0 4 4.8
1 3.12 4.53
0.0 5 0.1 3 16.1 3 20.6 5 0.0 9 0.1 1 0.0
7 0.2
III 0.43 10.6 8.06 5.7
9 0.0 4 0.1 6 1.0 4 4.8 1 11.2 8 13.2 6 0.0 4 0.2 1 25.5
3 21.5
0.0 6 0.2 3 0.1 1 0.4 6
AVF 0.11 3.92 7.26 4.8 0.0
5 0.1 4 1.0 4 4.8
1 4
25.3 7 0.0 5 0.1 7 20.0 3 21.3 1 0.0 8 0.1 7 0.0
7 0.3
V2 6.27 40.25 13.13 9.6 0.2 0.2
1 1.0
4 4.8
1 1.3 0.8
0.1 7
0.1
3 8.99 13.5
0.3 1 0.2 9 0.8 3 0.8 4
V3 0.44 24.03 6.85 9.4
9 0.2 2 0.2 1 1.0 4 4.8
1 2.28 1.26
0.0 4
0.1
7 8.04 9.87
0.2 5
0.4
1 0.5 0.6
V4 0.06 4.62 5.34 7.4 0.1
9 0.1 2 1.0 4 4.8
1 2.74
11.8 1
0.0 4
0.1
3 7.46 13.3
0.2
4 0.2
0.3 5
0.4 1
V5 0.04 0.63 4.31 5.5
9 0.1 5 0.0 9 1.0 4 4.8
1 3.48 4.56
0.0 3 0.1 1 10.3 9 15.5
9 0.2 0.1
0.1 9
0.2 1
V6 0.05 1.45 2.62 4.7 0.1 0.0
7 1.0
4 4.8
1 3.89 8.04
0.0 3 0.0 8 15.2 3 20.6 9 0.1 3 0.0 9 0.0 9 0.1 3
[image:8.612.88.519.432.711.2]N-Normal individuals; M-Patients with myocardial infarction
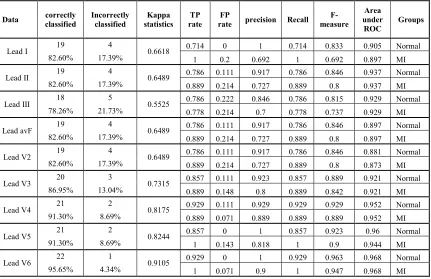
Table 8: Diagnostic Accuracy With Point Score As One Of The Feature Using Naive Bayes Classifier
Data correctly
classified Incorrectly classified Kappa statistics TP rate FP
rate precision Recall
F-measure Area under ROC Groups
Lead I 19 4 0.6618 0.714 0 1 0.714 0.833 0.905 Normal
82.60% 17.39% 1 0.2 0.692 1 0.692 0.897 MI
Lead II 19 4 0.6489 0.786 0.111 0.917 0.786 0.846 0.937 Normal
82.60% 17.39% 0.889 0.214 0.727 0.889 0.8 0.937 MI
Lead III 18 5 0.5525 0.786 0.222 0.846 0.786 0.815 0.929 Normal
78.26% 21.73% 0.778 0.214 0.7 0.778 0.737 0.929 MI
Lead avF 19 4 0.6489 0.786 0.111 0.917 0.786 0.846 0.897 Normal
82.60% 17.39% 0.889 0.214 0.727 0.889 0.8 0.897 MI
Lead V2 19 4 0.6489 0.786 0.111 0.917 0.786 0.846 0.881 Normal
82.60% 17.39% 0.889 0.214 0.727 0.889 0.8 0.873 MI
Lead V3 20 3 0.7315 0.857 0.111 0.923 0.857 0.889 0.921 Normal
86.95% 13.04% 0.889 0.148 0.8 0.889 0.842 0.921 MI
Lead V4 21 2 0.8175 0.929 0.111 0.929 0.929 0.929 0.952 Normal
91.30% 8.69% 0.889 0.071 0.889 0.889 0.889 0.952 MI
Lead V5 21 2 0.8244 0.857 0 1 0.857 0.923 0.96 Normal
91.30% 8.69% 1 0.143 0.818 1 0.9 0.944 MI
Lead V6 22 1 0.9105 0.929 0 1 0.929 0.963 0.968 Normal
ISSN: 1992-8645 www.jatit.org E-ISSN: 1817-3195
[image:9.612.89.515.116.430.2]191
Table 9: Diagnostic Accuracy Without Point Score As One Of The Feature Using Naive Bayes Classifier
Data correctly
classified
Incorrectly classified
Kappa statistics
TP rate
FP
rate precision Recall
F-measure
Area under
ROC
Groups
Lead I 18 5 0.5525 0.786 0.222 0.846 0.786 0.815 0.802 Normal
78.26% 21.73% 0.778 0.214 0.7 0.778 0.737 0.802 MI
Lead II
18 5
0.5344 0.857 0.333 0.8 0.857 0.828 0.828 Normal
78.26% 21.73% 0.667 0.143 0.75 0.667 0.706 0.817 MI
Lead III
18 5
0.5344 0.857 0.333 0.8 0.857 0.828 0.825 Normal
78.26% 21.73% 0.667 0.143 0.75 0.667 0.706 0.825 MI
Lead avF 17 6 0.4298 0.857 0.444 0.75 0.857 0.8 0.762 Normal
73.91% 26.08% 0.556 -0.143 0.714 0.556 0.625 0.758 MI
Lead V2 14 9 0.1266 0.786 0.667 0.647 0.786 0.71 0.675 Normal
60.86% 39.13% 0.333 0.214 0.5 0.333 0.4 0.675 MI
Lead V3 17 6 0.4052 0.929 0.556 0.722 0.929 0.813 0.77 Normal
73.91% 26.08% 0.444 0.071 0.8 0.444 0.571 0.77 MI
Lead V4 19 4 0.6349 0.857 0.222 0.857 0.857 0.857 0.881 Normal
82.60% 17.39% 0.778 0.143 0.778 0.778 0.778 0.881 MI
Lead V5 19 4 0.6489 0.786 0.111 0.917 0.786 0.846 0.921 Normal
82.60% 17.39% 0.889 0.214 0.727 0.889 0.8 0.921 MI
Lead V6 20 3 0.7089 1 0.333 0.824 1 0.903 0.921 Normal
![Table 1. Point Scoring System For Identification Of Myocardial Infarction Okajima Et Al [8]](https://thumb-us.123doks.com/thumbv2/123dok_us/8909169.958373/4.612.91.287.225.404/table-point-scoring-identification-myocardial-infarction-okajima-et.webp)