QUALITY ANALYSIS OF LOCAL GOVERNMENT
WEBSITES IN INDONESIA
TB. M. YUSUF KHUDRI, DWI MARTANI, TEGUH I. MAULANA
Accounting Department, Faculty of Economics, Universitas Indonesia Gd. Departemen Akuntansi, Kampus Baru FEUI Depok, Indonesia, 16424
Phone: +6221-7272425 E-mail: [email protected]
ABSTRACT
This research aims to analyze design quality of local government’s website and its statistics. Design quality is determined by several prior studies and this research employed population data of local government websites in Indonesia based on direct observation during May 2013. Analysis was done descriptively and inferentially which shown that there are some variations among local governments in Indonesia regarded its website’s quality. But in general, unsatisfaction results are found in most of websites. In other hand, low visit to the websites indicates that any possibility of low awareness from users of information about condition and governmental activities in their area. Moreover we found that own local revenue as well as governmental size are among important factors that influencing design quality of local government’s website in Indonesia.
Keywords: Local, Government, Website Design, Indonesia, Website Quality
1. INTRODUCTION
Bureaucratic reform in Indonesia, especially in the area of financial management is characterized by the release of a variety of package of laws which set more stringent financial management and utilization of the country’s finance resources. Transparencey is one of the issues in public financial management which have a lot of attention. The issue of transparency in Indonesia before the reform era (before 1998) is a sensitive matter that is difficult to achieve due to restrictions on access of information by the ruling regime. Though Shuler, Jaeger and Bertot (2010) stated that the transparency and the right of access to public sector information is a fundamental form of participatory democracy, encouraging confidence in the government, preventing corruption, decision making, improve the accuracy of information governance, as well as other basic functions in in society.
On the other hand, in line with the development of information technology, the use of web-based information system in public services either for information dissemination or being the part of the services it self, become the latest trend in public administration (Wong and Welch, 2004). Use of information technology is seen as a positive
channel to raise the level of accountability in the public sector and public empowerment (La Porte, de Jong, and Demchak, 2002). In international practice, particularly related to transparency, the presence of information technology significantly reduces costs to collect, cost to distribute and cost to access public sector information (Roberts, 2006). Additionally, with more and more information is expected to be delivered in a timely fashion that it can improve the transparency of the public sector and improve the ability of the public to monitor the performance of public institutions (Wong and Welch, 2004).
district and/or city. Studies conducted by analyzing the perfect precursor to study the entire site of local goverment available so that research results can indicate the actual conditions faced by each region. Then this study was to formulate a guide to local government in designing the site area is in line with expectations and the best standards available.
2. LITERATURE REVIEW AND
HYPOTHESIS DEVELOPMENT
Many channels can be utilized to deliver or disseminate mandatory information to the public such as papers or other electronic media. Along with the development of information technology, especially the Internet, to further facilitate the provision and public access to information. Beattie and Pratt (2001) revealed that the Internet is considered a potentially revolutionary process for reporting due to the use of the internet has a global scale, interactiveness, and good access speed. In international practice, Roberts (2006) states that the internet significantly reduces the cost of collection, distribution, and access to government information. Public should have easier access to important information that previously could only be done through a printed document (Sari and Martani, 2012) . The use of the Internet to encourage a reasonable transparency is not only in its technological capacity , but also because the Internet can meet most of the expectations of society (Jaeger and Bertot, 2010).
Measuring the level of voluntary disclosure on the internet can be done at the level of disclosure and presentation of the content on the insitutional website. Perez, et al (2005 ) in his study of information content said that public goverment should have website that include, namely (1) the budget and cash flow information , (2) financial information , (3) an indication of the management and the services provided . Whereas in the case of disclosure presentation Perez , et al (2005) defines the design and navigation of the site includes six important things that have an impact on the level of access to site administration , namely: (1) information that is easily recognizable , (2) personalize the information presented to the user, (3) ease of transfer of information , (4) ease of management information provided, (5) the use of different languages for expressing information, and (6) ease of interaction with the user.
While research related to the quality look of the site is limited . Though the site may display quality is one of the important factors that affect the
information the user will use the site as their source of information. Hermana and Silfianti (2011) evaluate the application site in implementing e-government in Indonesia based on the characteristics of the web, web popularity and webmetrics. Although not specifically focused on the quality of the appearance of the site, the results of their study showed webpage there is a difference between Java and outside Java. Research from Hermana et. Al, (2012) who tried to examine the quality of one local government websites based on web feature. Although limited web features are used , the results of their study showed that the profile of the area is the most common feature is presented while the FAQs is the most uncommon feature is presented on the local governments’s websites .
The hypothesis developed in this study based on analysis of the factors that are considered to have an influence on the quality of local government websites in previous studies . In general, the identified variables are grouped into the financial capacity of local and regional characteristics , which include financial capacity of local government and characteristics of local government,
2.1 Local Government of Municipalities and Cities Financial Capacity
2.1.1 Local government spending
Perez et al (2009) said that local government with better financial conditions have more capacity to build better information technology infrastructure, better information technology infrastructure, among other things can be used as a vehicle to disseminate more information to the public. On the other hand, the signaling theory in the private sector stated that the disclosure of information may be a signal to the user about information related to the conditions faced by these entities. In relation to local government spending, local government will reveal more development success through capital expenditures, but a routine expenditures such as personnel spending or spending on goods / services will likely not disclosed. Based on these literatures we make our hypothesis as follows:
H2 : There is a negative relationship between the amount of local governemnt’s personnel expenditure to quality of Local Government’s website design.
H3 : There is a negative relationship between the amount of spending on goods / services area to quality of Local Government’s website design.
2.1.2 Own source revenue
Dependence on the transfer of funds has been one of the many variables tested in various studies related to governance in the public sector. Ingram (1984) which looked at the transfer of funds as a higher state media to put pressure on the lower levels of government in running the governance area. While Giroux and McLelland (2003) have shown that the local income reflects the region's ability to support the running of governance in the region. The higher revenue implies the higher the ability to prepare a good medium for communicating information to the public. Based on these literatures we make our hypothesis as follows:
H4 : There is a positive relationship of the amount of own source revenue of the local government to the quality of local government’s website quality
2.2 Charateristic of Municipalities or City
2.2.1 Type of local goverment
Giroux and McLelland (2003) found that there is a difference between a city that has a city manager or mayor-council major policies related to their governance. In the Indonesian context because all directly elected regional head, regional head of determining the difference is irrelevant. However, there are differences in the characteristics of the area in the form of county or city considered to be having an impact on the quality of governance in local government. Martani and Lestiani (2012) have tried to look at the impact of the type of districts and cities on the disclosure of financial information, but did not find a significant difference, although both show a positive direction. This is probably due to the limited sample used in their study. Based on these literature we make our hypothesis as follows:
H5 : There are differences in the quality of the local government website design between districts and cities in Indonesia.
2.2.2 Number of Population
As one of the stakeholders of a local government agency, the population have very important roles in encouraging transparency in local government efforts, for example the higher number of people asking for information then the pressure would also increase which encourages local governments to provide better medium to deliver better information. Piotrowski & Bertelli (2010) found that there is a positive influence among the population with information and discolure of financial statements. Similar variables have also been used Ingram (1984) in his research. Based on these literatures we make our hypothesis as follows:
H6 : There is a positive relationship of the population of an area to quality of local government’s website quality
3. RESEARCH METHODOLOGY AND DATA
The data of this study came from 491 local government of regional/municipalities or cities in Indonesia, each of every website of the local government was accessed in May 2013 using google search engine (http://www.google.co.id) as an entry point, concerning consistency of the result, assesment of the websites done by the researches to ensure uniformity of the asssesment. The url of website found by using keyword “kota namakota” (city name of the city) or “kabupaten namakabupaten” (Municipalitiy Name of The Municipality). The researchers using regional or municipalities in Bahasa Indonesia based on facts that municipalities or regional or city using english name was hard to found.
3.1 Research Model
Research model of this research adapt some of the precursor research model with some changes in the measurement of the dependent and independent variables which are tailored to the availability of data in Indonesia. Models used in this study are as follows:
DESIGN = β0 + β1CAPSPEN +
β2EMPSPEN + β3GOODSPEN
+ β4PAD + β5POP + β6TYPE + ε … (1)
the goods spending of the local government, PAD is own source revenue of the local government, POP is number of population, TYPE is the dummy variable of the type of local government
[image:4.595.99.281.210.362.2]municipalities or cities.
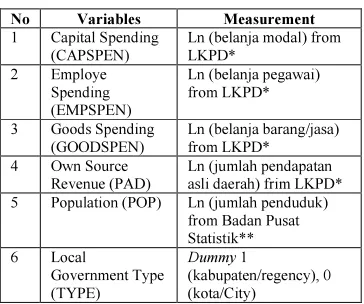
Table 1. Summary of Variables
No Variables Measurement
1 Capital Spending (CAPSPEN)
Ln (belanja modal) from LKPD*
2 Employe
Spending (EMPSPEN)
Ln (belanja pegawai) from LKPD*
3 Goods Spending (GOODSPEN)
Ln (belanja barang/jasa) from LKPD*
4 Own Source
Revenue (PAD)
Ln (jumlah pendapatan asli daerah) frim LKPD* 5 Population (POP) Ln (jumlah penduduk)
from Badan Pusat Statistik**
6 Local
Government Type (TYPE)
Dummy 1
(kabupaten/regency), 0 (kota/City)
* LKPD = Laporan Keuangan Pemerintah Daerah, Local Government Financial Reports, data taken was from LKPD the year of 2011.
** Badan Pusat Statistik (National Statistics Bureau of Indonesia) of the year 2011.
4. RESEARCH RESULT
4.1 Descriptive Statistics
This study use data of population of all local government in municipalies or cities level in Indonesia based on the standardization of the code and the province, municipalities / cities in Indonesia which governed by the Regulation of the Minister of Home Affairs No. 66 in 2011. This limits the research on the official website of the municipalities or city, not includes websites of other units in municipalities or city which reside outside of the official website of the municipalities or city. As an illustration for "Kabupaten Aceh Selatan ", the search engine Google on July 12, 2013, gives "Website Resmi Kabupaten Aceh Selatan " with url "www.acehselatankab.go.id/" and performed the analysis by using a list of questions that have been made .
This study aimed to assess the quality of a website by adopting a framework of quality of websites developed by Hasan & Abuelrub (2011), which consists of several parts: content, design, organizations or settings, user- friendlyness, and this research adding yet another element that is
visitor counter, and recorded the number of visitors during the data collection, in February 2013 - May 2013. Further adjustment of the framework of a study made by Hasan & Abuelrub (2011) is the question about design use only one question for the design, since at this time the website design in general has had a variety of colors, so for design made just one question , namely website design contains a slider or moving images on the front page, while the substance was contained to the question of the existence of image, sound and video, more to the substance or multi media explaining the purpose, while designed more towards placement in website display.
The highest value of quality of the local government website by 39 of the maximum value of 43, obtained by two municipalities, they are Buleleng Regency (Bali) and Garut (West Java), while the mode is 0m as many as 84 municipalities or city government, the average value of the quality of the website is: 19.66, and the median us 23. For a possible total score of 43 quality assessment is a website that is a result of the 43 items were assessed for each of the website of district / city. From site 491 urban districts that have position of the top 10 scores are Kab. Buleleng regency. Garut regency. South Solok, Kab. Timor Tengah Utara, Bekasi, Kab. Klungkung regency. Purwakarta, Bandung, Pekalongan, and Sawahlunto, on the other hand thereis 84 municipalities or city that have 0 for their scores of quality of the websites.
For a site that has a website visitor counter we recorded 227 city district government site features a visitor counter while the remaining 264 did not have a visitor counter feature, of the 227 sites that have a visitor counter feature, recorded Mandailing Natal regency, Samosir regency, had a number of visitors 0, while North Buton district, the district was, Gorontalo City has a number of visitors to 1, this is probably due to the feature is shown, but it does not work, that can be caused by one of the data storage system for data the number of visits.
table 2, table 3 presented table urban districts with the 10 smallest number of visitors.
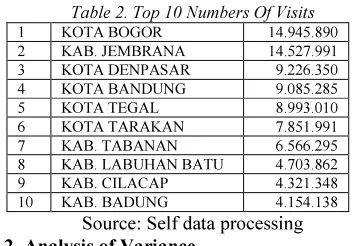
[image:5.595.93.271.361.484.2]Based on the data above, among others, there are 84 local government of municipalities or cities websites quality that get the value of 0, so it can be concluded early that concern of local government of municipalities or city towards the development of websites is relatively low, and this may also be affected by the needs of the community for accessing websites municipalities and/or city, which was the highest Bogor City only has the number of visitors by approximately 15 million , however the total visits to the websites of the municipalities and/or city in total at the time of data taken amounted to: 167,870,197, but it is uncertain origin , and which parts are accessible, because the study did not dissect, intention of user visits the website of local government of municipalities and/or cities.
Table 2. Top 10 Numbers Of Visits
1 KOTA BOGOR 14.945.890
2 KAB. JEMBRANA 14.527.991
3 KOTA DENPASAR 9.226.350
4 KOTA BANDUNG 9.085.285
5 KOTA TEGAL 8.993.010
6 KOTA TARAKAN 7.851.991
7 KAB. TABANAN 6.566.295
8 KAB. LABUHAN BATU 4.703.862
9 KAB. CILACAP 4.321.348
10 KAB. BADUNG 4.154.138
Source: Self data processing
4.2. Analysis of Variance
Subsequent analysis in the form of analysis of variance to determine the possible presence of differences in the quality of the site design is based on several indicators
[image:5.595.91.285.614.743.2]One-way analysis of variance is done with the grouping municipalities or cities by sorting the size of own source revenue, with 50 municipalities or cities with the highest own source revenue and 50 municipalities or city with the lowest own source
Table 3. Lowest 10 Numbers Of Visits
1 KAB. PEKALONGAN 70
2 KAB. NABIRE 322
3 KAB. POLEWALI MANDAR 452
4 KAB. SEMARANG 573
5 KAB. KENDAL 899
6 KAB. KEPULAUAN ARU 1.043
7 KAB. PURWOREJO 1.226
8 KAB. BOLAANG
MONGONDOW
1.255
9 KOTA PEKALONGAN 1.443
10 KAB. KEPULAUAN SIAU,
TAGULANDANG
1.638
Source: Self data processing
Table 4. Result Of Analysis Of Variance With Own Source Revenue Grouping As Independent
Variable And Websites Quality.
Sum of Squares
Df Mean
Square
F Sig.
Between
Groups 3442,989 2
1721,4
95 16,809 0,000
Within
Groups 49978,888 488 102,41 6
Total 53421,878 490
Source: Self data processing
revenue, while the rest, put in a separate group. From the results of this analysis obtained p = 0.000 which is smaller than 0.05 so there is a significant difference in the value of quality design websites on the group municipalities or cities when grouped by own source revenue.
Analysis of varians with data grouped by municipalities or cities based on equalization funds resulted a significant result with p = 0.008 which is smaller than 0.05, so there is a significant difference in mean of the value websites quality on the group municipalities or cities when grouped by the amount of matching funds.
Results of analysis of variance for the mean of the quality of site design municipalities or cities grouped by total revenues showed significant results ( pp = 0.002 , less than 0.05 ), indicating that there are significant differences between municipalities or cities when grouped according to total revenue.
Similar results were obtained from the one-way analysis of variance of municipalities or cities grouped by number of population, the grouping uses 50 municipalities or cities with the highest population and 50 municipalities or cities with the lowest population, then the rest, put in a separate group From the results of this analysis obtained p = 0.000 which is smaller than 0.05 so there is a significant difference in the value of quality design websites on municipalities or cities grouped based on population .
according by spending on goods and services . As well as related capital expenditures , obtained p = 0.209 which is greater than 0.05 so there is no significant difference in the value of quality design websites on the group municipalities or cities when grouped according by capital expenditures .
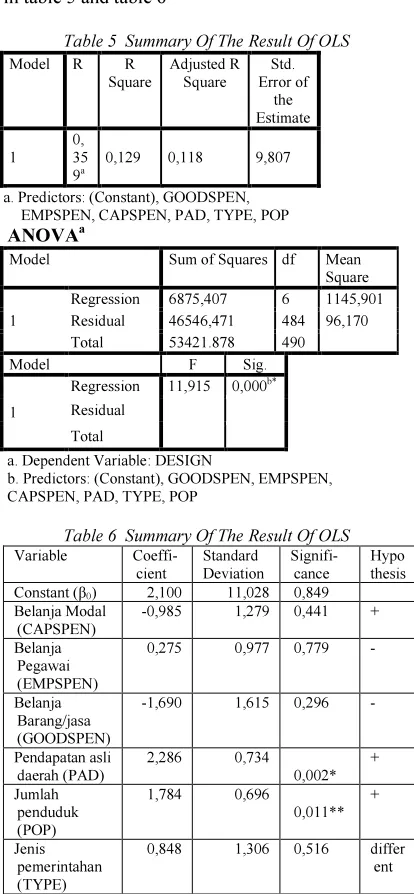
[image:6.595.86.293.264.711.2]In the final analysis, carried out by analyzing the inferential model that has been developed in the previous section. In general, the results of statistical tests of the model can be seen in table 5 and table 6
Table 5 Summary Of The Result Of OLS
Model R R
Square
Adjusted R Square
Std. Error of
the Estimate
1 0, 35
9a 0,129 0,118 9,807
a. Predictors: (Constant), GOODSPEN, EMPSPEN, CAPSPEN, PAD, TYPE, POP ANOVAa
Model Sum of Squares df Mean
Square
1
Regression 6875,407 6 1145,901
Residual 46546,471 484 96,170
Total 53421.878 490
Model F Sig.
1
Regression 11,915 0,000b*
Residual
Total
a. Dependent Variable: DESIGN
b. Predictors: (Constant), GOODSPEN, EMPSPEN, CAPSPEN, PAD, TYPE, POP
Table 6 Summary Of The Result Of OLS
Variable
Coeffi-cient
Standard Deviation
Signifi-cance
Hypo thesis Constant (β0) 2,100 11,028 0,849
Belanja Modal (CAPSPEN)
-0,985 1,279 0,441 +
Belanja Pegawai (EMPSPEN)
0,275 0,977 0,779 -
Belanja Barang/jasa (GOODSPEN)
-1,690 1,615 0,296 -
Pendapatan asli daerah (PAD)
2,286 0,734 0,002*
+
Jumlah penduduk (POP)
1,784 0,696 0,011**
+
Jenis pemerintahan (TYPE)
0,848 1,306 0,516 differ
ent
notes: * Significant at 1%, ** Significant at 1% 5%
There are only two significant explanatory variables affect the local government government of municipalities or city quality of websites that is own source revenue (2.286, sig 0.002) and number of population (1,784 , sig 0.011) . The estimations supports the hypothesis that both own source revenue (PAD) and the number population has a positive influence on the local government of municipalities or city quality of websites. These results indicate that local financial capacity , as reflected in the higher levels of PAD (own source revenue) greatly affect the region's ability to provide quality information for media users. Higher own source revenue (PAD) can be interpreted as an indicator of the success of regional development so that the local government of municipalities or city will most likely do their best to allocate the fund from income generated to communicate through the best channel available.
In line with the effect of own source revenue, where the number population is also have had positive influence which is confirmed research by Piotrowski & Bertelli (2010). Number of population who also have good quality of education can put pressure on local authorities to provide adequate information . So that the local government will strive to provide a good medium as a means of delivering information one through qualified local government official website.
Although financial capacity in the form of own source revenue (PAD) has significant influence, but related to the capacity of regional spending is considered not affect the quality of the site design. Capital expenditures (-0.985 , 0.441 sig ) has a negative effect on the quality of the design , it may implicitly means that the local government has not been able to take advantage of assessed their official website in communicating development programs . Although it can also mean when there is an increase in capital expenditure allocations are used for the management of information media to be reduced .
the reason that have a positive impact on design quality . Ingram (1984 ) stated that when an area gain a large portion of the transfer of funds from the central government , the central government has more power to put pressure on the local government regarding the conduct of governance in the region.
While spending on goods / services as expected has a negative impact, though not significantly . The nature of spending on goods / services (such as the purchase of official cars , official travel) are utilized for the benefit of local government officials tend to be regarded as a waste of state money. To avoid public pressure, the local government of municipalities or city will likely limit the information related expenditures of goods / services. In other words, when spending on goods / services, level of quality website design will get worse in order to restrict public access to certain information .
Variables are also considered insignificant is the type of government ( 0.848, 0.516 sig ) . These results inform that there is no difference in quality between the local government of municipalities and city. Decentralization since the passage of the reform push every area of open access to resources that can move . Resources are no longer qualified to urban areas , due to the current county area can have the same opportunities to develop their local governance systems , especially related media public transparency . These results were supported by descriptive statistics which show that areas that have a good quality website design fairly evenly in the district and city groups. Even the top four areas occupied by the local government of municipalities.
5. CONCLUSIONS
According to analysis conducted on the local government of municipalities or city in Indonesia, it can be concluded that, overall, there is variation across municipalities or city in Indonesia in terms of website design quality. It also can be stated that most of the website managed by local government municipalities or city in Indonesia is still considered low in term of quality. It was found that there are large variations local government of municipalities or city websites utilization by users. Unfortunately almost 50 % local government of municipalities or city websites do not show the statistical information about their visitors, but it can be concluded the number of user of local
government of municipalities or city websites is still low. This can be a concern for the managers of the site that is now the local government of municipalities or city websites are less attractive to users, may be due to poor design quality, but further research can be done to determine whether the low level of utilization can be result from the low quality of the websites or the apathetic state of the user in general.
From the results of the analysis of variance showed significant differences between the quality of website design areas based on population, own source revenue, the amount of capital expenditures, personnel expenditures, spending on goods / services. The uneven quality of the design of each region is a logical effect of the statistical picture. The very real inequality seen in areas that are generally categorized in the low group for all indicators with high indicator group .
This study also shown that revenue and population are important factors that encourages local government to provide a high quality website. The high level of own source revenue (PAD) become an important resource for the region because it shows the ability of the region in obtaining independent funding sources. The higher a fund 's ability to make increased local flexibility in managing and providing high quality website. On the other hand, especially if the number of people qualified to put pressure on local government to provide adequate information. This prompted the local government must provide a good means one of them through the site .
6. LIMITATIONS OF RESEARCH
REFERENCES:
[1] Beattie, V., dan Pratt, K. (2001).Business reporting: Harnessing the power of the internet for users. Edinburgh: Institute of Chartered Accountants of Scotland.
[2] Giroux, Gary, dan McLelland, Andrew J.
(2003). Governance structure and accounting
practice at large municipalities. Journal of
Accounting and Public Policy, 22, 203-230. [3] Hasan, L. & Abuelrub, E. (2011). Assessing
the quality of web sites. Applied Computing and Informatics 9, 11-29.
[4] Hermana B., & Silfianti W. (2011). Evaluating e-government implementation by local government: digital divide in internet based public services in Indonesia. International Journal of Business and Social Sciences 2 (3), 156-163.
[5] Hermana B., Tarigan A., Medyawati H., & Silfianti W. (2012). Information richness, website feature, and financial transparency on the local government website in Indonesia. Journal of Theoretical and Applied Information Technology, 43 (2), 229-236. [6] Ingram, Roberts W. (1984). Economic
incentives and the choice of state government accounting practices. Journal of Accounting Research, 22 (1), 126-144.
[7] Jaeger, Paul T., Bertot, John C. (2010). Transparency and technological change: Ensuring equal and sustained public access to government information. Government Information Quarterly, 27, 371-376.
[8] La Porte, Todd M., Martin de Jong, dan Chris Demchak. (2002). Democracy and bureaucracy in the age of the web.Administration and Society 34,411–426.
[9] Martani, Dwi, dan Lestiani, Annisa. (2012). Disclosure in local government financial statements: the case of Indonesia. Global Review of Accounting and Finance, 3 (1), 67-84
[10]Perez, C.C., Hernandez, A.M, dan Bolivar, M.P. (2005). Citizen access to online governmental financial information: Practices in the European Union Countries. Government Information Quarterly 22, 258-276.
[11]Piotrowski, S. J. (2007). Governmental transparency in the path of administrative reform. New York: SUNY Press.
[12]Piotrowsky, S.J., & Bertelli, A. 2010. Measuring Municipal Transparency. 14th IRSPM Conference, Bern, Switzerland, April.
[13]Roberts, A. (2006). Blacked out: Government secrecy in the information age. New York: Cambridge Press.
[14]Sari, Rora P. & Martani, Dwi. (2012). Analisis pengaruh kinerja dan karakteristik PEMDA terhadap tingkat pengungkapan dan kualitas informasi dalam website PEMDA. Makalah dipresentasikan pada Simposium Nasional Akuntansi 2012.
[15]Shuler, J. A., Jaeger, P. T., &Bertot, J. C.
(2010). Implications of harmonizing
e-government principles and the Federal
Depository Library Program
(FDLP).Government Information Quarterly,
27, 9−16.