© 2005 - 2014 JATIT & LLS. All rights reserved.
ISSN: 1992-8645 www.jatit.org E-ISSN: 1817-3195
ATTRIBUTE VALUE PAIRS BASED ON DISCERNIBILITY
MATRIX FOR OUTLIERS DETECTION
MISINEM,AZURALIZA ABU BAKAR, ABDUL RAZAK HAMDAN, FAIZAH SHAARI
Center for Artificial Intelligence Technology (CAIT),
Faculty of Information Science and Technology, University Kebangsaan Malaysia 43600
E-mail: {misinem_kur, aab, arh}@ftsm.ukm.my, [email protected]
ABSTRACT
Outlier mining is one important task in data mining and it has always been receiving attention from many researchers. The detection of outliers is found useful in many real applications like fraud detection and network intrusion. There are many outlier detection methods found in literature which include the frequent pattern generation and Rough Set based outlier detection. Although many methods have been proposed in data mining, the problems in detecting outliers efficiently continue especially in many real applications, due to the high dimensionality of huge data sets and high computational in processing. In this study, we proposed a method to detect outliers by discovering interesting attribute value pairs based on the Discernibility Attribute Value Matrix (DAV) in Rough Set Theory (RS). Interesting attribute value pairs (avp) are generated from the DAV Matrix. Two measures which are the support and interest value are used to measure the interestingness of the attributes. In order to detect outliers, a new measurement called the DAV Outlier factor (DAVOF) is proposed. In addition, an Average Ratio (AR), which measures the performance of the outlier detection method is also proposed. The DAV algorithm (DAVAlg) is compared with the FindFPOF and RSetAlg methods. The result shows that the DAVAlg outperforms the other two methods.
Keywords: Outliers Detection, Discernibility Attribute Value (DAV) Matrix, Attributes Value Pairs (avp)
1. INTRODUCTION
An outlier as defined by Hawkins [1] is an observation that deviates so much from other observation as to arouse suspicion that it was generated by a different mechanism. According to Agrawal and Yu [2], an outlier is a data point which is very different from the rest of the data based on some measures. Figure 1, shows the outlier as the points which are far away from the distribution of data. The outlier mining focuses on rare data in which the behaviour is much deviated when compared with the rest of the amount of data. This deviation identification can lead to a discovery of unexpected knowledge.
Outlier detection has received much attention from many researchers in many application areas. For example, in fraud detection to detect fraudulent applications for credit card, intrusion detection to detect unauthorized access in computer networks, medical condition monitoring, satellite image analysis, outbreak detection and other applications [2], [3].
Although many techniques have been proposed in data mining, the detection of outlier problems still faces many problems in real application, due to the increase of dimensions of data and requirement of more computation time, especially in the frequent pattern approach [4]. Some methods face the problem of high dimensionality datasets, like in the distance-based method [5], density-based [6], and frequent pattern based on an Apriori algorithm [7], [8].
© 2005 - 2014 JATIT & LLS. All rights reserved.
ISSN: 1992-8645 www.jatit.org E-ISSN: 1817-3195
The Rough Set Theory (RS) which has been
introduced by Pawlak in 1980 [9], [10], [11] is a technique for identification and recognition of common patterns in data, especially in the case of uncertainty and incomplete information. Several outlier detection methods which are based on the RS are explored by [12], [13], and[14]. In[12], the algorithm detects outliers based on the minimal exception degree using upper and lower boundary in the RS, which is able to detect the outlier in the boundary region of complex data sets. Shaari et.al, [14] use the RS approach to detect outliers where a set of New Reduct is computed. The New Reduct is referred to as the Non Reduct. Another example of an outlier detection method based on the RS has been proposed by Jiang et al, [13] which is based on the distance-based method, in this method uses the Value Difference Metric (VDM) following the work of Stanfill and Waltz [15] in which an appropriate distance function for nominal attributes can be identified by using the ability of the discernibility matrix.
In this study, the capability of the Discernibility matrix in RS is the main interest. A Discernibility Attribute Value (DAV) matrix is proposed from the concept of Discernibility matrix where each entry of the matrix consists of a set of attribute-value pairs that discern between two equivalence classes. Objects by discern properties in an Information System (IS) are more interesting to represent knowledge of a system than the objects which are indiscern. In RS, the DAV attribute value pair is expected to be able to present interesting items and precise knowledge of the matrix. Thus, it is able to uncover hidden knowledge from the outliers detected.
The performance of the DAV method is also measured by proposing a new measurement namely the Average Ratio (AR). The AR is formulated by assuming there are possibilities that more than 50% of outliers may be found in the earlier rank of the search space and therefore it can be concluded that the finding of outliers has a very significant knowledge to be uncovered. In some important applications such as the anomaly detection or disease outbreak detection, the earlier detection of outliers may give a major impact. The performance of the proposed method is compared with the FindFPOF [4] method and RSetAlg [14] method and the result shows that the DAV outperforms both methods.
This paper is organized as follows: section 2 discusses the theories related to the work conducted. In section 3, the proposed method based
on the DAV matrix is explained in detail. Furthermore, results are discussed in section 4, and finally, the conclusion of this work is described in section 5.
2. RELATED WORK
Based on the literature study, outlier detection methods can be classified by two main categories, which are the statistical approach and data mining approach. In statistical approaches[16], two methods are discussed such as the Distribution-based methods and Depth-Distribution-based method. On the other hand, in the data mining approach, the Clustering Based method, Distance-based method, Frequent Pattern based method, and Rough set approach are explained.
The Distribution-based methods are based on classical statistical methods using the standard distribution model, and points which deviate from the normal distribution are identified as outliers. The limitation of this technique is that the distribution of the measurement data is unknown in practice and suffers from high computation and complexity in pre-processing of the outlier especially when data involves multivariable [17]. In the Depth-base method, the data object is organized in the convex hull layers in data space according to the peeling depth, and outliers are expected to be found from the data object with shallow depth. The limitation of this method is that the process gets more expensive as the dimension increases.
In the data mining approach, the Clustering Based method regards small cluster as outliers, as quoted by [2]. This method detects outlier as by products or noise [18] while the Distance-based
method originally proposed by [19] is defined as an object that is at least dmin, distance away from the k
percentage of objects in the dataset. The problem may occur if the dimension is large.
The Density Based method was proposed by [6] which relies on the Local Outlier Factor (LOF) of the object. The LOF indicates the degree of outlierness of the object. An object with high LOF value is regarded as an outlier. The limitation of this method is that it is very sensitive to parameter defined in the neighbourhood.
© 2005 - 2014 JATIT & LLS. All rights reserved.
ISSN: 1992-8645 www.jatit.org E-ISSN: 1817-3195
can be mined from large data sets. Thus, finding
those data points, which contain less frequent patterns, can be referred to as outliers. The limitation of this method is that it consumes high memory to find association rules for high dimensional data. Many researchers have worked in frequent pattern approach. Jiadong et al, [22] proposed the Weighted Closed Frequent Pattern Outlier Factor (WCFPOF) to measure the complete transactions, and detecting closed frequent patterns based outlier. In this method, data object that contains a more closed frequent pattern and weights of the corresponding closed frequent pattern have comparatively great value, it means that this data object is more likely to be a normal data. In contrast, data that contain relatively less closed frequent itemset is to be outlier. Wei Wei et al, [23] and Guang Min et al, [7] proposed the Length Frequent Pattern Outlier Factor (LFPOF). In this method, it concludes that a transaction containing longer superset frequent pattern is more likely to be a normal transaction. In contrast, a transaction containing short frequent pattern is to be outlier. Feng Lin et al, [8] involved maximal support of frequent pattern as a component in the outlier factor formulation. Their algorithm is called the Maximum Frequent Pattern Outlier Factor (MFPOF).
He et al [4], identified and detected outliers using the Top ratio and Coverage ratio measurements. The method is reported to consume high memory in generating association rules especially for high dimensional data. Shaari et al. [14] proposed a Non-reduct computation to detect outliers called as the RSetAlg. The Non-reduct computation method uses indiscernibility matrix modulo to reduce attribute in the Decision System. In this method, the problem of a high dimensional dataset is solved due to the reduction of attributes. However, the computation is still time consuming as the Genetic Algorithm is used for optimizing the Non reduct rules. The method uses the Rough Set Outlier Factor (RSetOF) value to rank objects where those objects with least outlier factor value are regarded as outliers. Jiang et al, [24] detected outliers based on the minimal exception degree using the upper and lower boundary in RS, which is able to detect the outlier in the boundary region of the complex data sets.
An alternative method by Jiang et al, [13] is the distance-based method. It uses the Value Difference Metric (VDM) that has been introduced by Stanfill and Waltz [15] to provide an appropriate distance function for nominal attributes. A major
drawback of the parametric approach is that most of the tests are for single attributes, yet many problems in data mining require finding outliers in multidimensional spaces. Moreover, the parametric approach required knowledge about the parameters of the data set, such as the data distribution. However, in many cases, the data distribution may not be known.
In this research, the DAV Matrix is proposed to overcome the limitations found in outlier detection method in the related works, and expected that the DAV matrix approach will be able to detect outlier.
3. THE PROPOSED METHOD
The proposed algorithm, the DAV Matrix is based on the basic concept of the Discernibility Matrix of Rough Set (RS). Basically, the Discernibility Matrix contains sets of interesting attributes that are discerns in attribute for every pair of the equivalence class. The DAV Matrix contains elements of which a set of interesting attributes value pair from an Information System (IS). This method has advantages when compared to the RSetAlg [14], this method is able to represent the IS, and generate interesting attribute value pair and indispensable attribute. The DAV is expected to be able to detect outliers based on its interesting attribute value pair which contains interesting information and may uncover hidden knowledge. The following sections discuss on the Basic Notion of RS. In section 3.1, the concept of DAV matrix will be discussed while section 3.2 describes the DAV algorithm for outlier detection, and in the last section, the Average Ratio (AR) will be introduced.
3.1 Basic Notion of Rough Set Theory (RS)
The RS philosophy is based on the assumption that every object of the universe of discourse, associates some information (data, knowledge). The advantage of RS in data analysis is that it does not need preliminary or additional information about data, such as probability distribution in statistics. The RS offers useful tools for discovering patterns hidden in the data, for data mining modelling by clustering the data through Indiscernibility Relations to form the equivalence classes. Objects characterized by the same information are indiscernible. The computation of discernibility matrix, discernibility matrix modulo, discernibility function and reducts can be found in [11], [25].
© 2005 - 2014 JATIT & LLS. All rights reserved.
ISSN: 1992-8645 www.jatit.org E-ISSN: 1817-3195
which each object has a number of attributes with
values related to it. An IS is an ordered pair A = )
,
(U A where Uis the universe, and Ais a nonempty finite set element called attributes. The element of the universe in the following set to be referred to as objects. Every attributea∈A, is a total function :
a
a U →V , where a
V is the set for
value of, call range ofa. Decision System(DS) is an A =( , )U A for which the attributes in Aare further classified into disjoint sets of condition
attributes C and decisionD
(A=CUD C, ID= ∅)[25]. In the RS, the properties of an IS are the particular interest. From an IS or a DS, the object can be discerned from one another having known the shape of the data. The basic definition of discernibility is given as follows, where given an attribute and two attributes values as input, it returns true if it is possible for the two values to be different and otherwise. The standard RS uses the ordinary definition of inequality to define the discernibility between object as shown in eq. (1) where a(xi) and a(xj) are the values of
attributes a of the objects xi and xj respectively [26].
Discerns(a, a(xi), a(xj))=(a(xi)≠a(xj)) (1) The general discernibility concept of RS intends to generate a set of interesting attributes called reducts. Reducts are the main feature in the RS theory and used for feature selection as well as for the generation of rules.
3.2 Discernibility Attribute Value Matrix (DAV)
The Discernibility Matrix in RS is a matrix of which classes are the indices. Attributes which are discern between two equivalence classes of an IS or DS are chosen as the entry elements in the matrix. Hence, it can be defined as below: for a set of
attributes ⊆ , , in the
discernibility matrix , 1≤ i, j ≤ n
= U/IND(B), where , ∈ | For i, j = 1,2,3 …, n . The entry, in
the discernibility matrix is the set of attributes from B that discern object classes, ∈ /IND(B).
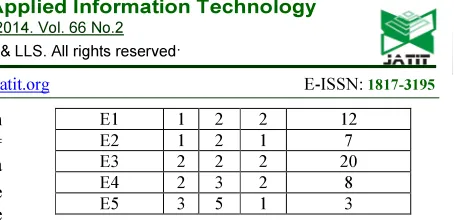
[image:4.595.290.517.73.184.2]Table 1 depicts an equivalence class from an IS. The leftmost column in Table 1 lists five equivalence classes. Each equivalence class contains three attributes A, B and C as in the second, third and fourth columns with values which represent some information of an IS.
Table 1: Equivalence classes from an IS Eq. Class A B C Total Object
E1 1 2 2 12
E2 1 2 1 7
E3 2 2 2 20
E4 2 3 2 8
E5 3 5 1 3
In this study, the discernibility concept of RS is improvised by considering not only the interesting attributes but their attribute values. The Discernibility Matrix which contains these attribute value pairs is called the DAV matrix. Each entry of the matrix consists of the sets of attribute value pairs that are discern between two equivalence class
Eiand Ej i≠ j. The element of DAV matrix reflects
the objects of interest and important item as it carries the specific attribute with its value hence each attribute is more meaningful to represent the IS or DS . By associating the attribute value pair within all elements of the matrix which are discern, a list of attribute value pair sets is generated. The DAV matrix is defined as follows:
Definition 1: Discernibility Attribute Value (DAV) Matrix
Given an Information System IS A=( , )U A ,
and a subset of attributeB⊆ A, the
Discernibility matrix of A isMB, is defined as follows:
where ,
∈ | !, ","#$.
where 1<i j, <n=|U IND B/ ( ), defined as
( , ){ : ( ) ( )}
B i j
m i j a∈B a x ≠a x [25]. Given
an Information System IS A =( , )U A , and a subset of attributeB∈A, the Discernibility Attribute Value Matrix (DAV) of A isMD, is defined as followsMD ={mD( , )}i j nxn,
1≤i j, ≤n=|U/IND B( ) |,where
(
)
. ( ) ( , ) , . ( ) ( , )
. ( ) . ( ) i
D
i j
a v E m i j i j
m i j a v Ej m j i i j
a v E a v E
≠
= ≠
≠
(2)
and a.v = attribute value.
Eq. (2) refers to the DAV matrix, where the element of DAV matrix, namely MEiEj contains the
discernible attribute value pair of the corresponding class Ei and Ej where i ≠j. Given an example of five
© 2005 - 2014 JATIT & LLS. All rights reserved.
ISSN: 1992-8645 www.jatit.org E-ISSN: 1817-3195
3.2.1. The Attribute Value Pair (avp)
The attribute value pair (avp) of DAV matrix is the elements of interesting knowledge of an IS. This knowledge is more meaningful if their occurrences are high. In this research, all attributes with values are counted for their occurrence. Some of the avp are found to have the combination of more than one avp. A list of these attributes is generated in the leftmost column in Table 2, for example C1, A2 and A2B3. The occurrences of the attribute value pair are counted. A measurement of support s based on He, at al [4] is followed where support is the number of time of an avp that occurs from the whole list of transactions which contain all
avp from a database. Therefore, the support, s,
measurement of an avp is as in eq. (3) below:
support (avp)= _
|| (3)
where, support avp is the number or frequency of occurrence of attribute value pair x from transactions, N in the dataset.
The support of attribute value pairs of an IS is shown in the second column in Table 3. For example, the support of avp C2, is 0.8 .This value indicates that the avp C2 has more occurrences, hence showing the importance and interest of the
avp.
The interest value of avp is as shown in the rightmost column in Table 3. The interest value is determined from the dependency between one attribute value pair with another. Based on [27], [28] and [29] the interest measure was introduced by Gregory Shapiro [30]. In Piatetsky-Shapiro [31] argued that a rule % ⟹ ' is not interesting if the antecedent and consequent are approximately independent. Therefore, as the interpretation in this concept of dependencies of between two avp is considered interesting, we propose the interest measure value as in Eq. (4). Where the interest (avpi, avpi+1 ) is the number of occurrences from the combination avpiand avpi+1 excluding the independent avp.
Table 2: Discernibility Attribute Value (DAV) matrix formed from an IS
E1 E2 E3 E4 E5
E1 - C2 A1 A1B2 A1B2C2 E2 C1 - - - A1B2 E3 A2 - - - A2B2C2 E4 A2B3 - - - A2B3C2 E5 A3B5C1 A3B5 A3B5C1 A3B5C1 -
Interest (avpi, avpi+1 )=
|s(avpi∪ avpi+1 )-s(avpi)s(avpi+1 )| (4)
3.2.2. DAV Outlier Factor (DAV-OF)
The DAV matrix approach follows the methodology as in He et al, [4] and Shaari et, al [14] in detecting outliers. An outlier is identified by the degree of outlierness of an object from its common. An outlier factor value is proposed and defined as the number of support and interest value of all avp in each object divided by all numbers of
avp generated from the DAV matrix. The least the outlier factor value indicates that the object in the data set is an outlier. In contrast, the object is a common object. In this research, a modified outlier factor value proposed is called as the DAV-OF.
Definition 2: Discernibility Attribute Value Outlier Factor ( DAV-OF)
Let IS= {E1, E2...En}t be the Information
System (IS) consisting of sets of equivalence classes, which have avp with the values of support(avp) and interest(avpi,avpi+1), where
support(avp) is a number of frequency of avp generated from the DAV matrix, and interest (avpi,avpi+1), is the value of the interestingness
of avp in the dataset. The total of avp is the frequency of avp generated from the DAV matrix ||avp(D)||.
The DAV-OF is calculated for every avp in equivalence class using the formula given in Eq. (5).
()*
∑ ,శభ
‖‖
(5)
where avp ∈ ,-.
Table 3: Support and interest value from IS attribute value
pairs (avp)
Support value
s(avp)
Interest value
i(avp)
A1 19/50=0.38 0.38
A2 28/50=0.56 0.56
C1 10/50=0.20 0.20
C2 40/50=0.80 0.80
A1B2 19/50=0.38 0.084
A2B3 8/50=0.02 0.0088
A3B5 3/50=0.06 0.0564
© 2005 - 2014 JATIT & LLS. All rights reserved.
ISSN: 1992-8645 www.jatit.org E-ISSN: 1817-3195
The Eq. (5) is defined as follows: if an equivalence class E contains high support and high interest value, its DAV-OF value will be high, which indicates that the objects are unlikely to be an outlier. In contrast if the value is low, it indicates the object as an outlier. As example; the DAV-OF calculations for equivalence class E5 which are
A3B5C1, A3B5 and C1 where the DAV-OF value is 0.004 as shown in the leftmost in Table 4.
The result shows that the equivalence class E5
has the lowest DAV-OF value, thus indicating the classes as outlier.
3.3. Algorithm for Outlier Detection Based on DAVAlg
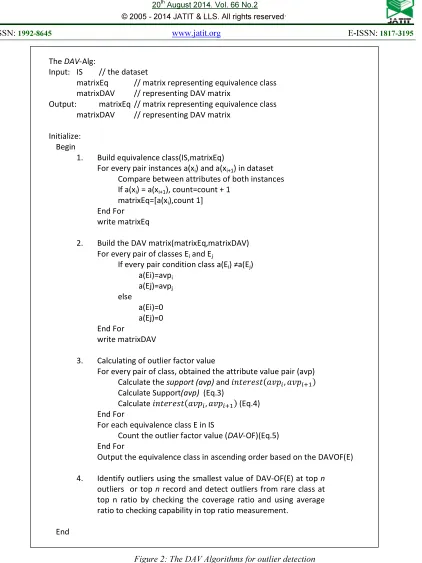
Using the DAV-OF outlier factor, we can determine the degree of outlierness for every object class in the IS. In this section, the algorithm of all processes which is called the Discernibility Attribute Value Algorithm (DAVAlg) is presented as shown in Figure 2.
This algorithm contains four main processes: building equivalence class from the IS determining the class distribution, building DAV matrix to get the avp from the IS formed by the DAV matrix based on equivalence classes, next, calculating every avp, all outlier factors using the DAV-OF are calculated from the support and interest values.
3.4. Measures for Outliers Detection
In this research, we used measurements such as the Top Ratio (TR), Coverage Ratio (CR) and Average Ratio (AR). The TR determines the cut-off point in detecting outliers in dataset. The small value of TR indicates the shorter time in detecting the all of outliers. The CR is used to calculate the number of outliers that belong to a rare class. The Average Ratio is proposed to measure the performance for every outlier detected, instead of measuring the performance of the all total outlier detected using the Top Ratio measurement. The AR is calculated to show that there are possibilities that some or more than 50% of outliers may be found in the earlier rank instead of detecting deep down the
Table 4: DAVOF value of each Equivalence class for IS
Eq. Class A B C DAV-OF
E5 3 5 1 0.004 E2 1 2 1 0.029 E1 1 2 2 0.074 E4 2 3 2 0.088 E3 2 2 2 0.132
list of all outliers. The variant of the outlier’s location can be very large in a certain data sets. Therefore, in some important applications such as the anomaly detection or disease outbreak detection, it will give major impact if we could detect some of the all outliers at an earlier stage.
Table 5, illustrates an example of the AR concepts where two different outlier detection methods namely Method I and Method II are used. We use the TR, CR and AR as measures in this table. The results showed that although in the TR measure both methods manage to detect four outliers at 86.58%, the fact is that 3 out of the 4 outliers are detected earlier at 16.78 % in Method II (see the shaded row), compare with Method I at 73.33%. The AR values are 45.51% and 26.84% for Method I and Method II, respectively. It indicates that Method II is more efficient in detecting the outliers. Eq (6) depicts the calculation of the AR. The total number of outliers is the relative frequency of outliers detected in the data.
( * _ )
_ _
n
i i
TR num outliers Average Ratio
total num outliers
− =
∑
(6)
4. EXPERIMENT SETUP, RESULTS AND ANALYSIS
The experiment was conducted for 10 UCI datasets, which have been prepared for outlier detection purpose. The preparation process of data includes distributing and forming imbalanced dataset, where it contains common case and rare cases [32], [33]. The percentage in the rare case in datasets which ranged from 1% to 10% and for common case which ranged 90% to 99% are based on the definition from the literature [5] and [33]. The step follows the process of preparing datasets for outlier detection by He et al, [32] and William et al. [33]. The proposed method is compared with the FindFPOF[4] and RSetAlg [14] as discussed earlier in Section 2.
© 2005 - 2014 JATIT & LLS. All rights reserved.
ISSN: 1992-8645 www.jatit.org E-ISSN: 1817-3195
The DAV-Alg:
Input: IS // the dataset
matrixEq // matrix representing equivalence class matrixDAV // representing DAV matrix
Output: matrixEq // matrix representing equivalence class matrixDAV // representing DAV matrix
Initialize: Begin
1. Build equivalence class(IS,matrixEq)
For every pair instances a(xi) and a(xi+1) in dataset Compare between attributes of both instances If a(xi) = a(xi+1), count=count + 1
matrixEq=[a(xi),count 1] End For
write matrixEq
2. Build the DAV matrix(matrixEq,matrixDAV) For every pair of classes Ei and Ej
If every pair condition class a(Ei) ≠a(Ej) a(Ei)=avpi
a(Ej)=avpj else
a(Ei)=0 a(Ej)=0 End For
write matrixDAV
3. Calculating of outlier factor value
For every pair of class, obtained the attribute value pair (avp) Calculate the support (avp) and , ାଵ Calculate Support(avp) (Eq.3)
Calculate , ାଵ(Eq.4) End For
For each equivalence class E in IS
Count the outlier factor value (DAV-OF)(Eq.5) End For
Output the equivalence class in ascending order based on the DAVOF(E)
4. Identify outliers using the smallest value of DAV-OF(E) at top n outliers or top n record and detect outliers from rare class at top n ratio by checking the coverage ratio and using average ratio to checking capability in top ratio measurement.
[image:7.595.94.516.82.645.2]End
© 2005 - 2014 JATIT & LLS. All rights reserved.
[image:8.595.88.509.151.314.2]ISSN: 1992-8645 www.jatit.org E-ISSN: 1817-3195
Table 5: Outliers Detection Rate using Top Ratio (TR), Coverage Ratio (CR) and Average Ratio (AR) (Num-Outlier: the number of outliers detected in equivalence classes)
Method I Method II
a* b* c* d* e* f* g* h* i* j* k* l*
1 0.67% 0(0%) - - - 1 0.67% 1(25%) 0.67% 1 0.67% 5 3.33% 1(25%) 3.33% 1 3.33% 5 3.33% 2(50%) 3.33% 1 3.33% 25 16.78% 1(25%) - - - 25 16.78% 3(75%) 16.78% 1 16.78% 28 18.79% 2(50%) 18.79% 1 18.79% 28 18.79% 3(75%) - - - 104 69.80% 2(50%) 69.80% - 0.00% 104 69.80% 3(75%) - - - 110 73.33% 3(75%) 73.33% 1 73.33% 110 73.33% 3(75%) - - - 118 79.19% 3(75%) - - - 118 79.19% 3(75%) 129 86.58% 4(100%) 86.58% 1 86.58% 129 86.58% 4(100%) 1 86.58% 150 100.00% 4(100%) - - - 150 100.00% 4(100%) - - - Total 4 182.03% Total 4 107.36% Average Ratio (AR) 45.51% Average Ratio (AR) 26.84% Top Ratio 86.58% Top Ratio 86.58% Description: a=# Rec; b=% Rec; c=CR; d=TR; e=# Outlier; f=% Outlier; (for Method I)
g=# Rec; h=% Rec; i=CR; j=TR; k=# Outlier; l=% Outlier; (for Method II)
The FindFPOF and RSetAlg are used to compare with the proposed method due to their similar characteristics and measure. Both FindFPOF and RSetAlg use the concept of frequent patterns counting and non-reducts computation which carries similar concepts of discernibility and indiscernibility.
In addition, the proposed method adopts similar methodology such as mining frequent item, mining outlier pattern and describing the outlier in terms of the outlier factors. The FindFPOF uses the apriori algorithm to generate frequent pattern with minimum support whereas the RSetAlg uses the infrequent pattern based on the indiscernibility matrix. The proposed DAVAlg generates frequent patterns using discernibility attribute value matrix as shown in Figure 3. In other words, the major differences of DAVAlg and two other methods are the types of frequent pattern extracted and the modified outlier factor measures. The proposed method uses similar datasets that were prepared in terms of the common and rare class.
Figure 3: The Global process of outlier detection in frequent pattern approach
Table 6 contains nine columns; from column 1st to column 6-nd are the characteristic of the data sets, and the last three columns are the numbers of rule and attribute value pair generated by the three methods. This research involves four steps: (i): data preparation, we prepare imbalanced datasets [32] and perform equivalence classes from the IS. Equivalence class is a class of object that is indiscernible to attributes [34]. (ii) Pattern generation, in this step we applied the DAV matrix. The DAV matrix is formed by assigning the discern attribute-value pair as the element of the matrix from every pair of equivalence class in the RS. After the DAV is formed, we calculate the count support and interest value for every avp. Hence, the third step is outlier detection, in this step we define the DAV-OF as outlier factor adapted from, [4] and [14]. Finally to measure the performance of this method we used the TR, CR and AR measurements as shown in Figure 4.
© 2005 - 2014 JATIT & LLS. All rights reserved.
[image:9.595.89.518.152.296.2]ISSN: 1992-8645 www.jatit.org E-ISSN: 1817-3195
Table 6: Comparison number of rule and attribute value pair between DAVAlg, FindFPOF and RSetAlg in outlier detection
Dataset
Imbalanced
datasets (%) #
attributes
# attribute value
Eq. Class
FindFPOF Rule
RSetAlg Rule
DAV avp Common Rare
IRS 92.23 7.77 5 20 19 42 58 36
ACC 93.90 6.10 15 50 690 172 433 450
GLS 95.79 4.21 10 11 149 678 208 459
Zoo 96.04 3.96 18 36 59 130 132 150
Coil2000 95.63 4.38 6 30 154 177 249 270
HDE 93.75 6.25 14 39 242 793 344 149
BCE 91.93 8.07 10 102 459 822 682 774
Echoli 96.72 3.28 8 20 222 494 412 477
Lym 95.95 4.05 19 64 148 78 148 150
CLV 95.70 4.30 14 20 292 534 872 423
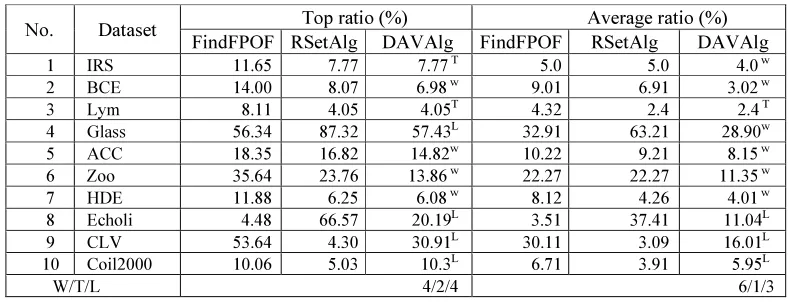
Table 7 depicts the experimental results tested upon ten datasets. In exploring the reliability and robustness of the newly developed DAVAlg
method, the experimental result is analysed. The symbol w in the results indicated that the method wins against other methods and T means that the method ties with one of the other two methods and L means that the method loses to one of the other
two methods. In the second column, a list of ten data sets is presented, while the third and subsequent column describes the percentages of detection of outliers based on the TR and AR measurement in each method. The Results showed that the DAVAlg has a better detection rate compared to the FindFPOF, when tested upon the IRS, BCE, Lym, ACC, Zoo, HDE, and CLV datasets. However, the result tested upon the Glass, Echoli and and Coil2000 datasets showed that the FindFPOF method has a better detection rate than the DAVAlg in comparison. Furthermore the results also showed that the DAVAlg has a better detection
rate compared to the RSetAlg when tested upon the BCE, Glass, ACC, Zoo, HDE, and Echoli datasets.
However, the result tested upon CLV and Coil2000 datasets showed that the RSetAlg method has a better rate than the DAVAlg. In the Average Ratio, the result showed that the DAVAlg has a better detection rate compared to the FindFPOF, when tested upon the IRS, BCE, Lym, Glass, ACC, Zoo, HDE, CLV and Coil2000 datasets. However, the result tested upon the Echoli dataset by the FindFPOF method is better than the DAVAlg in comparison. Furthermore, the results also showed that the DAVAlg is better than the RSetAlg when tested upon the BCE, Glass, ACC, Zoo, HDE, and Echoli datasets, while tests upon the CLV and Coil2000 datasets showed that the RSetAlg method is better than the DAVAlg method. In overall, the
[image:9.595.100.495.561.712.2]DAVAlg method outperforms the two other methods in terms of the Top Ratio and Average Ratio.
Table 7: Comparison of performance FindFPOF, RSetAlg and DAVAlg in outlier detection
No. Dataset Top ratio (%) Average ratio (%)
FindFPOF RSetAlg DAVAlg FindFPOF RSetAlg DAVAlg 1 IRS 11.65 7.77 7.77 T 5.0 5.0 4.0 w 2 BCE 14.00 8.07 6.98 w
9.01 6.91 3.02 w
3 Lym 8.11 4.05 4.05T 4.32 2.4 2.4 T
4 Glass 56.34 87.32 57.43L
32.91 63.21 28.90w 5 ACC 18.35 16.82 14.82w
10.22 9.21 8.15 w 6 Zoo 35.64 23.76 13.86 w
22.27 22.27 11.35 w 7 HDE 11.88 6.25 6.08 w
8.12 4.26 4.01 w 8 Echoli 4.48 66.57 20.19L 3.51 37.41 11.04L 9 CLV 53.64 4.30 30.91L
30.11 3.09 16.01L 10 Coil2000 10.06 5.03 10.3L 6.71 3.91 5.95L
W/T/L 4/2/4 6/1/3
© 2005 - 2014 JATIT & LLS. All rights reserved.
ISSN: 1992-8645 www.jatit.org E-ISSN: 1817-3195
This study shows that the Rough Set Theory is able to detect outlier using the Discernibility Attribute Value (DAV) Matrix. The attribute value pairs (avp) of the DAV matrix are elements of interesting knowledge of an IS, and this knowledge is more meaningful. In order to measure the outlierness of each object in a dataset, a new outlier factor is also proposed, which is called the DAV-OF (Discernibility Attribute Value Outlier Factor).
The measurement of the DAV-OF value gives the advantages in identifying outlier in large dimension in data sets. The performance of this proposed method is evaluated by the Top Ratio (TR) and Average Ratio (AR). The Average Ratio was introduced to measure the detection rate when outlier is found and it should give major impact if we could detect some of the outliers at an earlier stage. The results obtained suggest that the proposed method DAVAlg is a competitive method with good performance of the outlier.
REFRENCES:
[
1] Hawkins, D.M., Identification of outliers, Monograph on Applied Probability and Statistic, Reading1980: Chapman & Hall. [2] Hodge, V. and J. Austin, A survey of outlierdetection methodologies. Artificial Intelligence Review, 2004. 22(2): p. 85-126. [3] Long, Z., et al., Multiple Attribute Frequent
Mining-Based for Dengue Outbreak, in
Advanced Data Mining and Applications, L. Cao, Y. Feng, and J. Zhong, Editors. 2010, Springer Berlin / Heidelberg. p. 489-496. [4] He, Z., et al., FP-outlier: Frequent pattern
based outlier detection. Computer Science and Information Systems/ComSIS, 2005. 2(1): p. 103-118.
[5] Aggrawal, C.C., & s.Yu,P. Outlier Detection in High Dimensional Data. in SIGMOD'01. 2001. Santa Barbara.
[6] Breunig, M.M., Krigel,H.PNg.R.T& Sander,J.
LOF:Identifying density-based local outlier. in
Proc. ACM SIGMOD Int Conf on Management of Data. 2000. Dallas, Texas. [7] Guang Min, L. and S. Wang. An improved
outlier detection algorithm based on frequent pattern. in International Conference on Computer Application and System Modelling (ICCASM). 2010.
[8] Feng Lin, W.L., Jin Bo, Research on Maximal Frequent Pattern Outlier Factor for Online High-Dimensional Time-Series Outlier Detection. Journal of Convergence Information Technology, 2010. 5.
[9] Pawlak, Z., Rough sets. International Journal of Parallel Programming, 1982. 11(5): p. 341-356.
[10] Pawlak, Z., et al., Rough sets. Communication ACM, 1995. 38(11): p. 88-95.
[11] Pawlak, Z., Rough set theory and its applications to data analysis. Cybernetics and systems, 1998. 29(7): p. 661-688.
[12] Jiang, F., Y. Sui, and C. Cao, Outlier Detection Using Rough Set Theory, in Rough Sets, Fuzzy Sets, Data Mining, and Granular Computing, D. Slezak, et al., Editors. 2005, Springer Berlin / Heidelberg. p. 79-87. [13] Feng Jiang, e.a., Some issues about outlier
detection in rough set theory. Expert Systems with Applications, 2009. 36: p. 4680-4687. [14] Shaari, F., A.A. Bakar, and A.R. Hamdan,
Outlier detection based on rough sets theory.
Intelligent Data Analysis, 2009. 13(2): p. 191-206.
[15] Stanfill, C. and D. Waltz, Toward memory-based reasoning. Communications of ACM, 1986. 29(12): p. 1213-1228.
[16] Jiang, F., Y. Sui, and C. Cao, An information entropy-based approach to outlier detection in rough sets. Expert Systems with Applications, 2010. 37(9): p. 6338-6344.
[17] Angiulli, F. and C. Pizzuti, Outlier mining in large high-dimensional data sets. IEEE Transactions on Knowledge and Data Engineering, 2005. 17(2): p. 203-215.
[18] He, Z., X. Xu, and S. Deng, Discovering cluster-based local outliers. Pattern Recognition Letters, 2003. 24(9-10): p. 1641-1650.
[19] Knorr, E.M. and R.T. Ng. Algorithms for mining distance-based outliers in large datasets. 1998. Citeseer.
[20] Han, J. and M. Kamber, Data mining: concepts and techniques2006: Morgan Kaufmann.
[21] Aggrawal, R.S., R. Fast Algorithms For Mining Association Rules. in Int Proc of VLDB. 1994.
[22] Jiadong, R., et al. An Approach for Analysing Infrequent Software Faults Based on Outlier Detection. in Artificial Intelligence and Computational Intelligence, 2009. AICI '09. International Conference on. 2009.
© 2005 - 2014 JATIT & LLS. All rights reserved.
ISSN: 1992-8645 www.jatit.org E-ISSN: 1817-3195
on Frequent Pattern. in WASE International Conference on Information Engineering (ICIE). 2010.
[24] Jiang, F., Y. Sui, and C. Cao, Outlier detection using rough set theory. Rough Sets, Fuzzy Sets, Data Mining, and Granular Computing, 2005: p. 79-87.
[25] Komorowski, J., et al., Rough sets: A tutorial.
Rough fuzzy hybridization: A new trend in decision-making, 1999: p. 3–98.
[26] Bakar, A.A., Propotional Satisfiability Method in Rough Classification Modelling for Data Mining, 2001, University Putra Malaysia: Seri Kembangan.
[27] Dong, X., et al., Mining Interesting Infrequent and Frequent Itemsets Based on MLMS Model, in Advanced Data Mining and Applications, C. Tang, et al., Editors. 2008, Springer Berlin / Heidelberg. p. 444-451. [28] Dong, X., et al., Mining Both Positive and
Negative Association Rules from Frequent and Infrequent Itemsets Advanced Data Mining and Applications, R. Alhajj, et al., Editors. 2007, Springer Berlin / Heidelberg. p. 122-133.
[29] Tan, P.-n. and V. Kumar, Interestingness Measures for Association Pattern : A perspective. 1999.
[30] Piatesky, G. and Shapiro, eds. discovery, analysis and presentation of strong rule. Knowledge Discovery in Databases, ed. I.G.p.-S.a.W. Frawley1991: Cambridge, MA. [31] Wu, X., C. Zhang, and S. Zhang, Efficient
mining of both positive and negative association rules. ACM Trans. Inf. Syst., 2004. 22(3): p. 381-405.
[32] He, Z., et al., A frequent pattern discovery method for outlier detection. Advances inWeb-Age Information Management, 2004: p. 726-732.
[33] Williams, G., Baxter, R., He., Hawkins,S.,&Gu,L. A Comparative Study of RNN for outlier Detection in Data Mining. in
In Procc.of the 2n IEEE Inf. ICDM'02. 2002. Washington.