Munich Personal RePEc Archive
Towards a benchmark on the
contribution of education and training to
employability: methodological note
Garrouste, Christelle
JRC-Econometrics and Applied Statistics (CRELL)
September 2011
Online at
https://mpra.ub.uni-muenchen.de/37153/
EUR 24616 EN 2011
Christelle Garrouste
Towards a Benchmark on the Contribution of
Education and Training to Employability:
Christelle Garrouste
Towards a Benchmark on the Contribution of
Education and Training to Employability:
The mission of the JRC-IPSC is to provide research results and to support EU policy-makers in their effort towards global security and towards protection of European citizens from accidents, deliberate attacks, fraud and illegal actions against EU policies.
European Commission Joint Research Centre
Institute for the Protection and Security of the Citizen
Contact information
Address: Econometrics and Applied Statistics Unit, Via Enrico Fermi 2749 – Ispra (VA) - Italy E-mail: [email protected]
Tel.: +39 0332 785407 Fax: +39 0332 785733
http://ipsc.jrc.ec.europa.eu/ http://www.jrc.ec.europa.eu/
Legal Notice
Neither the European Commission nor any person acting on behalf of the Commission is responsible for the use which might be made of this publication.
Europe Direct is a service to help you find answers to your questions about the European Union
Freephone number (*):
00 800 6 7 8 9 10 11
(*) Certain mobile telephone operators do not allow access to 00 800 numbers or these calls may be billed.
A great deal of additional information on the European Union is available on the Internet. It can be accessed through the Europa server http://europa.eu/
JRC 61736
EUR 24616 EN
ISBN 978-92-79-18641-7 ISSN 1018-5593
DOI 10.2788/47291
Luxembourg: Publications Office of the European Union
© European Union, 2011
Reproduction is authorised provided the source is acknowledged
T
ABLE OFC
ONTENTSEXECUTIVE SUMMARY... 5
INTRODUCTION... 7
1. RELEVANCE OF THE CHOSEN BENCHMARK INDICATOR... 9
2. DEFINITION OF THE CHOSEN BENCHMARK INDICATOR...14
3. 2004-2010 HISTORICAL TRENDS...20
4. PRELIMINARY ROBUSTNESS ANALYSIS...24
4.1 SENSITIVITY TO A CHANGE IN DATA SOURCE...24
4.2 CORRELATION WITH COUNTERFACTUAL BENCHMARK INDICATORS...25
5. TOWARDS A BENCHMARK TARGET: FORECASTING METHODS AT THE HORIZON 2020 ...31
5.1 DETERMINISTIC FORECAST METHODS...31
5.2 STOCHASTIC FORECASTING:MONTE CARLO SIMULATION...35
6. RESULTS...37
6.1 SCENARIO-BASED FORECAST ESTIMATIONS...37
6.2 MONTE CARLO SIMULATIONS...41
7. DISCUSSION AND CONCLUSIONS...45
REFERENCES...48
L
IST OF FIGURESIN CORE TEXT
FIGURE 1. EMPLOYMENT RATE OF THE 20-34 YEARS OLD NOT CURRENTLY ENROLLED IN FURTHER
EDUCATION OR TRAINING, BY NUMBER OF YEARS SINCE COMPLETION OF THE HIGHEST EDUCATIONAL ATTAINMENT (EU27 AVERAGE),2009
FIGURE 2. PERCENTAGE OF 20-34 YEAR-OLDS EMPLOYED DURING THE 3 YEARS FOLLOWING THEIR
HIGHEST GRADUATION, BY LEVEL OF EDUCATIONAL ATTAINMENT
FIGURE 3. EMPLOYABILITY RATE BY EDUCATIONAL ATTAINMENT LEVEL AND BY COUNTRY,2009
FIGURE 4. EMPLOYABILITY RATE VS.EMPLOYMENT RATE,2009
FIGURE 5. EMPLOYABILITY RATE VS.GDP PER CAPITA IN PPS,2009
FIGURE 6. EMPLOYABILITY RATE VS. POPULATION AT-RISK-OF-POVERTY OR EXCLUSION
BENCHMARK,2009
FIGURE 7. EMPLOYABILITY RATE VS.EARLY SCHOOL LEAVING INDICATOR,2009
FIGURE 8. EMPLOYABILITY RATE VS.TERTIARY EDUCATIONAL ATTAINMENT BENCHMARK,2009
IN ANNEX
FIGURE A.1 SCENARIO 1ESTIMATES BY FORECASTING METHOD:FULL SAMPLE
FIGURE A.1A SCENARIO 1 ESTIMATES BY FORECASTING METHOD: UPPER SECONDARY EDUCATION
SAMPLE
FIGURE A.1B SCENARIO 1ESTIMATES BY FORECASTING METHOD:TERTIARY EDUCATION SAMPLE
FIGURE A.2 SCENARIO 2ESTIMATES BY FORECASTING METHOD:FULL SAMPLE
FIGURE A.2A SCENARIO 2 ESTIMATES BY FORECASTING METHOD: UPPER SECONDARY EDUCATION
SAMPLE
FIGURE A.2B SCENARIO 2ESTIMATES BY FORECASTING METHOD:TERTIARY EDUCATION SAMPLE
FIGURE A.3 SCENARIO 3ESTIMATES BY EDUCATIONAL ATTAINMENT
FIGURE A.4 SCENARIO 4ESTIMATES BY FORECASTING METHODS:FULL SAMPLE
FIGURE A.4A SCENARIO 4 ESTIMATES BY FORECASTING METHOD: UPPER SECONDARY AND POST
-SECONDARY NON-TERTIARY EDUCATION SAMPLE
FIGURE A.5 BASELINE INDICATOR FOR THE COMPUTATION OF THE CONDITIONAL LINEAR AND
EXPONENTIAL TREND ANALYSES, BY EDUCATIONAL ATTAINMENT AND SCENARIO: EMPLOYMENT RATE
FIGURE A.6 HISTOGRAMS OF MONTE CARLO SIMULATION RESULTS –METHOD 1, BY TEST
FIGURE A.7 HISTOGRAMS OF MONTE CARLO SIMULATION RESULTS –METHOD 2, BY TEST
FIGURE A.8 HISTOGRAMS OF MONTE CARLO SIMULATION RESULTS –METHOD 3, BY TEST
FIGURE A.9 CONSEQUENCES OF A 5PERCENTAGE-POINTS INCREASE TARGET ON THE FORECASTS OF
THE EDUCATION FOR EMPLOYABILITY BENCHMARK, BY EDUCATIONAL ATTAINMENT AND BY COUNTRY
L
IST OFT
ABLESIN CORE TEXT
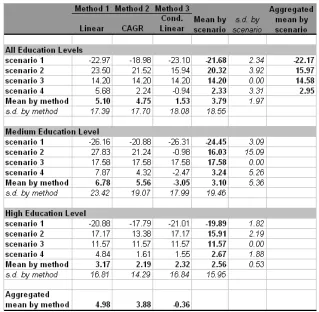
TABLE 1 SUMMATIVE TABLE OF THE DETERMINISTIC FORECASTING RESULTS: PERCENTAGE-POINT
CHANGE BETWEEN THE 2020 FORECASTED VALUE AND THE 2010 VALUE, BY METHOD, BY SCENARIO AND BY EDUCATIONAL LEVEL
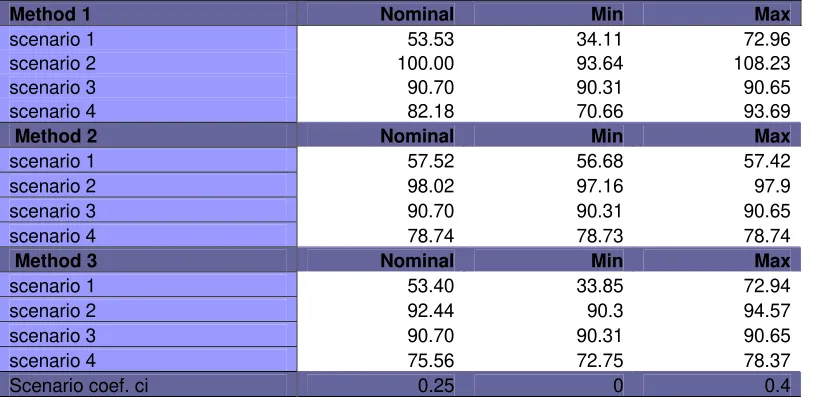
TABLE 2 MONTE CARLO SIMULATION INPUT VALUES
IN ANNEX
TABLE A.1 COUNTRY PERFORMANCE TRENDS (2004-2010), BY EDUCATIONAL ATTAINMENT LEVEL
TABLE A.2 GENDER GAP (M/F) IN COUNTRY PERFORMANCE (2004-2010), BY EDUCATIONAL
ATTAINMENT LEVEL
TABLE A.3 SCENARIO-BASED FORECAST ESTIMATES BY FORECASTING METHOD AND EDUCATIONAL
ATTAINMENT LEVEL,EU27 AVERAGE
TABLE A.4 SUMMATIVE TABLE OF THE MONTE CARLO SIMULATIONS RESULTS, BY METHOD
L
IST OFB
OXESBOX 1. DETERMINISTIC FORECASTING METHODS BOX 2. FORECAST SCENARIOS
L
IST OFC
HARTSIN CORE TEXT
CHART 1. CONCEPTUAL FRAMEWORK TOWARDS A BENCHMARK ON EDUCATION FOR
EMPLOYABILITY
IN ANNEX
CHART A.1 CEDEFOP’S CONCEPTUAL FRAMEWORK OF MODELLING THE DEMAND FOR AND SUPPLY OF
SKILLS
A
BBREVIATIONSEU27 (European Union of 27 Member States from 1 January 2007), Belgium (BE),
Bulgaria (BG), Czech Republic (CZ), Denmark (DK), Germany (DE), Estonia (EE),
Ireland (IE), Greece (EL/GR), Spain (ES), France (FR), Italy (IT), Cyprus (CY), Latvia
(LV), Lithuania (LT), Luxembourg (LU), Hungary (HU), Malta (MT), the Netherlands
(NL), Austria (AT), Poland (PL), Portugal (PT), Romania (RO), Slovenia (SI), Slovakia
(SK), Finland (FI), Sweden (SE) and the United Kingdom (UK), Turkey (TR), Croatia
(HR), Former Yugoslav Republic of Macedonia (MK), Iceland (IS), Norway (NO).
A
CKNOWLEDGMENTS
EXECUTIVE SUMMARY
Following the request from the Council Conclusions of 12 May 2009 on “Education
and Training 2020” (2009/C 119/06) to submit a proposal for a possible European
benchmark on the importance of enhancing employability through education and
training, the Directorate-General for Education and Culture (DG EAC) commissioned
to the Centre for Research on Lifelong Learning (CRELL) a series of analyses of the
contribution of Education and Training systems (E&T) to employability.
The present report presents the methodological framework applied to define
the benchmark on education for employability to be proposed to European Council in
2012: “By 2020, there should be an increase by at least 5 percentage points in the
employment rate of graduates (20-34 years old) having left education, measured as an
average of employment rates 1, 2 and 3 years after graduation” (European
Commission, 2011).
The report opens with a brief discussion of the relevance of an indicator on the
transition from education to work as a proxy of the contribution of education and
training systems to employability. In turn, section 2 presents the construct of the
indicator and section 3 displays the corresponding 2004-2010 historical trend data
computed by EUROSTAT, using the EU-LFS survey (extracted on September 14,
2011). Moreover, section 4 reports results from preliminary robustness checks,
confirming the validity of that data to measure employability.
Further, section 5 explains the methods applied to define the target value at the
horizon 2020. Three deterministic forecasting methods and one stochastic method
were retained for their relevance to the present exercise, namely the traditional linear
trend forecasting technique, the compound annual growth rate (CAGR), the
conditional linear trend model and the Monte Carlo simulation technique. These
methods are presented and applied in order of the least to the most sensitive to
volatility and uncertainty of the estimates. Each of the deterministic forecast methods
has been computed on four broad scenarios, applying the logic of “worst case, best
Scenario 1, which is the worst case scenario, assumes a long term persistence
of the deterioration in employment rates reached during the economic crisis. Scenario
2, which is the 1st best case scenario, assumes that European labour markets revert to
the employment growth rates prevailing before the crisis. Scenario 3, which is the 2nd
best case scenario, assumes a strong recovery, at least equivalent to the employment
growth of the best performers prior to the crisis. Finally, scenario 4, i.e. the most
likely scenario, disregards the crisis and considers the period 2004-2010 as
homogeneous.
The results from the forecasting models are presented in section 6. They reveal
that, overall, the deterministic forecasting methods estimate an increase between 2010
and 2020 by 3.79 percentage points, with significant variations across scenarios and
across individuals with different educational attainment levels. The only educational
group for which a positive increase is predicted by all three methods is the high
educated. In turn, the stochastic Monte Carlo simulations produce the range [-0.6;
+7.7] of plausible percentage point changes between 2010 and 2020.
Finally, section 7 concludes the analysis by combining all results,
demonstrating that they yield a reduction of the range of plausible values to [3.79;
7.7]. Within that statistically supported range, DG EAC ultimately made the political
decision to select a 5 percentage points increase as the target level for its proposed
I
NTRODUCTION
“Given the importance of enhancing employability through education and training in
order to meet current and future labour market challenges, the Commission is invited
to submit to the Council a proposal for a possible European benchmark in this area
by the end of 2010” (Council Conclusions of 12 May 2009 on “Education and
Training 2020”, 2009/C 119/06).
Following this request, the Directorate-General for Education and Culture (DG
EAC) commissioned to the Centre for Research on Lifelong Learning (CRELL) a
series of analyses of the contribution of Education and Training systems (E&T) to
employability.
The first CRELL report proposed an analytical framework and indicators to
measure E&T systems provision of essential skills, facilitation of the school-to-work
transition and support of lifelong learning (LLL), (Arjona Perez, Garrouste and
Kozovska, 2010a). Based on this study, the Member States Expert Group on
Employability Benchmarks concluded on March 3, 2010 that i) Vocational Education
and Training (VET) plays a key role in supplying skills that are valued in the labour
market; ii) the duration of the transition from education to work and the (mis)match
between education and occupation are both topics of policy interest; iii) participation
in LLL of older and low qualified workers and returns to education at a later age were
also two possible areas for educational benchmarks supporting employability. The
Expert Group requested an in-depth analysis of each of the above topics, with
information on data availability and a list of indicators from which a benchmark could
be chosen. The resulting work was compiled in a second CRELL report (Arjona
Perez, Garrouste and Kozovska, 2010b). CRELL prepared a preliminary statistical
report presenting different methods to conduct forecast estimations on transition phase
indicators which was presented to DG EAC, EUROSTAT, DG EMPL and CEDEFOP
at an inter-service consultation meeting on Septembre 13, 2010.
Based upon the comments from the Standing Group on Indicators and
Benchmarks (SGIB)1 and suggestions from EUROSTAT, DG EMPL and CEDEFOP,
1
DG EAC decided to focus the benchmark proposal on one sole indicator of transition
from education to employment that would target a percentage increase of the
employment rate of 20-34 years old graduates. The present report describes the
methodological framework applied to define the proposed benchmark. Section 1
briefly discusses the relevance of an indicator on the transition from education to
work as a proxy of the contribution of education to employability. In turn, section 2
presents in details the nominator and denominator of the retained benchmark indicator
and section 3 displays the corresponding 2004-2010 historical trend data computed by
EUROSTAT. Moreover, in section 4 we report results from preliminary robustness
checks, confirming the validity of that data to measure employability. Further, section
5 explains the method applied to define the target value at the horizon 2020. Results
from the three deterministic forecasting methods retained are presented in section 6
along side with the results from Monte Carlo simulations. Finally, section 7 concludes
with a benchmark proposal on education for employability.
The analysis presented in this report is based upon the September 14, 2011
1.
RELEVANCE OF THE CHOSEN BENCHMARK INDICATOR
2Employability has been defined as: “The combination of factors which enable
individuals to progress towards or get into employment, to stay in employment and to
progress during their career.” Each individual’s characteristics, skills, attitudes and
motivation are important. External factors (e.g. labour market conditions, business
cycle, the regulatory framework, overall economic situation etc.), which vary across
countries and regions and which change over time – and which lie beyond the scope
of education and training - influence a person's chances to get a job or to improve
their employment situation.
Education and Training – formal, non-formal and informal - is a key
determinant of a person's human capital, both initially and, through lifelong learning,
in its updating and improvement over the working life. Good education and training
should also stimulate motivation, build generic skills that are important for the
workplace and facilitate job search.
Chart 1 below illustrates the complexity of the concept and the many factors
that influence an individual's employability. The grey-shaded areas illustrate where
education and training plays a role, namely through the creation of human capital.
Education and Training (E&T) also influence ability and motivation. Moreover, E&T
systems facilitate the job search process by providing concrete guidance and
counselling and by making qualification systems more understandable to employers
across Europe.
2
Chart 1. Conceptual Framework towards a Benchmark on Education for Employability
(Source: CRELL, 2010a)
In the context of the wider societal goals of education and training systems, they
should provide the best possible support for the labour market success of citizens. A
“benchmark on education for employability" would therefore aim at promoting debate
on what education and training can do to boost employment success.
Education's support for employability can be seen in three distinct phases
(CEDEFOP, 2008):
¾ "preparation for employment" within the continuum of formal education from pre-primary to end of the compulsory phase and to tertiary level. Irrespective of
the level attained, all young people should have received a good degree of preparation
for their future entry and progression in the labour market.
¾ "transition from education to employment": this refers to the end of the "preparation for employment" phase. The transition from education should, for
example, include career guidance and counselling; all qualifications should be
¾ "stay in employment and progress in career": this refers to adult participation in training and education interspersed throughout their working lives. Education and
training systems should be open to and, indeed, reaching out to adult learners.
Of these three phases, there is already an extensive framework for monitoring two.
"Preparation for employment" is covered by 4 of the 5 benchmarks under the ET
2020, while "Stay in employment and progress in career" is covered by the fifth
benchmark on adult participation in lifelong learning. The phase "transition from
education to work" is not yet addressed. This is where a young person's employability
will depend most directly on the quality and relevance of what they have learned in
their formal education. Hence, it is proposed to focus the benchmark on that phase.
Two aspects of the transition are key: 1) does the young person succeed in
getting a first job and how quickly? and 2) is the quality of the first job commensurate
with the education qualifications the young person has attained? Both issues have
important long-term implications.
Success in getting a job and the duration of transition are potentially
life-changing moments. Young people who face unemployment or a slow transition may
experience long-term adverse effects on personal morale, future labour market
success, earnings and future family life if it delays or prevents departure from the
parental home or family formation. The quality of the first job is also important:
mismatches between qualifications attained in education and the skill level of the first
job have implications in terms of economic cost and returns to education, labour
productivity and the ability of a person to make labour market progress in the future.
The recent European Commission Communication "An Agenda for new skills and
jobs" underlines that “delivering the right mix of skills is important, but equally
important is avoiding the under-utilisation of people’s talents and potential".
The current economic crisis accentuates the importance of the transition. The
cost of seeing the group which are currently in transition from education to
employment suffer such long-term damage is too high. This is particularly true in
view of demographic ageing, which demands that Europe's increasingly scarce young
As illustrated in section 3, the challenges of integrating young people
increased during the recession. The share of active 20-34 year olds in employment has
deteriorated between 2008 and 2010. While for the high educated, the share in
employment has decreased by approximately 5 percentage points between 2008 and
2010 (from 87% to 83%) it has decreased by close to 4.5 percentage points for the
medium level educated (from 76.7% to 72.1%). Likewise, more than half of the 10
percentage points decrease suffered by the low educated since 2006 (from 62% in
2006 to 52% in 2010) occurred between 2008 and 2010 (cf. Figure 2, section 3).
Hence, the higher the level of educational attainment a young person has, the greater
her chance of a successful transition to employment.
Proposing a benchmark on the contribution of education and training to
employability in this current economic situation is particularly challenging as the
labour market outcomes of graduates are highly dependent upon the general
macro-economic conditions. Whether the macro-economic recovery will result in the creation of a
significant amount of new jobs or jobless growth will depend upon the exit strategies
and public policies and their success in reaching a balance between flexibility and
security on the labour market.
In addition, the forecasted demographic changes for the next 10-20 years will
change the composition of the labour force and consequently the labour market
opportunities for the different groups. The percentage of younger people (15-29) is
forecasted to fall from 28.2% in 2008 to 25.4% in 2020, while that of older people
(50-64) to increase from 28.1% to 32.0% (DG EMPL, 2010). The change in the
demographic situation and the ageing population calls for a much stronger emphasis
on the successful integration of young people in the labour market in order to achieve
effective and full use of all resources. As demonstrated by CEDEFOP’s (2010)
mid-term forecasts, these demographic changes are expected to have a direct impact on the
share of employment by level of qualifications. While the proportion of higher
educated among the employed population is forecasted to continue to increase by
2.1% between 2010 and 2020 to reach 34.4%, the proportion of medium educated is
expected to remain stable (+0.4%) at 50.6% and the one of lower educated to decrease
by 3% between 2010 and 2020 (to reach 15.1%). These results imply that by 2020, the
2010), the one for medium qualifications of 33.2% and the one for high qualifications
of 51.2%.
Any indicator/benchmark on education for employability should therefore
differentiate employment prospects according to educational attainment and should
reflect the objective of upgrading attainment levels. With regard to people with low
skills, whose employability has suffered the most in the recession and is likely to
further deteriorate in the labour market of the future, the primary aim for education
and training systems is to reduce the number falling into this category. Nevertheless,
they should leave education with good levels of attainment across all key
competences to facilitate success and later progress in the labour market.
Interventions from the E&T systems could be timely, aiming at introducing
new ways for facilitating a smoother transition from education (e.g. better career
counselling activities, closer contact with enterprises, etc.). At the same time,
reallocation of workers due to the economic crisis and the rate of creation of new jobs
depending upon the speed of recovery will strongly affect the employment rates of
graduates and consequently any indicator on the success of transition. Furthermore,
with regards to matching the labour market needs, reform of curricula could take
much more time and the impact could be observed with a much longer lag.
Hence, the proposed benchmark measures successful transition by focusing on
employment. Given existing data availability, it is not possible at this stage to monitor
the relationship between educational attainment level and the quality of the first job.
This will only be possible if there is a better matching of ISCED classifications for
educational qualifications with the ISCO job classification which could allow the
analysis of the quality of the first job and the development of a benchmark on the
"quality of transition" from education to early-stage employment. The measure
focuses therefore only on the quantity of employment (rather than its quality) right
2.
D
EFINITION OF THE CHOSEN BENCHMARK INDICATOR
In the definition of this brand new indicator, a number of choices have been made
with regards to the time period and the age bracket for evaluating the successful
transition from education to work. In the following, we offer some clarifications for
the choices made and define the nominator and denominator of the proposed
benchmark indicator.
As explained in section 1, an ideal measure of the transition from education to
employment would compute the speed of transition, controlling for a set of individual
and institutional explanatory factors. Unfortunately, the lack of longitudinal panel
data at the EU27 level obliged us to opt for an alternative measure that could be
computed using the annual cross-sectional European Union Labour Force Survey
(EU-LFS). The EU-LFS is a quarterly (annually aggregated), large sample survey
providing information about the education attainment and labour status of individuals
in private households in the EU, EFTA (except Liechtenstein), and the Candidate
Countries.3
Given the nature of the EU-LFS data, a number of data-driven choices had to
be made with regard to the definition of the school-to-work transition, starting with
the year of initiation of the transition period, and following with the age bracket of the
cohort under evaluation and the duration of the period of observation of that cohort.
First of all, the starting time of the transition period had to be proxied by the
year when a person receives his/her highest educational diploma/degree (variable
HATYEAR in the core annual EU-LFS). In order to avoid counting individuals
currently enrolled in further education or training activities, a control was added for
3
For the computation of this benchmark indicator, we can only use the annual sample. Conscripts in military or community service are not included in the results. The sampling rates vary between 0.14% and 1.68%. The figures in this report are not seasonally adjusted. The concepts and definitions used in the survey follow the guidelines of the International Labour Organisation. Further information is available at the Eurostat website:
non-enrolment in education or training activities in the four weeks preceding the
interview using both the variables COURATT and EDUCSTAT.4
Secondly, in terms of the definition of the age bracket for this indicator,
consistency with current development related to the EU2020 and ET2020 headline
targets has been taken into account. On the one hand, the lower bound of 20 years was
adopted in correspondence to the new age bracket of 20-64 years old introduced with
the employment rate headline target of the Europe 2020 strategy5. On the other hand,
the current ET2020 headline target on tertiary attainment is evaluated for 30-34 years
old. In order to include the tertiary education cohort, the targeted cohort has therefore
been defined as 20-34 years old.
The educational attainment levels are defined in accordance with the ISCED
classification6 and presented here in three aggregated levels:
¾ Low: below the second cycle of secondary education (ISCED levels 0-3c short);
¾ Medium: upper secondary and post-secondary non-tertiary education (ISCED levels 3-4 excluding 3c short);
¾ High: tertiary education (ISCED levels 5-6).
It is worthwhile mentioning that progress in EU statistics on outcomes of education
can offer some interesting further breakdowns by educational level and
characteristics. For instance, the implementation of ISCED 2011 in EU social surveys
should allow a division of educational attainment results by orientation
(general/vocational) at ISCED levels 3 and 4, as well as more details at tertiary level
4
In a paper co-authored in 2011 with Sylvain Jouhette and Sadiq Kwesi Boateng from EUROSTAT, we investigated the sensitivity of this indicator to a change in the variable measuring the starting time of the transition (HATYEAR). Details of that work are presented in section 3.1. Overall, we find that in 92.9% of the cases the information collected from the core annual LFS survey coincides with the information collected by a counterfactual variable (STOPDATE) from the ad-hoc LFS module on transition from education to employment. This means that our proxy variable HATYEAR generates a potential underestimating estimation of the actual school leaving year for less than 7% of the sampled population.
5
This change over the previous 15-64 years old age bracket was introduced to meet the objectives of raising educational levels and lowering school dropout rates and were justified by the fact that the employment rate for the categories 15-19 is very low as this is a group often still in education.
6
ISCED classification URL:
(B.A.-M.A. structures). Employment rates by educational levels could therefore be
presented with more breakdowns than the three main groups available as of today.
Moreover, the classification of fields of study is under review to allow an
implementation at the same time as ISCED 2011 in 2014. This classification is of
particular use for results on tertiary graduates, as already suggested in the 2009
publication on the Bologna process in higher education in Europe (EUROSTAT,
2009)7.
Based on each of the above dimensions, the nominator and denominator of our
benchmark indicator were formulated as follows.
Numerator:
The numerator counts the number of individuals aged 20-34 not in education nor in
training in the four weeks preceding the time of the interview8 and who are employed.
We collect that information for those who graduated at their highest level 1 year
before the interview, 2 years before the interview or 3 years before the interview. The
numerator is thus the average number of employed young individuals over these 3
graduation time-lags. It measures the average stock of youth employed in the 3 years
following graduation, excluding the very first months to avoid any underestimation
biases potentially caused by the nature of the data or the nature of the first
professional experience.
To better understand the motivation for choosing this 1 to 3 years after
graduation time frame, Figure 1 presents the employment rate of the 20-34 years old
7
Bologna process in higher education in Europe: Key indicators on the social dimension and mobility Report.(http://www.ond.vlaanderen.be/hogeronderwijs/bologna/conference/documents/2009_Eurostat_ Eurostudent_social_dimension_and_mobility_indicators.pdf). Some interesting indicators have already been indeed proposed based on occupation and the current classification of fields of education and training (see chapter D) for educational attainment. These are for example the distribution of persons with tertiary education by field of study for a given labour status and occupation or the distribution of employees with tertiary education by occupation for a given field of study.
http://epp.eurostat.ec.europa.eu/portal/page/portal/education/bologna_process
8
by number of years since completion of their highest educational attainment among
those not currently enrolled in any further education or training. It reveals the
existence of an “insertion year” immediately after leaving education during which
more than one third of the youth is not employed. This result can be both data-driven
and institutionally driven.
Indeed, the EU-LFS core survey asks the respondents about the year of highest
graduation and the year of first significant job. Hence, if a respondent graduated in
December 2007 and got first employed in January 2008, he will be registered as
employed 1 year after graduation. Moreover, in some countries, it is common for
graduates to enrol in unpaid traineeship directly after graduation, which can neither be
reported as part of their education and training (unless included formally in the
prerequisites for the gaining of a diploma) nor as a first employment contract (because
of their non-remunerated nature). These limitations can, therefore, produce an
underestimation bias of the actual number of young people employed “less than one
year after completion of highest education”.
Then, when looking at the employment rates of the 20-34 years old at least 1
year after graduation, we observe a progressive increase up to 4 years after graduation
and a significant drop beyond 4 years. Overall, what Figure 1 reveals is that the
largest number of 20-34 years old is employed within a time lag of 1 year to 4 years
Figure 1. Employment rate of the 20-34 years old not currently enrolled in further education or training, by number of years since completion of the highest educational attainment (EU27 average), 2009
(Source: Boateng, Garrouste and Jouhette, 2011. Authors’ computations based upon the core annual EU-LFS, 2009)
While it is tempting to misread this figure as a representation of the employment
spells of one specific 20-34 year-old cohort, it should be kept in mind that the first
vertical bar actually illustrates the share of employed individuals aged 20-34 years old
in 2009 that graduated within one year of time, the second bar the number of
employed individuals aged 20-34 years old in 2009 that graduated 1 year before, the
third bar the number of employed individuals aged 20-34 years old in 2009 that
graduated 2 years before, etc. Hence, we are observing individuals that entered the
labour market in different years and may have been affected by different structural
and conjectural settings. Among these individuals, some may have been in
employment ever since the day of their graduation, without interruption, while others
may have suffered multiple unemployment spells. Within the same country, 20-34
years old that reached their highest educational attainment level the longest time ago
may have graduated from an E&T system that did not provide the same curricular
options as the one from which their 20-34 year-old peers graduated more recently.
Despite the obvious weakness of such stock measure, the information
illustrated in Figure 1 is to some extent confirmed by empirical research based upon
graduates take 24 months to find their first permanent job, with important variations
across countries and educational attainment levels, ranging from 13.2 to 34.6 months
(Quintini, 2007). Moreover, it has been demonstrated that a transition from education
to first job associated with a long period of unemployment can have significant
implications for future labour market outcomes. It can adversely affect future earnings
and work experience (e.g., Arulampalam et al., 2000). The ‘scarring’ theory of
unemployment suggests that possible reasons are depreciation of human capital
through atrophy (i.e. not using skills leads to losing them), or the fact that employers
tend to use an individual’s previous labour market experience as a screening
mechanism. A way of assessing whether E&T systems have the capacity to support a
“successful” transition to the labour market may therefore be by measuring whether
their graduates manage to avoid falling into a long-term unemployment trap within 3
years after leaving their E&T institution.
For all the reasons listed above, the share of employed 20-34 years old was
finally collected only for those who graduated at least 1 year before the interview and
at most 3 years before the interview9.
Denominator:
The denominator counts the total number of 20-34 years old not currently attending
any education or training (either active10 or inactive11 on the labour market). Hence, in
addition to the age bracket and observation period constraints included at the
numerator, the presence of a filter on current education status at both the numerator
and denominator contribute to differentiating significantly our measure of young
graduates’ employment from the EU2020 employment rate indicator12.
9
This stock measure of employment has the advantage of ascertaining sufficient sample sizes at country level, which is a prerequisite for an EU27 benchmark indicator.
10
Active population: The economically active population includes those who are employed, and those who are unemployed.
11
Inactive persons are those who neither classified as employed nor as unemployed.
12
3. 2004-2010
HISTORICAL TRENDS
The trend series of the generated indicator on education for employability are
presented in Figure 213. They reveal that the employability of the low educated
(ISCED 0-2) has been at least 20 percentage points lower than the one of high
educated (ISCED 5-6) youth over the period 2004-2010. It is interesting from that
figure to see that this gap increased to 30 percentage points difference during the
crisis (see 2008-2010 values).
50
60
70
80
90
Emp
_
R
a
te
2004 2006 2008 2010
YEAR
Total ISCED 0-2
ISCED 3-4 ISCED 5-6
Source: CRELL computations based on Eurostat, EU LFS by educational attainment
[image:24.612.112.492.298.582.2]Employability of 20-34 years old 1-3 years after graduation
Figure 2. Percentage of 20-34 year-olds employed during the 3 years following their highest graduation, by level of educational attainment
Note: Lower than Upper Secondary Education corresponds to ISCED levels 0-2 (including 3c short); Upper Secondary and Post-secondary Non-tertiary Education to ISCED levels 3-4; and Tertiary Education to ISCED levels 5-6.
13
Still, as revealed by Figure 3 (for 2010 data) and Annex Table A.1 (for trend data
2004-2010), there is a strong variation in country-specific performances. For instance,
while the HU, MT and the UK had the best medium educated performers in 2004,
after the crisis, UK dropped to the 8th position, HU to the 16th position and MT to the
27th position, replaced by NL, AT and LU 2010. Similarly, while the UK, HU and MT
had the best high educated performers in 2004, by 2010 the UK had fallen to the 9th
position and HU to the 17th , at the profit of the NL and LU (2010 ranking: MT, the
[image:25.612.112.502.264.533.2]NL, LU).
Figure 3. Employability rate by educational attainment level and by country, 2009
Notes: Below upper secondary education corresponds to ISCED levels 0-2 (including 3c short); Upper secondary and post-secondary non-tertiary education to ISCED levels 3-4; and Tertiary education to ISCED levels 5-6. Data for EE, MT and SI suffer lack of reliability across levels of educational attainment. Data for GR and SE suffer lack of reliability due to small sample sizes at the lower education level.
Moreover, Table A.1 in Annex highlights some data issues. When looking specifically
trend series for almost all countries14. The lack of data for the low educated sample
can easily be explained by the nature of the benchmark indicator, which combines
strict selection filters based on the age bracket (20-34 years old) and on the
observation time frame (1-3 years after graduation). With such a restricted frame, the
education for employability benchmark assumes that the observed cohort graduated
earliest at the age of 17 (i.e. 2 years after the average age of end of compulsory
education in Europe)15. Hence, those who have actually exited the E&T system at the
end of the compulsory education period with only an ISCED 0-2 degree are excluded
from this measure. The ISCED 0-2 graduates that continued their education at least
until the age of 17 without graduating at a higher level are also excluded. At the end,
the only ISCED 0-2 graduates that are captured by this benchmark indicator are the
ones that graduated from lower secondary education at least at the age of 17. Not
surprisingly, this number is very low, even null, in most countries.
Because the lack of observations for the low educated constitutes an important
reliability issue, the choice has been made to not communicate further results for the
lower educated sample. In the reminder of the report, ISCED 0-2 graduates are only
included in the aggregated computations labelled “all educational attainment levels”
or “full sample” but not in the computations disaggregated by educational attainment
level16.
After excluding the low educated sample, we still find a number of countries
with persistent missing or inconsistent data (e.g., EE, HU and RO) and few occasional
unreliability (e.g., DE’s medium education value in 2005; MT’s medium education
values in 2006 and 2010). The presence of these missing values may be explained by
the fact that we are using the annual sample of the LFS survey, which is restricted to
14
The lack of data for the low educated sample can easily be explained by the combination of the age bracket (20-34 years old) and the observation time frame (1-3 years after graduation) chosen for the benchmark indicator, which assume that the observed cohort graduated earliest at the age of 17. Hence, those who have actually exited the E&T system after completion of an ISCED 0-2 degree are excluded from this measure. The indicator only counts the ISCED 0-2 graduates that continued their education at least until the age of 17 without graduating at a higher level.
15
See Garrouste (2010) for details on European reforms about compulsory education.
16
few waves in some countries because the variable HATYEAR17 (year of graduation) is
not available on a quarterly basis.
Further, Table A.2 in Annex presents the gender gap in country performances
between 2004 and 201018. It reveals the presence of a persistent gap in favour of men
at the level of the EU27 average across the whole observation period (2004-2010).
Nevertheless, we observe significant cross-country variations. In 2004, the country
with the strongest gender gap in favour of men was EE (ratio Males/Females 1.43)
and the country with the strongest gender-gap in favour of women (ratio
Males/Females = 0.92) was RO. In 2010, the country with the strongest gender-gap in
favour of men was still EE (ratio Males/Females = 1.22) but the country with the
strongest gender-gap in favour of women was now LT (ratio Males/Females = 0.90).
While in 2004, the most egalitarian countries were LT, SE and DE (ratio
Males/Females = 1), by 2010, they got replaced by SK, HU and BE.
When disaggregating by educational attainment level, we see that SI and RO
were in 2004 the most unequal countries in terms of employability of the young
graduates at a medium educational level, respectively favouring men and women. By
2010, SI is still the most discriminative country against women but RO has been
replaced by BG as the most discriminative country against men. The only country
where young men and women were given equal opportunities was the NL in 2004,
replaced by LT in 2010.
Finally, with regard to the young graduates from tertiary education, the most
unequal countries in favour of men or women were in 2004, respectively, LV and LT.
The most egalitarian ones were DK and BG. Comparatively, in 2010, the most
unequal countries were EE (in favour of men) and IE (in favour of women) and the
most egalitarian ones were PT and BE.
This evidence of the existence of a gender gap within EU MS (either in favour
of men or women) may constitute an important source of information for countries
adopting an active gender equity policy.
17
4. P
RELIMINARY
R
OBUSTNESS
A
NALYSIS
19This section presents some results from preliminary robustness checks testing (i) the
sensitivity of the proposed employability benchmark to a change in the data source for
the definition of the actual date of graduation and (ii) correlations between the
employability benchmark estimates and some counterfactuals.
4.1
Sensitivity to a change in data source
As already mentioned in Section 2, some tests were conducted with EUROSTAT to
estimate the sensitivity of the employability benchmark indicator to a change in the
definition of the starting time of the transition period between education and
employment according to the data source (Boeteng et al., 2011). We exploited the
added variables of the EU-LFS Ad hoc module of 2009 to generate an indicator
against which the benchmark results could be compared.
That joint paper (ibid.) shows the first preliminary results for countries with
changes in employment rates in relation to the benchmark. It is important to note that
the validation process of the LFS ad hoc module 2009 is still ongoing and country
specific cases will be investigated taking into account educational patterns, educations
levels, rates of early leavers and sample sizes. This is especially important in
countries with significant differences in relation to the proposed benchmark.
Since 2000, a specific thematic module is attached each year to the EU-LFS.
In 2000 and 2009, 11 additional variables on the transition of young people from
school to work were proposed. Among the 11 additional variables provided by the ad
hoc module, the one of interest for this exercise was the STOPDAT variable, which
we used as a counterfactual for the variable HATYEAR from the Core LFS. On the one
18
It is worth stressing the presence of missing and unreliable values in EE across levels, in SI at the medium and high education levels, in CY and IE only at the medium educated level and in LT and LU only at the high educated level.
19
hand, the variable HATYEAR refers to the year when the highest diploma was
obtained, in other words the year of graduation. It is a standard way of collecting
information on educational attainment in the Core LFS. On the other hand, the
variable STOPDAT collected in the ad hoc module of 2009 refers to the year of
leaving formal education for the last time. Although much more accurate, this
question is more difficult to collect and can therefore not be included in the regular
LFS.
We find that in 92.9% of cases, the information provided by the respondents to
both questions coincide, which means that our proxy variable HATYEAR generates a
potential biased estimate of the school leaving year for about only 7% of the sampled
population. The analysis also reveals that the HATYEAR variable tends to
underestimate the actual employed population (compared to the STOPDAT variable)
by at least 1.4 percentage points with significant variations across countries.
While using the variable HATYEAR instead of STOPDAT underestimates by
more than 10 percentage points the employment rate in Slovakia (under revision) and
up to 5 percentage points in Belgium, Estonia and France, it overestimates it in the
case of Latvia, Spain, Malta and Finland by up to 5.4 percentage points. Interestingly,
the least sensitive countries to a change in data source are Czech Republic, Germany,
Spain and the Netherlands, with less than 1 percentage point difference. For all other
countries, the underestimation ranges between 1.0 and 5.4 percentage points, with the
Netherlands, the Czech Republic and Bulgaria at the bottom and Romania, France and
Belgium at the top of variation.
4.2
Correlation with counterfactual benchmark indicators
The main objective of this exercise is to verify whether the correlation between our
estimated benchmark indicator with relevant existing counterfactual indicators has the
sign we theoretically would assume. Hence, overall, this section aims at providing
some evidence of the relevance of our proposed benchmark indicator on education for
Because the employment rate of the 20-34 year-olds measured by our
employability benchmark constitutes a sub-sample of the employment rate of the total
population at a working age, the first counterfactual benchmark indicator against
which we correlate our proposed benchmark is the EU 2020 employment rate
(measured on the population aged 20-64). Figure 4 confirms the existence of a strong
correlation (close to 88%) between the two indicators, validating our assumption of a
potential anchoring of the employability indicator to the employment rate benchmark.
While up to 37% of the variation in young graduates’ employability across countries
is explained by the overall labour market’s situation, 63% is explained by other
factors, including the ability of E&T systems to provide for the demanded skills.
Employability Rate1 vs. Employment Rate Benchmark2
(Sources: 1. JRC Computations based on Eurostat EU-LFS 2009; 2. Eurostat 2009)
y = 0.8764x + 15.65 R2
= 0.3671
40.00 50.00 60.00 70.00 80.00 90.00 100.00
40.00 50.00 60.00 70.00 80.00 90.00 100.00 Employment Rate Benchmark
Em
plo
y
a
b
ilit
y
Ra
te EU27
EE IT
GR
NL
HU
[image:30.612.111.502.303.568.2]Employment Rate Benchmark target
Figure 4. Employability Rate vs. Employment Rate, 2009
The second counterfactual against which we compare our employability benchmark is
the GDP per capita in PPS. We expect a strong positive correlation between high
GDP per capita and high youth employability levels, assuming that the employability
of young people is driven by the economic wealth of a country. Figure 5 confirms the
the presence of outliers such as GR and IT who are performing surprisingly low in
terms of youth employability given their relatively high GDP per capita rate (close to
the EU27 average) and RO who is performing relatively high in terms of youth
employability (above the EU27 average) given its low level of GDP per capita rate. In
the case of GR and IT, this result shall be interpreted as a sign that young people are
not beneficiating as much as they could from the growth of their respective economy.
Employability of the 20-34 years old1 vs. GDP per capita in PPS (EU27=100)2
(Sources: 1. CRELL Computations based on Eurostat EU-LFS 2009; 2. Eurostat 2009)
50 55 60 65 70 75 80 85 90 95
0 20 40 60 80 100 120 140 160 180 200 GDP per Capita in PPS
Yo uth Emp loy a b ility (%) GR IT EU27 NL CZ DK ES LV BG RO PL HU PT CY FI FR IE BE SE DE AT LT
Higher GDP per capita than EU27 average Higher Youth Employability than EU27
Lower GDP per capita than EU27 average Lower Youth Employability than EU27 Lower GDP per capita than EU27 average Higher Youth Employability than EU27
Higher GDP per capita than EU27 average Lower Youth Employability than EU27 SK
SI
[image:31.612.111.502.221.493.2]UK
Figure 5. Employability Rate vs. GDP per capita in PPS, 2009
A different way of looking at the role played by the wealth of a country on the
chances of young people to find a job soon after graduation is to look at the rate of
people excluded (or at risk of being excluded) from the returns to economic growth.
We assume that in countries where there is a large share of poverty and exclusion
from the labour market, there should also be a lower rate of employability among the
young cohort. Figure 6 plots the young graduates’ employability against the EU2020
benchmark on population at-risk-of-poverty or exclusion and finds a significant
Employability1 vs. Population at-risk-of-poverty or exclusion Benchmark2 (2009)
(Sources: 1. CRELL computations based on Eurostat, EU-LFS 2009; 2. Eurostat, 2009)
y = -0.3829x + 87.096 R2 = 0.2916
50.00 55.00 60.00 65.00 70.00 75.00 80.00 85.00 90.00 95.00
0.00 5.00 10.00 15.00 20.00 25.00 30.00 35.00 40.00 45.00 50.00 Population at-risk-of-poverty Benchmark
Em
pl
oyabili
ty Benchm
ark
EU27
GR NL
SI
ES
[image:32.612.110.502.90.360.2]RO
Figure 6. Employability Rate vs. Population at-risk-of-poverty or Exclusion Benchmark, 2009
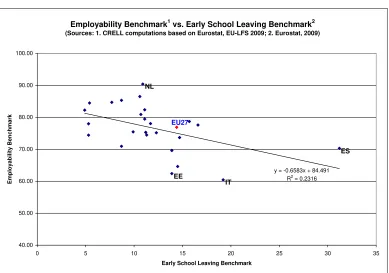
The fourth counterfactual we explore is the EU2020 early school leaving benchmark
indicator, which is used as a proxy of the capacity of E&T systems to retain their
pupils until completion of compulsory education. We expect a strong negative
correlation between this indicator and young graduates’ employability, assuming that
countries with high young graduates’ employability rates are countries where a degree
is valued by the labour market and, therefore, might also be countries preventing more
efficiently early school leaving. Figure 7 confirms this assumption (r = -.66) and
reveals that the share of early school leavers explains up to 23% of the variations in
young graduates’ employability across countries20.
20
Employability Benchmark1 vs. Early School Leaving Benchmark2
(Sources: 1. CRELL computations based on Eurostat, EU-LFS 2009; 2. Eurostat, 2009)
y = -0.6583x + 84.491 R2 = 0.2316
40.00 50.00 60.00 70.00 80.00 90.00 100.00
0 5 10 15 20 25 30 35
Early School Leaving Benchmark
Em
ploy
a
b
ilit
y
B
e
n
c
hm
a
rk
EU27
NL
EE
IT
[image:33.612.113.502.152.425.2]ES
Figure 7. Employability Rate vs. Early School Leaving Indicator, 2009
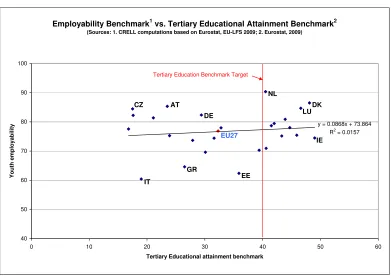
Finally, we checked whether countries producing a higher share of tertiary graduates
also perform better in terms of youth employability. Against all expectations, Figure 8
reveals no correlation between the two indicators (r = .09). This result is very
important for our analysis as it demonstrates that higher youth employability can not
be achieved simply by increasing the number of tertiary graduates. In other words, the
employability benchmark can not be substituted by the tertiary educational attainment
benchmark. Rather, increasing the young graduates’ employability requires the
provision by the E&T systems of all skills and competencies requested by the labour
market. Such provision can and shall be ensured at all levels of educational
attainment. For instance, some countries, such as the CZ, DE and AT, reach a high
youth employability without producing a high share of tertiary educated pupils. Their
high employability rate is indeed more due to the capacity of their E&T systems to
Employability Benchmark1 vs. Tertiary Educational Attainment Benchmark2
(Sources: 1. CRELL computations based on Eurostat, EU-LFS 2009; 2. Eurostat, 2009)
y = 0.0868x + 73.864 R2
= 0.0157
40 50 60 70 80 90 100
0 10 20 30 40 50 60
Tertiary Educational attainment benchmark
Youth
em
ployabi
lity
EU27
IT EE
NL CZ AT
GR
DK
IE LU DE
[image:34.612.111.502.91.369.2]Tertiary Education Benchmark Target
Figure 8. Employability Rate vs. Tertiary Educational Attainment Benchmark, 2009
Hence, it appears clearly from the above analysis that the employability of young
graduates can partly be explained by the overall labour market situation, by the
economic wealth (measured as GDP per capita in PPS and as the share of population
at-risk-of-poverty or exclusion) and by the capacity of E&T systems to retain learners
until the completion of compulsory education. Still, it is not at all explained by the
EU2020 benchmark on tertiary educational attainment.
Overall, the proposed benchmark on Education for Employability comes out
as a clear complement to all existing EU2020 and ET2020 benchmark indicators on
5.
TOWARDS A BENCHMARK TARGET: FORECASTING METHODS AT THE
HORIZON 2020This section presents the forecasting techniques adopted to define the target level of
the proposed benchmark indicator on education for employability at the horizon 2020.
5.1
Deterministic forecast methods
The physicist Nils Bohr once said, “Prediction is difficult, especially when it’s about
the future”. And George E. P. Box is reported to have maintained that “All models are
wrong, but some are useful” (Box and Draper, 1987). Michael Clements and Sir
David Hendry (2001) suggest some reasons why conditional models, misspecified in
unknown ways, yield model error. They maintain that a model is an attempt to extract
regularities while excluding irregularities from nature. Although modelling and
forecasting require covariance stationarity, we live in a non-stationary and changing
world. Our modelling theory, from which we derive our forecasts, must allow for
intermittent structural breaks (ibid.). The data generating mechanism, from which our
time series realization stems, can change over time. Furthermore, some data
generating processes change more rapidly than others. Shifts in deterministic factors
can cause shifts in equilibrium means over time.
Types of deterministic forecasts:
There are several classifications of forecasts: ex-post forecasts, ex-ante forecasts,
one-step-ahead forecasts, static forecasts, dynamic forecasts and rolling origin forecasts
(Yaffee, 2010). In this analysis we use a linear ex-ante forecast technique, which
consists in forecasting beyond the end of the sample data at a particular time. The
point of forecast origin in this type of forecast begins where the actual data cease to
exist. Unless we have some conventional “gold standard” of forecast accuracy against
which to compare these forecasts, we have no baseline for comparison at the time of
compare our forecasted estimates. Makridakis, Wheelwright and McGee (1983) refer
to two kinds of naïve forecasts. The first kind is the one in which a random walk is
extended from the value of the variable being forecasted, whereas the second kind is a
deseasonalized extension of the variable being forecasted as a basis for comparison.
In this work, we define our comparative naïve forecast in the later way, namely as a
deseasonalized extension of the employability rate. According to the scenario tested
(see Box 2), the forecast horizon will begin at a different point of forecast origin
(Pindyck and Rubinfeld, 1997).
Furthermore, we assume that the previous forecast is actual data upon which
the one-step ahead forecast is based (i.e. “one-step-ahead forecast” technique, applied
with the Kalman filter). Because this forecast builds upon previous optimal estimates,
it can generally be more accurate than a multi-step dynamic forecast21 (Yaffee, 2010).
Moreover, we explore the potentials of forecasted growth rates as a
constructive alternative to trend forecasting. The compound annual growth rate
(CAGR) is calculated by taking the n-th root of the total percentage growth rate,
where n is the number of years in the period being considered. It is useful when
determining an annual growth rate on an indicator whose value has fluctuated
significantly from one period to the next as it reduces the effect of volatility which
can make arithmetic means irrelevant (see Box 1 for details).
Finally, because predictability is necessary but not sufficient for forecastability
(Hendry, 1995), it is important to account for the hidden or unanticipated correlations
with excluded or unknown variables and for unanticipated changes in variables over
the forecast horizon. On the one hand, unconditional forecasts (ARIMA model) are
often based on a single series and are not conditional on exogenous time series. On
the other hand, conditional forecasts have a time series regression framework in the
sense that an endogenous variable may be influenced by proximate, indirect, or direct
effects associated with it. For instance, the employment rate of the newly graduated
aged 20-34 years old depends upon the distribution of the employment rate of the
entire adult population. Indeed, we base our assumption of a strong anchorage of our
21
employability benchmark to the overall employment rate positive correlation rate (i.e.
a strong positive correlation) on the evidence provided by Figure 4 in section 4.
Conditional forecasts entail the preliminary prediction of all exogenous or
weakly exogenous variables over the forecast horizon before the forecast of the
endogenous variable can be generated. In that effort, we use CEDEFOP’s (2010)
mid-term forecasts of the employment rate as our baseline (see Chart A.1 in Annex).
Consequently, we end up comparing results from three different deterministic
forecasting techniques namely, unconditional linear trend analysis, compound annual
growth rate (CAGR) and conditional (linear and exponential)22 trend analysis (Box 1).
Exploring these three methods enables us to test for the sensitivity of our forecasted
values to a change in forecasting method.
Each of these deterministic forecast methods has been computed on four broad
scenarios. These scenarios were defined to generate a range of forecast estimates
largely inspired by the work of DG EMPL on the Employment rate targets for 2020
(DG EMPL, 2010), applying the logic of “worst case, best case and most likely”. Box
2 presents these scenarios in detail.
Scenario 3, which is the second most optimistic scenario, is computed simply
by imposing a common target value at the horizon 2020 to all MS at least equal to the
average value of the highest level reached by the 3 best performing MS before the
beginning of the crisis (i.e. during the period 2004-2007). While the estimations based
on this scenario are not conditioned by the forecasting method, for the other three
scenarios (namely, scenario 1, scenario 2 and scenario 4), the estimation method
conditions the benchmark target at the horizon 2020.
Comparing these scenarios provides us with additional information on the
sensitivity of our estimates to a change of hypothesis on the shape of future trends.
22
BOX 1. DETERMINISTIC FORECASTING METHODS
Method 1: Unconditional Trend Analysis
The unconditional trend model is defined as:
)
( t
t g Time
T = , where Timet is the time index.
The most common trend models are linear trend, exponential trend, quadratic trend and trends with changing slope. In this application we consider only the linear trend.
Method 2: Compound annual growth rate (CAGR)
The compound annual growth rate is calculated by taking the n-th root of the total percentage growth rate, where n is the number of years in the period being considered. It is useful when determining an annual growth rate on an indicator whose value has fluctuated significantly from one period to the next as it reduces the effect of volatility which can make arithmetic means* irrelevant. The formula for calculating the CAGR is:
1 ) ( ) ( ) , CAGR 0 1 0
0 ⎟⎟ −
⎠ ⎞ ⎜⎜ ⎝ ⎛
= n t−t n n t V t V t (t
where V(t0) is the start value, V(tn) is the finish value, tn - t0 is the number of years.
Method 3: Conditional Trend Analysis
The conditional trend model is defined as:
) ' , ' , '
(knownY s knownX s newX s f
Yt =
where t = 0,…,T and Yt is the employability rate in year t, measured as a function of the slope of the
interaction between the historical trend line (defined as linear or exponential) of Y and the historical and predicted trend line of an explanatory variable X (i.e. the employment rate of the total adult population).
* The arithmetic mean or average annual growth rate (AAGR) is the sum of annual changes (compared with the previous year) divided by the number of years:
AAGR 1 1( 1 ... )
1
n n
i
i x x
n x n
x= = + +
=
∑
=
.
5.2
Stochastic forecasting: Monte Carlo Simulation
Although broadly applied by many organizations, deterministic forecast approaches
suffer from major limitations. First of all, they consider only a few discrete outcomes,
ignoring hundreds or thousands of others. Moreover, they ignore interdependence
between inputs, impact of different inputs relative to the outcome and other nuances,
which oversimplifies the models and reduces their accuracy.
A better way to perform forecasting analysis is by using Monte Carlo
simulations. In Monte Carlo simulations, uncertain inputs in a model are represented
using ranges of possible values known as probability distributions. By using
probability distributions, variables can have different probabilities of different
outcomes occurring, which is a more realistic way of describing uncertainty in
variables. While probabilities can take almost any distribution shape (ranging from
Normal to Discrete), in this specific work we assume a Uniform distribution, i.e. all BOX 2. FORECAST SCENARIOS
¾ Scenario 1– Worst case scenario: this scenario assumes a long-term persistence of the deterioration in employment rates reached during the economic crisis will remain constant; the estimated benchmark level is defined projecting the growth rate between 2008 and 2010;
¾ Scenario 2 – 1st best case scenario: this scenario assumes that EU labour markets revert to the employment rates prior to the crisis; the estimated benchmark level is defined projecting the growth rate between 2004 and 2007;
¾ Scenario 3 – 2nd best case scenario: this scenario assumes a strong recovery process which exceeds the average performance preceding the crisis; the benchmark level is defined as the average growth rate of the three best performers during the period 2004-2007.
values (from any scenario) have an equal chance of occurring, and we simply define
the minimum and maximum values based upon our estimates from the scenario-based
deterministic forecasts.
During a Monte Carlo simulation, values are sampled at random from the
input probability distributions. Each set of samples is called an iteration, and the
resulting outcome from that sample is recorded. Monte Carlo simulation does this
hundreds or thousands of times, and the result is a probability distribution of possible
outcomes. In this way, Monte Carlo simulation provides a much more comprehensive
view of what may happen. It tells us not only what could happen, but how likely it is
to happen. Finally, the Monte Carlo simulation allows us to relax the hypothesis of
equal weight to all scenarios which is implied by the deterministic modelling, by
estimating the probability of different scenarios to occur (Vose, 2008)23.
In an effort to estimate a ‘realistic’ benchmark target, we therefore also apply
Monte Carlo simulations to test whether the simulated mean and range of plausible
values (under different randomization hypotheses) are similar to the ones estimated by
our three deterministic methods. Results are presented in section 6.2.
As a consequence, our methodological forecasting framework tests the
sensitivity of the 2020 projections to a change in the estimation method and a change
in the predictive scenario.
23