BIROn - Birkbeck Institutional Research Online
Baughman, F. and Thomas, Michael S.C. and Anderson, M. and Reid, C.
(2016) Common mechanisms in intelligence and development: a study of
ability profiles in mental age-matched primary school children. Intelligence
56 , pp. 99-107. ISSN 0160-2896.
Downloaded from:
Usage Guidelines:
Please refer to usage guidelines at
or alternatively
Common mechanisms in intelligence and development: A study of ability pro
fi
les in
mental age-matched primary school children
☆
Frank D. Baughman
a,⁎
, Michael S.C. Thomas
b, Mike Anderson
c, &, Corinne Reid
ca
Curtin Neuroscience Laboratory, School of Psychology and Speech Pathology, Curtin University, Perth, Western Australia, Australia
bDevelopmental Neurocognition Laboratory, Centre for Brain and Cognitive Development, Department of Psychological Sciences, Birkbeck, University of London, London, United Kingdom c
School of Psychology and Exercise Science, Murdoch University, Perth, Western Australia, Australia
a b s t r a c t
a r t i c l e i n f o
Article history:
Received 15 September 2015
Received in revised form 17 January 2016 Accepted 31 January 2016
Available online xxxx
Background and aims:We examine the relationship between individual differences and cognitive development in order to address the question of whether variability in each might be due to common mechanisms. In two experiments, we compare the cognitive profiles of groups of younger and older children matched on overall mental age (MA) using standard tests of intelligence (British Abilities Scales-II; BAS-II, and Wechsler Intelligence Scale for Children, 3rd edition; WISC-III).
Results:In both experiments, MANOVAs revealed few differences in the profiles of younger and older MA-matched children. In Experiment 1, no reliable differences were found on the six BAS-II core scales, and only one group difference was found on the supplementary, Speed of Processing diagnostic test, where the older children outperformed the younger children. In Experiment 2, analyses of the 10 core scales of the WISC-III revealed two group differences. These were on Coding, where the younger children's performance was superior to the older children, and on Arithmetic, where the older children outperformed the younger children.
Conclusions:The degree of similarity between cognitive profiles of younger and older MA-matched groups sug-gests that a common mechanism may indeed underlie variability in individual differences and development. Thefindings further suggest that children of different ages, who are of the same overall ability level, are at the same developmental and intellectual level. However, further research is needed to determine just how similar ability-matched children remain over the course of development.
© 2016 The Authors. Published by Elsevier Inc. This is an open access article under the CC BY-NC-ND license (http://creativecommons.org/licenses/by-nc-nd/4.0/). Keywords:
Intelligence Cognitive development Mental age
Abilities
1. Introduction
Is being more intelligent like having more development? Or, are the two things different? If one took a group of children, varying in chrono-logical ages but matched on overall mental age, would they be found to be equivalent in their thinking? Or, would, for example, the younger children show advantages over the older children on some tests, and the older children show advantages over the younger children on other tests of abilities? These questions have relevance both at practical (e.g., educational) and theoretical levels. However, in part because they have been studied separately, intelligence and cognitive development have been conceptualized as separate forms of cognitive variability,
with separate causal accounts of their underlying mechanisms. Within intelligence research, the emphasis has long been on quantifying the abilities of large numbers of individuals of the same age (here, the term psychometrics is often used). The focus of this approach is primar-ily on measuringwithin-ageindividual variability. By contrast, thefield of cognitive development has focused on attempting to understand the processes underlying age-related changes in ability. That is, the cen-tral interest within this approach is explaining how variability emerges
between-agesfor the average child.
While descriptions of various candidate mechanisms have been offered at both the brain level (see e.g.,Andreasen et al., 1993; Deary & Caryl, 1997; Geake & Hansen, 2005; Haier, Jung, Yeo, Head, & Alkire, 2004; Mabbott, Noseworthy, Bouffet, Laughlin, & Rockel, 2006; Posthuma et al., 2002; Szameitat, Schubert, Muller, & von Cramon, 2002) and the genetic level (see e.g.,Plomin, DeFries, & McClearn, 2008; Posthuma & de Geus, 2006), it is the convergence of these descriptions at thecognitive levelthat motivates the current study. Addi-tionally, given the divergence in paths taken to the study of intelligence and development, it is noteworthy that within their separate literatures, theoretical accounts bear several similarities with regard to the
Intelligence xxx (2016) xxx–xxx
☆ This research was partially funded by ESRC grant RES-062-23-2721, and a joint grant from the Wellcome Trust and the Education Endowment Foundation awarded to the University of London Centre for Educational Neuroscience.
⁎ Corresponding author at: Curtin Neuroscience Laboratory, School of Psychology and Speech Pathology, Curtin University, GPO Box U1987, Perth, Western Australia 6845, Australia.
E-mail address:[email protected](F.D. Baughman).
http://dx.doi.org/10.1016/j.intell.2016.01.010
0160-2896/© 2016 The Authors. Published by Elsevier Inc. This is an open access article under the CC BY-NC-ND license (http://creativecommons.org/licenses/by-nc-nd/4.0/).
Contents lists available atScienceDirect
mechanisms held to underlie variability. For example, at the cognitive level, within the literature on intelligence, one canfind causal accounts for single mechanisms such asspeed of processing(e.g.Anderson, 1992, 1998, Burns, Nettelbeck, & Cooper, 1999, Jensen, 1993, Nettelbeck, 1987, Wright et al., 2001),inhibition(e.g.,Dempster, 1991),capacity(see e.g.,Ackerman, Beier, & Boyle, 2005; Jensen, 1998) andcomplexity
(Halford, 1999). Similarly, within the literature on cognitive develop-ment, one can alsofind descriptions ofspeed of processing(e.g.Hale, 1990, Kail, 1996, Nettelbeck, 1987, Wellman & Gelman, 1992),inhibition
(Houdé, 2000),capacity(e.g.,Jensen, 1998) andcomplexity(Halford, 1999). This raises the question of whether, for example, the speed of processing mechanism referred to within the literature on intelligence is the same mechanism that has been described in the literature on development. If so, differences in intelligence and differences in cognitive development may be explained by variability on a single dimension—
a proposal Davis and Anderson referred to as the‘uni-dimensional hypothesis’(seeDavis & Anderson, 1999, 2001).
It is also timely to address the question of the relationship between intelligence and development for practical reasons. For example, there has been growing interest within the educational setting concerning plans to adopt strategies to teach children in classes based on ability and not age (Ong, Allison, & Haladyna, 2000; Paton, 2008; Tomlinson, 2012; Ungoed-Thomas, 2005). This involves that curricula be designed so that in each of the core subjects (i.e., English, mathematics, science and history) classes are taught to children of a variety of ages, but who share similar overall levels of cognitive ability. Thus, within the‘ability not age’approach, one mightfind, at primary school level for example, classes of 6-year-olds through to 10-year-olds being taught together.
Proponents of the view that younger, more able and older, less able children are equivalent in their learning needs might be expected to argue that intelligence and cognitive development constitute variation on the same dimension. However, empirical support for this view is lacking. Indeed, it directly contradicts one crucial piece of foundational research carried out byMerrill (1924); later reviewed bySpitz (1982)
in which a mental age (MA) matching design was used to examine the abilities of children of different chronological ages (CA). Using the Stanford–Binet test (Binet, 1916), Merrill showed that groups of youn-ger, more able children and older, less able children arrived at their overall similar level of ability viadifferent strengths and weaknesseson the variety of sub-tests comprising the Stanford–Binet. We present thesefindings shortly. However, the key point is that if differences in intelligence and cognitive development are caused by variability to a single common mechanism, then we might expect there to be no dif-ferences in the performance profiles of the two groups on any of the sub-tests: age differences would be compensated for by intelligence in the younger group, and differences in intelligence would be compensat-ed for by age in the older group.Fig. 1presents a comparison between Merrill's younger (n = 15, mean CA = 5.5 years) and older (n = 54, mean CA = 11.9 years) groups, on 11 sub-tests within the Stanford–
Binet (Binet, 1916). The two groups were matched on an overall mean mental age of 8.0 years. On the y-axis, tasks are divided according to the age-level for which they were intended (i.e., the categories VII, VIII and IX contain the tests typically suited for 7, 8 and 9 year olds, respec-tively). On the x-axis, bars represent reliable differences in percentage points between younger and older children on a given task (i.e., the performance score for one group, subtracted from the performance score of the other group). Bars to the left of zero represent the tasks where the younger children were reliably better than the older children and, conversely, bars to the right of zero represent the tasks where the older were reliably better than the younger group. Thefigure shows that the younger children reliably outperformed the older children on six sub-tests. These were: (1)Comprehension(showing knowledge of appropriate behavior in various social situations); (2) Similarities
(explaining the relationship and similarities between two objects); (3)Superior Definitions (providing definitions of words); (4)Rhymes
(finding as many words as possible within one minute that rhyme
with a given word); (5)60 words(recalling as many words as possible in 3 min from a list of 60 items); and (6)Weights(ordering objects of the same size but different weights in ascending order).Fig. 1also showsfive tasks in which the older children were reliably better than the younger children. These were: (1)Fingers(without counting, the child tells the experimenter how manyfingers he/she has on one, then both hands together); (2)Counting Backwards(the child counts back-wards from 20 to 0 in 40 s, making no more than one error); (3)Change
(how much change should be expected from a given purchase); (4)3 words(using three words provided by the experimenter to produce a sentence); and, (5)Date(knowing and correctly stating the date).
While both groups exhibited the same overall MA,Fig. 1shows different profiles of abilities in the younger and older groups. From this data,Spitz (1982)concluded that younger, more able children would be more likely to excel on tasks involvingverbal reasoningand
abstractionwhile older, less able children would excel at tasks tapping
[image:3.595.306.548.51.293.2]experience,maturationandrote learning. On the basis of this, Spitz argued that it is inaccurate to characterize the two groups as being of the same developmental, or the same cognitive level. This point is critical as it suggests that intelligence and development contribute dif-ferentially to ability and thus are not variations on the same dimension. To our knowledge, Merrill'sfindings have not since been replicated. However, there are several advantages in replicating that design. Firstly, using modern tests of intelligence, it should be possible to obtain more accurate ability profiles of the younger and older groups of children. Secondly, by reducing the range of chronological ages in our groups, we may be more confident that any differences we observe, relate to dif-ferences between children who fall within the normal range of abilities (as opposed to differences between typically developing and atypically developing children). This point is especially relevant when studying lower ability children because, as the gap between their chronological age and mental age increases, so too does the likelihood that some form of learning, or developmental disorder, underlies their poorer per-formance. Given that the younger and older groups in Merrill's study
Fig. 1.Spitz's comparisons ofMerrill's (1924)younger more able (CA = 5.5 years) and older less able (CA = 11.9 years) groups of children, on sub-tests of the Stanford–Binet (Binet, 1916) test. Groups were matched on a MA of 8.0 years. Bars on the left hand-side represent the sub-tests on which the younger group was superior to the older group (pb.05, chi square). Bars on the right-hand side represent sub-tests on which the older group was superior to the younger group (pb.05, chi square). On the y-axis, the categories VII, VIII and IX refer to the age-level tasks were originally intended (i.e., 7, 8 and 9 year olds, respectively). See text for explanations of sub-tests.
were separated by approximately 6 years in age, the question is raised of whether both groups were indeed typically developing.1Third, the
targeted study of the cognitive profiles of younger more able and older less able children offers relevance to current calls to reform educa-tional practices. Specifically, if it were the case that younger and older children, who are matched on overall ability, exhibit very different cognitive strengths and weaknesses, then this would suggest the need to reconsider proposals for the multi-age classroom, as a common teaching practice. Finally, the question of the extent to which younger and older mental age-matched children are similar in their cognitive abilities is highly pertinent to current theoretical debates. For example, while some theorists have proposed intelligence and development are separable (e.g.,Anderson, 1992, 1999, 2001), there has also been an im-plicit convergence in the characterization of the cognitive mechanisms proposed to explain each type of cognitive variation.
In this paper, we outline a study in which we adopt a mental age-matching design to examine the performance profiles of groups of younger and older children who fall within the normal range of ability. Within two separate experiments, we analyze the profiles of these groups within one British sample (Year 2 vs. Year 5) and within one Western Australian sample (Year 2 vs. Year 4), using the sub-tests of the British Abilities Scales 2nd edition (Elliot, Smith, & McCulloch, 1997) and the Wechsler Intelligence Scale for Children, 3rd edition (WISC-III;Wechsler, 1991), respectively. In both experiments, our key objective was to determine whether, once groups were matched on overall mental ability, there were reliable differences similar to those found by Merrill, in their profiles on the individual sub-tests.
2. Method
2.1. Participants
Following parental and child consent, recruitment was carried out in two ways. In Experiment 1 we adopted the selective sampling strategy used by Merrill, in which children were recruited on the basis of teacher's assessments. That is, we tested only those younger children whom teachers ranked among the top 5 in their class, and, for the older age group, those children whom the teachers ranked among the bottom 5 in their class. In Experiment 2, we used a subset of data from a broader research program that was not focused only on the examina-tion of abilities of children matched on MA. Thus, in Experiment 2 we did not impose selective sampling, and tests were administered to all children within the target age groups. Children who were classified with special educational needs (SEN) were not included in any testing. For each experiment, wefirst provide key descriptive statistics of the full sample that were tested, before detailing the sample characteristics of the reduced data set of MA matched children.
In Experiment 1, the selective sampling resulted in the recruitment and testing of a total of 40 primary school children. This sample com-prised 20 children (7 males, 13 females) in the younger age group (range: 6.0–6.8 years), and 20 children (11 males and 9 females) in the older age group (range: 10.0–10.8 years). In Experiment 2, testing was carried out on 231 children (106 males, 125 females). However, a number of cases were removed due to incomplete data leaving 207 in total. In the younger and older groups this comprised 104 children (50 males, 54 females; range: 6.6–7.5 years), and 103 children (46 males and 57 females; range: 8.5–9.8 years), respectively.
2.2. Apparatus
The apparatus consisted of the test items and all associated peripher-al materiperipher-als (i.e., test booklets, stopwatch, pencils and paper), from
(i) the‘School Age’version of the British Ability Scales II (BAS-II;Elliot et al., 1997), designed for use with children aged 6.0–17.9 years, and (ii) the WISC-III (Wechsler, 1991), designed for children aged 6.0– 16.0 years.
2.3. Design
The study adopted a quasi-experimental, mixed design. The between-groups factor was ability, yoked to age. The groups were
younger,higher-ability (YHA) children andolderlower-ability (OLA) children. The dependent variables were measures of performance on each of the sub-tests within the BAS-II (Elliot et al., 1997), and the WISC-III (Wechsler, 1991). Specifically, we converted raw scores on each test to a‘proportion correct’score (i.e., a proportion of the total score possible for a given test), thereby allowing for comparisons across each of the subtests and between the two versions of intelligence tests.
2.4. Procedure
2.4.1. Experiment 1
All participants were tested individually on each of the BAS II Core Scales and Diagnostic tests (Elliot et al., 1997). The full set of items administered from the BAS II Core Scales were (1)Word Definitions
(providing verbal definitions for words); (2)Verbal Similarities (demon-strating how three words are related to each other); (3)Matrices
(completing an array of abstract shapes by choosing the missing shape from a number of candidate shapes); (4)Quantitative Reasoning (choos-ing a card show(choos-ing a number of dots, that completes a pattern in a sequence of other cards also showing a number of dots); (5)Recall of Design(given 5 s to look at a geometric line-drawing and reproducing it as accurately as possible); and (6)Pattern Construction(manually manipulating patterned blocks in order to match a picture showing the same blocks in a specific orientation). As per the standard instruc-tions in the BAS II, the Core Scales were used to derive measures of MA. For each child, we computed full-scale IQ scores using their scores on the Core Scales. MA scores were created by dividing IQ scores by 100 and multiplying this by CA (in months). In addition, the following supplementary tests from the BAS II Diagnostic tasks were administered: (1)Recall of Objects—Immediate(given timed exposure to an A4 card showing 20 colored pictures of objects, once removed from view, children must immediately recall, in any order, as many items as possible); (2)Recall of Objects—Delayed(without a repeated exposure to the stimulus card, after an interval of around 15–20 min, the child is tested again on their recall for the 20 objects); 3)Recall of Objects—Spatial(children are given an empty grid and 20 tiles, each showing one of the colored objects. They must place as many of the tiles as they can, in their correct position in the grid); (4)Speed of Processing(scanning, as quickly and as accurately as possible, lines of numbers on a page and manually crossing out the highest number in each line); (5)Digits Forward(children are read a sequence of numbers at a rate of 2 per second and asked to repeat them in the same order. Sequences start out short, e.g., 2 digits and, with correct responses, get increasingly longer to a maximum of 9 digits); and (6)Digits Backward
(children are required to repeat in reverse order a sequence of numbers that are read aloud at a rate of 2 per second. Sequences are initially shorter, e.g., 2 digits, and with correct responses become progressively longer to a maximum of 7 digits).
2.4.2. Experiment 2
From the WISC-III (Wechsler, 1991) a total of 10 sub-tests were administered individually to all participants. The sub-tests used to measure verbal abilities (scales used to compute verbal IQ scores) were: (1)Information(oral responses are given to general knowledge questions); (2)Similarities(children are orally presented with two words and asked to explain how the words are similar); (3)Arithmetic
(timed response to orally presented mental arithmetic problems); 1
(4)Vocabulary(defining a series of words) and, (5)Comprehension
(participants respond orally to a series of questions that require solu-tions to everyday problems, or understanding of social convensolu-tions). The sub-tests used to compute performance ability (used to compute performance IQ) were: (1)Picture Completion(identifying missing parts of pictures); (2)Coding(children copy symbols that are paired with simple geometric shapes using a key); (3)Picture Arrangement
(ordering a set of mixed picture cards presented in a comic-strip format so that the pictures tell a logical story); (4)Block Design(manipulating 3-dimensional blocks to replicate a 2-dimensional design); and, (5)Object Assembly(assembling the pieces of a series of puzzles that depict com-mon objects within a given time limit). For each child, MA was computed using their full-scale IQ scores (using their verbal and performance IQ scores) dividing this by 100, and multiplying by their chronological age (in months).
In Experiment 1, and where instructions stipulated start items for the age of children, all children started at items suited for 6 year olds. This was because in Experiment 1, where selective sampling was used, all younger children were expected to be of greater ability, and all older children of lower ability. In Experiment 2, where no selective sampling strategy was used, and thus where there were no prior expectations concerning the abilities of younger or older children, test items started at the level specified for the ages of chil-dren tested.
Within Experiments 1 and 2, the number of sessions each child took to complete the standardized tests varied between 2 and 3 ses-sions, each lasting approximately 30–45 min. The total time taken to complete the standardized tests was approximately 90 min. Within these sessions, the order of the tests remainedfixed, with participants completing tasks in the order they appeared in the test booklet.
3. Results
3.1. Experiment 1
3.1.1. Full sample
In the full sample, data were complete on all BAS II Core scale measures with the exception of one case, in the older children group, where scores for Verbal Similarities were missing. These data were computed using the mean of their scores on the otherfive Core scales. For two other cases, data were missing on three or more of the
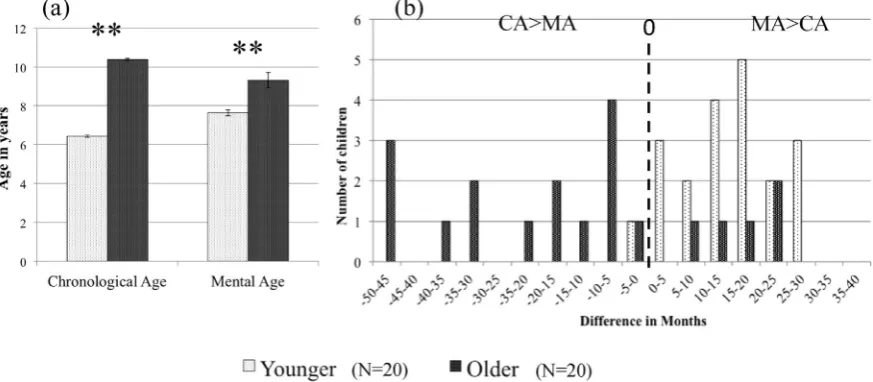
Diagnostic measures. These data were not replaced, and were omitted from the analyses. The overall CAs and MAs for the younger and older groups are presented inFig. 2a. The difference of 47 months in CA be-tween the younger and older groups was reliable (F(1,39) =2850.65,
pb.001,η2=.99). However,Fig. 2also shows that the method of using teacher and school assessments to recruit groups of younger more able and older less able children was not completely reliable. Had the selective sampling been reliable,Fig. 2b would show MA–CA differences in the younger group all above zero, and MA–CA differences in the older children group all below zero. Instead,Fig. 2b shows some of the younger children obtained overall ability scores that were average, or below average for their age, and that some of the older children obtained overall ability scores that were average, or above average for their age. A one-way ANOVA confirmed the MA difference of 20.1 months between the MAs of younger and older groups to be signif-icant (F(1,39) =14.77,pb.001,η2=.280).
3.1.2. MA matching
To compare the performance profiles of exactly matched groups, we create a subset of the data, where younger children exhibit MA greater than their CA and where older children exhibit MA lesser than their CA. This permits a categorical group comparison between younger and older children more evenly matched on MA. Given the ages we tested 6–10 years old, we aimed to achieve matched groups where there would be an overall average MA of 8, and thus where the magnitude of differences between MA and CA in both groups would be approxi-mately equal. The process of obtaining MA matched groups involved testing equal positive and negative cut-offs around MA–CA = 0, that allowed the greatest number of children to be retained in each group, while keeping MA stable. Selecting younger children with MA–CA differences greater than 7.5 months and older children with MA–CA differences more negative than−7.5 yielded the largest sample in the reduced dataset. The reduced dataset comprised 14 younger and 14 older children.Fig. 3a & b presents the mean CAs and MAs, and the differences between MA and CAs in these groups, in the reduced set.
Fig. 3b now shows a clearer division between younger and older groups. A univariate ANOVA showed the mean difference of 47.3 months between the groups' CAs was highly reliable (F(1,27) = 2319.30,
[image:5.595.76.513.55.246.2]pb.001,η2=.99), while the mean difference of 4 months in their MA was not (F(1,27) =1.02,p=.321,η2=.04). These groups can thus be more clearly defined asyoungerhigherability (YHA) andolderlower
Fig. 2.Experiment 1: (a) Mean CAs and MAs in full sample of younger and older primary school groups. (Error bars show standard errors of the mean. Double stars represent significant differences at the .001 level.) (b) The actual MA–CA disparities in younger and older primary school groups. Data to the left of the dashed black vertical line (at point 0) represent children with MAs lower than their CAs. Data to the right represent children with MAs higher than their CAs.
ability (OLA) groups. The computed mean IQ of these groups were: YHA = 125, and OLA = 81.2
The mean proportion correct on each of the six Core Scales is presented inFig. 4. A MANOVA performed on these data showed no group differences in overall profiles between YHA and OLA (F(1,26) =.69,p=.415).
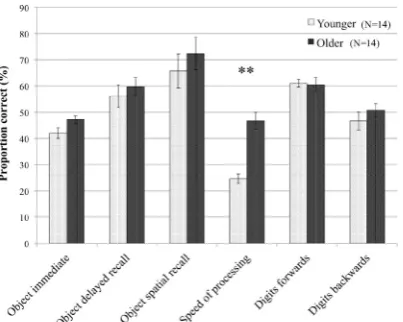
On the supplementary Diagnostic subtests included in the BAS-II, highly similar profiles between YHA and OLA were found again.Fig. 5
shows the mean proportion correct across these six tests for the YHA and OLA groups. A MANOVA performed on these data however revealed an overall main effect of Group (F(1,25) =7.40,p=.012, η2=.228).Fig. 5indicates this effect was primarily due to the large between-group differences on one sub-test, Speed of Processing. The univariate results of the MANOVA indicated that the YHA and OLA differed on two tasks, Object Immediate and Speed of Processing; with the OLA group performing better in each case (Object Immediate: 50.6 vs. 39.6; Speed of Processing: 46.8 vs. 25.6). Only Speed of Process-ing survived a Bonferroni correction for multiple comparisons (Object Immediate uncorrected:F(1,25) =4.07,p=.05,η2
=.140; Speed of Processing uncorrected: (F(1,25) =38.64,pb.001,η2=.607). As with the Core scales, no test indicated reliably superior performance of the YHA group.
3.2. Experiment 2
3.2.1. Full sample
Within the full sample tested, data were complete for 207 of the 232 children. Missing data were not replaced and these cases were omitted from the analysis.Fig. 6a shows the mean MA and CAs for the groups of younger (N = 104; 50 males, 54 females) and older (N = 103; 46 males, 57 females) children. Due to the fact that no selective sampling was used,Fig. 6b shows a wider distribution of abilities in both groups. Prior to selecting a subset of children more closely matched on MA, uni-variate ANOVAs confirmed that the differences observed were reliable, in both the CAs (F(1,205) =2953.83,pb.001,η2=.93), and the MAs (F(1,205) =193.69,pb.001,η2=.48) of younger and older children.
3.2.2. MA matching
MA matched groups were obtained by testing equal positive and negative cut-offs around MA–CA = 0, that allowed the greatest number of children to be retained in each group, while keeping MA stable. Selecting just those younger children for whom MA–CA differences were positive and greater than 3.5 months and older children for whom MA–CA differences were more negative than−3.5 months, and around a mean MA of 8.5 (±1 sd) yielded the largest a subset of 39 younger children (20 males, 19 females; mean age = 7.2 years, se = 0.04) and 22 older children (12 males, 10 females; mean age = 9.1 years, se = 0.05), matched on a mean MA of 8.4 years (se = 0.07). A univariate ANOVA showed the mean difference of 22.8 months be-tween the groups' CAs was highly reliable (F(1,59) =676.84,pb.001, η2=.920), while the mean difference of 1 month in their MA was not (F(1,59)=0.566,p=.455,η2=.009). Once again, these groups more clearly form the YHA and OLA groups.Fig. 7a depicts the CAs and MAs for the YHA and OLA groups. The computed mean IQ of these groups were: YHA = 115, and OLA = 92.3
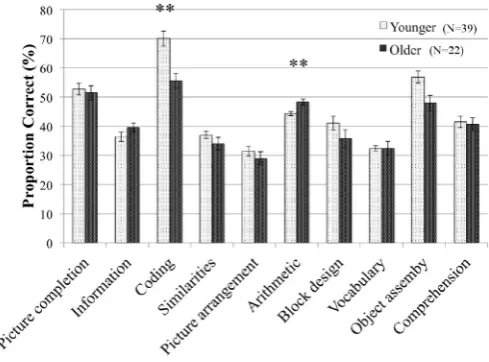
A MANOVA on the proportion correct for the 10 core scales revealed reliable differences in performance between YHA and OLA on only two of the sub-tests: Coding (F(1,59) =16.35,pb.001,η2=.22); and, Arith-metic (F(1,52) =11.58,p=.001,η2=.16). These differences survived Bonferroni corrections for multiple comparisons (p[0.05 / 10] = 0.005).
Fig. 8gives the profiles of performance on the WISC-III core scales for YHA and OLA groups. Thefigure shows YHA outperforming OLA on Cod-ing (70.3 vs. 55.9) and the OLA outperformCod-ing YHA on Arithmetic (47.8, vs. 44.1).
Using a different standardized test of intelligence within a different sample, Experiment 2 yields results that appear largely similar to the re-sults of Experiment 1. In both experiments we failed to replicate the findings ofSpitz (1982), who reported reliable differences in the respec-tive profiles of groups matched on an MA of 8.0 years. The results from the current study indicate that younger and older ability matched chil-dren exhibit broadly similar profiles of performance on the sub-tests.
4. Discussion
On the basis of Merrill's earlier work, Spitz argued that MA-matched children of different chronological ages do not possess similar skills or
2
YHA IQ = 96.5 / 77.1 × 100 = 125.1. OLA IQ = 100.5 / 124.4 × 100 = 80.7. 3
[image:6.595.86.525.55.252.2]abilities, but that they arrived at the same overall ability level through different strengths and weaknesses. In replicating Merrill's original de-sign, we found a very different set of results, using two standardized tests of intelligence. Our MA-matched groups of YHA and OLA children differed reliably on only 3 out of 22 sub-tests that we administered. Experiment 1 found no instances where the YHA reliably outperformed the OLA, and only one instance where the OLA reliably outperformed the YHA. In contrast to Spitz'sfindings whereby the YHA had an advan-tage on tasks tapping verbal abilities (e.g., Comprehension, Similarities, Superior definitions, Rhymes, and 60 words), we did notfind, for exam-ple, the YHA group to outperform the OLA on Word Definitions or Verbal Similarities. Similarly, where Spitz previously found the OLA to have advantage on tasks tapping experience (e.g., Fingers, Counting backwards, Change, 3 words and Date), we might have expected the OLA in our study to have the advantage on tasks such as Recall of Designs and Pattern Construction. This was not the case, and the kinds of differential patterns of strengths and weaknesses that Spitz showed were not revealed.
In Experiment 1, the YHA and OLA groups were not statistically distinguishable in their performances on the Core Scales, and there was little difference between the YHA and the OLA on the Diagnostic tests. Only one reliable difference emerged between groups. This was
on the Speed of Processing task, where the OLA group showed superior performance to the YHA group. This group difference on the Speed of Processing task appears to sit at odds with the role of speed proposed by Anderson, whereby speed is argued to be responsible for producing variability within-ages, but not between-ages (Anderson, 1999). If the Speed of Processing task reliably samples a speed mechanism such as the one Anderson describes, then we would expect performance on this task to be superior in the YHA group.
Experiment 2 showed that younger and older MA-matched groups differed reliably on 2 sub-tests. On the other 8 sub-tests the groups were no different in their performances. As in Experiment 1, and again in contrast to Spitz, Experiment 2 revealed no advantage of verbal abil-ities in the YHA group. For instance, YHA and OLA groups were not different on Vocabulary, or Information. In contrast to Experiment 1, however, in Experiment 2, it was the YHA who outperformed the OLA on Coding; a task designed to tap speed of processing. Thisfinding is consistent with Anderson's speed of processing account. The OLA ad-vantage over the YHA on Arithmetic was consistent with the results Spitz reported, suggesting an advantage of age. In contrast to Spitz, our results indicate that MA-matched children of different chronological ages are largely similar in their cognitive abilities.
While Experiments 1 & 2 appear to offer conflicting results with re-gard to the sub-tests tapping speed of processing, we argue that (1) dif-ferences in the relative contributions of these tests to IQ scores, and (2) differences in the processes that the sub-tests measure, account for these seemingly contradictoryfindings. Firstly, the respective sub-tests used to tap speed, within the BAS II and WISC-III, do not appear equivalent in their contributions to measures of intellectual ability. That is, on the BAS II measures of overall ability are created using the scores from the Core Scales. The Speed of Processing task (one of six Diagnostic measures) is used to gain insight into a child's abilities on the Core Scales, and so performance on this Diagnostic scale does not contribute to resultant IQ scores. In contrast, the Coding sub-test on the WISC-III does form a core measures, and consequently it is used to generate overall IQ scores.
These differences indicate that in addition to tapping speed, the tests may differ more critically in the cognitive processes they are sensitive to. For instance, on the Speed of Processing sub-test on the BAS II, chil-dren are tested for how quickly they can read and cross out the highest number on each line of a page containing several lines of numbers.4The
task is therefore heavily reliant on processing information relating to number. Given greater experience with number concepts it seems plausible that older children (i.e., who have more familiarity with num-ber concepts via schooling) would show an advantage. This is what our results showed in Experiment 1. This argument alsofits with ourfinding in Experiment 2 where the OLA outperformed the YHA on Arithmetic (another sub-test where experience with number concepts would likely lend an advantage). Accordingly, thesefindings are consistent with Spitz's view that superior performance of older less able children over younger more able children is, at least in part, influenced by experience. On the WISC-III, the Coding sub-test used to assess Speed requires that children use a key to copy information paired with different geo-metric shapes, to a number of empty geogeo-metric shapes on a page.5
Be-cause of the abstract nature of this task, it would seem reasonable to expect more intelligent individuals to show an advantage on this task. Indeed, the result from Experiment 2, where the YHA outperformed the OLA is consistent with this view.
In attempting to understand the source of differences between ourfindings and those reported by Spitz, it is important to consider a number of possible limitations in the approach we took. Firstly, in Experiment 1 the strategy for using a selective sampling procedure
4 Speed of Processing performance is assessed via the approximate time children take to
complete a page (e.g., 5 points forfinishing between 0 and 10 s, and 4 points for 11–15 s).
5
[image:7.595.35.282.49.232.2]Coding performance is assessed via the number of correct pairings children complete within 120 s.
[image:7.595.60.262.528.689.2]Fig. 5.Experiment 1: Mean proportion correct on the six BAS-II Diagnostic tests for MA-matched YHA and OLA primary school groups. See text for explanations of sub-tests. (Error bars show standard errors of the mean. Double stars represent significant differences at the .001 level.) Note, the group mean MAs used in the matching were derived from the Core test results shown inFig. 4, according to the BAS-II procedures. Fig. 4.Experiment 1: Mean proportion correct on the six BAS-II Core Scales for MA-matched YHA and OLA primary school groups. See text for explanations of sub-tests. (Error bars show standard errors of the mean.)
(akin to the one Spitz reported) was to maximize the likelihood of obtaining our target groups of younger more able and older less able children. However, our results showed this method was not fully reli-able. Using teacher's assessments to select the top 5 younger children, and the bottom 5 older children in their respective classes, did not result in younger children all with MAs greater than their CAs, and older children all with MAs less than their CAs. In the full sample that we tested, we found a number of younger children for whom their MAs appeared equal to their CAs, and a number of older children with MAs equal to, or above their CAs. These children were therefore not included in our comparisons of YHA and OLA groups. Consequently, in Experi-ment 1 we obtained a relatively small sample size (N = 28) thus limit-ing the generalizability of our findings (the computed power of Experiment 1 is 0.39). Importantly, though, in Experiment 2 where we achieved a larger sample (N = 61), and where we had adequate power (the computed power in Experiment 2 is 0.72), we replicated the pattern of highly similar cognitive profiles in MA-matched groups
of YHA and OLA children. On a separate note, it is an intriguingfinding that on the standardized intelligence test we used, 6 out of 20 older children, who were believed to be of low ability, scored average or above average in their ability. At the very least, this suggests that the older children who were performing poorly at school were doing so for reasons other than their cognitive ability. Future research is aimed at examining the role social and emotional factors might play in influencing academic outcomes for such children.
[image:8.595.71.538.55.266.2]Experiment 2 revealed a different limitation, also related to the sam-pling process we used. Specifically, this concerns a general problem in MA-matching designs where in order to achieve groups of individuals closely matched on MA, it is typically necessary to test a great many more subjects than are used in the analysis. While the data collected in Experiment 2 were obtained as part of a broader research program, the cost (in terms of time and resources) can be considerable, and thus these factors may play a significant role in influencingfinal sample numbers.
[image:8.595.82.530.509.710.2]Fig. 7.Experiment 2: (a) Mean CAs and MAs for reduced set of primary school children. (Error bars show standard errors of the mean) (b) Mean MA–CA disparities of younger and older groups in reduced set of primary school children. Data to the left of the dashed vertical line (at point 0) represent children with MAs lower than their CA. Data to the right represent children with MAs higher than their CA.
Another difference between our approach and the one Spitz adopted is that the spread of ages we tested was not as great compared to those Spitz used. Although the samples we achieved were also YHA and OLA, in our study the mean age differences in CAs between YHA and OLA groups were 3.9 years and 1.9 years, in Experiments 1 & 2 respectively. In Spitz's study the mean age difference between YHA and OLA groups was 6.4 years. This highlights an important tension in replicating a design whereby the aim is simultaneously to create a disparity in CA, and eliminate any disparity in MA. The tension that arises is due to the fact that as the disparity between CA increases, there is increased likeli-hood that at the lower end of the spectrum the poorer abilities of the older less able children are due to some form of developmental disorder. Given the larger gap in ages between the samples that Spitz used, it is possible that within his OLA group were children with developmental, or learning disorders. Thus, the differences Spitz found in the cognitive profiles of YHA and OLA children may be due to important differences in the cognitive processes that underlie test performance in atypically developing children, versus lower ability children at the low end of the normal range.
Afinal point of difference between our approach and that of Spitz's, concerns the tests we used. Spitz compared the performance profiles of YHA and OLA groups on the Stanford–Binet (Binet, 1916); thefirst revi-sion to Binet's early test items (1906). Our comparisons of YHA and OLA groups used the BAS II and the WISC-III, each of which have profited from over 80 years of refinement. Though over time all intelligence tests may have drawn criticisms for their power to accurately assess abilities, particularly relevant here is the possibility that the early versions of the Stanford–Binet test were verbally loaded and that the verbal instructions that accompanied several of the sub-tests may have unfairly disadvantaged children with a poorer grasp of language (see e.g.,Becker, 2003).6Under this view, such a limitation may have
favored the younger more articulate children in Merrill's data and disad-vantaged the older ones. However, the test's verbal loading would not account for the advantages that Spitz showed in the OLA. Herein lies another potentially important difference between the Stanford–Binet (Binet, 1916) and the tests we used. Whereas the Stanford–Binet test (Binet, 1916) included items to tap age, or maturational effects (test items such as tying shoes, counting change and correctly stating the date), there do not seem to be equivalent tasks in the BAS II, or WISC-III. Though the latter tests include sub-tests such as Recall of Designs
(a drawing task in which motor control might be assumed to be more advanced in older children), this task likely also involves some compo-nent of frontal, executive control in planning the copy of that drawing from memory. Taken together, the presence of a verbally loaded Stanford–Binet (which may have advantaged Merrill's YHA group) and lack of pure age or maturational tests in the BAS II and WISC-III, may explain the differences between the results presented here and those of Spitz.
Notwithstanding the limitations discussed, we believe that our re-sults offer a rich source for new questions concerning the relationship between cognition and intelligence to be examined. Overall, the results of both experiments suggest a different view from that advanced by Spitz. The data from the current study suggest that when closely matched on mental age, the cognitive and intellectual abilities of groups of children of different ages are largely similar. Whatever disadvantages the OLA group experiences as a result of their lower abilities, these are compensated for by their greater age; and conversely, whatever the YHA group lacks by virtue of their lower age is compensated for by their greater ability. Thesefindings are critical as they suggest that little discriminates differences in intelligence and cognitive development. That is, in middle childhood, one's level of performance may be reached equally through either greater age and lower ability, or lower age and greater ability.
With regard to the issue of viability of the multi-age classroom ap-proach, the data presented here would support the view that children, if matched closely on mental ability, are largely equivalent in their thinking. Importantly, it is not clear from the current study whether the cognitive profiles of the children we matched on mental ability would continue to be similar over the course of development. Since cog-nitive development is non-linear (i.e., it is protracted in early years and it reaches an asymptote in adulthood), mental-age matching becomes unviable later on. Therefore, it remains to be seen how the profiles of younger higher ability and older lower ability individuals compare in the teenage years, up until the point that MA-matching ceases to be viable. Future research incorporating a longitudinal approach would allow this question to be more fully answered.
In conclusion, and in answer to the central question raised in the introduction, we argue that being more intelligent is like having more development. The similarity observed in the profiles between YHA and OLA groups strongly suggests that the mechanisms that are respon-sible for variability in intelligence and development are indeed the same. Thus our study supports a more parsimonious uni-dimensional perspective. The broader implication of this view is that it would therefore be quite meaningless to study separately the mechanisms underlying intelligence from those underlying development. The challenge for future research lies in identifying precisely what the mechanisms are and explaining how these are causally responsible for the variability observed both within ages and between ages.
Acknowledgments
We gratefully acknowledge the schools, parents and children who consented to take part in this research, and the insightful comments of two anonymous reviewers.
References
Ackerman, P.L., Beier, M. E., & Boyle, M. O. (2005).Working memory and intelligence: The same or different constructs?Psychological Bulletin,131(1), 30–60.
Anderson, M. (1992).Cognitive development: Intelligence and development: A cognitive theory.Blackwell Publishing.
Anderson, M. (1998).Ask not what can you do for modularity but what can modularity do for you.Learning and Individual Differences,10(3), 251–257.
Anderson, M. (1999).The development of intelligence.Hove, UK: Psychology Press.
Anderson, M. (2001).Conceptions of intelligence.Journal of Child Psychology & Psychiatry,
42(3), 287–298.
Andreasen, N. C., Flaum, M., Swayze, V. D., O'Leary, D. S., Alliger, R., Cohen, G., & Yuh, W. T. (1993).Intelligence and brain structure in normal individuals.American Journal of Psychiatry,150(1), 130–134.
6
[image:9.595.38.283.52.233.2]Indeed, from Becker's analysis of the history of the Stanford-Binet test, the test remained verbally loaded until its 6th revision in 1986 (Becker, 2003).
Fig. 8.Experiment 2: Mean proportion correct on each of the ten WISC-III sub-tests for MA-matched YHA and OLA primary school groups. See text for explanations of sub-tests. (Error bars show standard errors of the mean. Double stars represent significant differences at the .001 level.)
Becker, K. (2003).History of the Stanford–Binet intelligence scales: Content and psycho-metrics.Nelson, SB5 Assessment Service Bulletin(2).
Binet, A. (1916). New methods for the diagnosis of the intellectual level of subnormals. ES Kite, Trans., the Development of Intelligence in Children. Vineland, NJ: Publications of the Training School at Vineland.(Originally Published in 1905 in L'année Psychologique 12, 1916, 191–244.
Burns, N. R., Nettelbeck, T., & Cooper, C. J. (1999).Inspection time correlates with general speed of processing but not withfluid ability.Intelligence,27(1), 37–44.
Davis, H., & Anderson, M. (1999).Individual differences and development—One dimen-sion or two?The development of intelligence(pp. 161–191). UK: Psychology Press/ Taylor & Francis.
Davis, H., & Anderson, M. (2001).Developmental and individual differences influid intel-ligence: Evidence against the unidimensional hypothesis. British Journal of Developmental Psychology,19(2), 181–206.
Deary, I. J., & Caryl, P. G. (1997).Neuroscience and human intelligence differences.Trends in Neurosciences,20(8), 365–371.
Dempster, F. N. (1991).Inhibitory processes: A neglected dimension of intelligence.
Intelligence,15(2), 157–173.
Elliot, C., Smith, P., & McCulloch, K. (1997).The British ability scales II.London: nferNelson.
Geake, J. G., & Hansen, P. C. (2005).Neural correlates of intelligence as revealed by fMRI of fluid analogies.NeuroImage,26(2), 555–564.
Haier, R. J., Jung, R. E., Yeo, R. A., Head, K., & Alkire, M. T. (2004).Structural brain variation and general intelligence.NeuroImage,23(1), 425–433.
Hale, S. (1990).A global developmental trend in cognitive processing speed.Child Development,61(3), 653–663.
Halford, G. (1999).The development of intelligence includes the capacity to processing relations of greater complexity. In M. Anderson (Ed.),The development of intelligence
(pp. 193–213). Hove: Psychology Press.
Houdé, O. (2000).Inhibition and cognitive development: Object, number, categorization, and reasoning.Cognitive Development,15(1), 63–73.
Jensen, A. R. (1993).Why is reaction time correlated with psychometric g?Current Directions in Psychological Science,2(2), 53–56.
Jensen, A. R. (1998).Human evolution, behavior, and intelligence: The g factor: The science of mental ability.Praeger Publishers/Greenwood Publishing Group.
Kail, R. V. (1996).Source of age differences in speed of processing.Child Development,
57(4).
Mabbott, D. J., Noseworthy, M., Bouffet, E., Laughlin, S., & Rockel, C. (2006).White matter growth as a mechanism of cognitive development in children.NeuroImage,33(3), 936–946.
Merrill, M. A. (1924).On the relation of intelligence to achievement in the case of mental-ly retarded children.Comparative Psychology Monographs,2, 1–100.
Nettelbeck, T. (1987).Inspection time and intelligence.Speed of information processing and intelligence(pp. 295–346).
Ong, W., Allison, J., & Haladyna, T. M. (2000).Student achievement of 3rd-graders in comparable single-age and multiage classrooms.Journal of Research in Childhood Education,14(2), 205–215.
Paton, G. (2008, May 5).'Classes based on ability not age infive years'.The Telegraph.
Plomin, R., DeFries, J. C., & McClearn, G. E. (2008).Behavioral genetics.NY: Worth Publishing New York.
Posthuma, D., & de Geus, E. J. C. (2006).Progress in the molecular-genetic study of intel-ligence.Current Directions in Psychological Science,15(4), 151–155.
Posthuma, D., De Geus, E. J. C., Baare, W. F. C., Pol, H. E. H., Kahn, R. S., & Boomsma, D. I. (2002).The association between brain volume and intelligence is of genetic origin.
Nature Neuroscience,5(2), 83–84.
Spitz, H. H. (1982).Intellectual extremes, mental age, and the nature of human intelli-gence.Merrill-Palmer Quarterly,28(2), 167–192.
Szameitat, A. J., Schubert, T., Muller, K., & von Cramon, D. Y. (2002).Localization of exec-utive functions in dual-task performance with fMRI.Journal of Cognitive Neuroscience,
14(8), 1184–1199.
Tomlinson, Sally (2012).A sociology of special education.Routledge.
Ungoed-Thomas, J. (2005, September 4).School pioneers the all-age class.The Sunday Times.
Wechsler, D. (1991).WISC-III: Wechsler intelligence scale for children.San Antonio, TX: Psychological Corporation.
Wellman, H. M., & Gelman, S. A. (1992).Cognitive development: Foundational theories of core domains.Annual Review of Psychology,43(1), 337–375.
Wright, M., De Geus, E., Ando, J., Luciano, M., Posthuma, D., Ono, Y., & Boomsma, D. (2001).Genetics of cognition: Outline of a collaborative twin study.Twin Research,