DESIGN AND IMPLEMENTATION OF A 2.4 GHZ EMBEDDED RFID SYSTEM FOR FRUIT MATURITY EVALUATION FOR AGRICULTURAL
INDUSTRIES UTILIZING WIRELESS MESH SENSOR NETWORK
AZLINA BINTI OTHMAN
A project report submitted in partial fulfillment of the requirements for the award of Master of Electrical Engineering (Telecommunication)
Faculty of Electric and Electronic Engineering Universiti Tun Hussein Onn Malaysia
iv
Special dedication to my loving father Othman Bin Yusuf , my mother Siti Sareah Binti Japri, my loving husband Abd Jalil Bin Elias and my beloved daughters son Qaisara. Qayyim and Qasrina, my kind hearted supervisor Dr
ACKNOWLEDGEMENT
My sincerest thanks go to my supervisor, Dr. Farhana Binti Ahmad Poad for her dedication to her students and patience in assisting me with this thesis. I appreciate her valuable advice and efforts offered during the course of my studies. I would also like to thank to Pm. Madya Dr Afandi Bin Ahmad lecturer subjects for Research Methodology for their equally valuable support generously given during do my thesis.
vi
ABSTRACT
ABSTRAK
viii
TABLE OF CONTENTS
CHAPTER ITEM
TITLE
PAGE
i
DECLARATION ii
iii
DEDICATION ACKNOWLEDGEMENTS iii
v
ABSTRACT vi
CONTENT viii
LIST OF TABLE xi
LIST OF FIGURES xii
LIST OF ABBREVIATIONS xv
I INTRODUCTION 1 1.1 Introduction 1 1.2 Problem Statement 2 1.3 Objectives 3 1.4 Scopes Project 3 1.5 Thesis Outline 4 II LITERATURE REVIEW 2.1 Introduction 5 2.2 Overview of Fruit Maturity 5
2.2.1 Non- Colour Based Grading 6
2.2.1.1 Fruit Taste 6
2.2.1.3 Fruit Shape and Size 8
2.2.1.4 Fruit Weight 9
2.2.2 Colour Based Grading 9
2.2.2.1 RGB Colour Space 10
2.2.2.2 HSI Colour Space 10
2.2.2.3 L*a*b* Colour Space 11
2.2.2.4 YCbCr Colour Space 12
2.3 Overview of RFID 12 2.4 Part of RFID 13
2.4.1 RFID Antenna 14
2.4.2 RFID Tag 14
2.4.2.1 Passive RFID Tag 15
2.4.2.2 Partial Passive RFID Tag 16
2.4.2.3 Active RFID Tag 17
2.4.3 Frequency Range of RFID 18
2.5 Overview of Wireless Sensor Network 18 2.6 Overview of Wireless Mesh Sensor Network 20
2.7 Overview of Zig Bee 20
2.8 Summary 23
III PROJECT METHODOLOGY 26
3.1 Project Workflow 26 3.2 Overall Project Methodology 27 3.3 Software Implementation 28
3.4.1 Input Image 29
3.4.2 Pre-processing 29
3.4.3 Feature Extraction 29
3.4.4 Classifier 30
3.4 MATLAB Software 31
3.5 X-CTU Software 32
x
3.6.1 Webcam 34
3.6.2 Arduino Uno 35
3.6.3 Xbee Pro S2b 36
3.6.4 Xbee Shield 37
3.6.5 LCD Display 36
3.7 RFID Receiver 39 3.8 RFID Transmitter 40
3.9 Summary 40
IV RESULT AND DISCUSSIONS 42
4.1 Introduction 42
4.2 Experimentation Analysis and Result 42 4.2.1 Software MATLAB Validation 44 4.2.2 Software X-CTU Validation 51
4.2.2.1 Test 1- Indoor for Radio Range Test and Throughput
52
4.2.2.2 Test 2- Outdoor for Radio Range Test and Throughput
54
V CONCLUSION AND RECOMENDATION 58
5.1 Introduction 58
5.2 Recommendations 59
REFERENCES 60
APPENDICES
LIST OF TABLES
NO TITLE PAGE
2.1 Frequency range in RFID with each applications. 18
2.2 Different between RFID and WSN 19
2.3 Comparison of The ZigBee, Bluetooth, Wi-Fi and UWB Protocols
22
2.4 Comparison of previous works for non-color based grading 24
2.5 Comparison of previous works for color based grading 25
3.1 Camera Settings and Parameters 34
3.2 Pin connection between Xbee, Arduino Uno and LCD Display 39
4.1 Results Obtained Original Image and Grey Scale Image 50
4.2 Results Obtained In Terms Precision and Accuracy 51
4.3 Indoor test for distance 1m to 30m 56
xii
LIST OF FIGURES
NO TITLE PAGE
2.1 The experimental setup for testing mango fruit using NIR 7
2.2 The schematic diagram of the electronic nose to detect the mandarin 8
2.3 Computer system vision 12
2.4 Architecture between RFID tags and RFID readers 13
2.5 Example of RFID Antenna 14
2.6 Types of RFID tag 15
2.7 Passive type RFID tag system 16
2.8 Partial passive RFID tag system 16
2.9 Active RFID tag system 17
2.10 The Concept of Wireless Monitoring Wireless Sensor Network 19
2.11 ZigBee Topologies 21
3.1 The Process of Project Methodology 27
3.2 A generalized block diagram of maturity detection of papaya fruits 28
3.3 Original RGB image versus Grey-scale image 29
3.4 Proposed algorithm 30
3.5 Steps for Determination of Fruit Maturity 31
3.6 Xbee series 2 attached with xbee wireless module 32
3.8 Input, Image Processing and Output 33
3.9 Webcam Havic 6I6 34
3.10 Arduino Uno 35
3.11 Xbee Pro S2b 36
3.12 Xbee shield 37
3.13 LCD Display 37
3.14 Schematic for RFID Receiver 39
3.15 Connection for RFID Transmitter 40
4.1 Example of Mature Papaya 43
4.2 Example of Immature Papaya 44
4.3 Experimentation for Papaya 1 45
4.4 Experimentation for Papaya 2 41
4.5 Experimentation for Papaya 3 45
4.6 Experimentation for Papaya 4 46
4.7 Experimentation for Papaya 5 47
4.8 Experimentation for Papaya 6 47
4.9 Experimentation for Papaya 7 48
4.10 Experimentation for Papaya 8 48
4.11 Experimentation for Papaya 9 49
4.12 Experimentation for Papaya 10 49
4.13 Indoor- Radio Range Test and Throughput for 1m 52
xiv
4.15 Indoor-Radio Range Test and Throughput for 20m 53
4.16 Indoor-Radio Range Test and Throughput for 30m 53
4.17 Outdoor- Radio Range Test and Throughput for 1m 54
4.18 Outdoor-Radio Range Test and Throughput for 10m 55
4.19 Outdoor-Radio Range Test and Throughput for 20m 55
4.20 Outdoor-Radio Range Test and Throughput for 30m 56
4.21 Graph indoor versus outdoor for RSSI 57
LIST OF ABBREVIATIONS
ANN - Artificial Neural Networks GUI - Graphical User Interface FUT - Fruit Under Test
H2H - Human To Human H2M - Human To Machine HF - High Frequency LCD - Liquid Crystal Display
LF - Low Frequency
M2M - Machine To Machine MLR - Multi Linear Regression NIR - Near Infrared Reflectance PCA - Principal Component Analysis PLS - Partial Least Squares
CHAPTER 1
INTRODUCTION
1.1 Introduction
Agriculture is one of the contributors of the country economic policy, especially in the third world such as Malaysia, China and many parts of Asia. There are various methods to improve productivity and fruit quality such as color based grading and non-color based grading. Most farmers have less knowledge on how to manage their farm and they are unaware on how to improve their productivity of agricultural practices. Therefore, an RFID-WMSN based system is proposed to predict the maturity of fruits. In this work, papaya is selected as Fruit Under Test (FUT), since it is one of the Malaysia’s local fruit with high demand request from Malaysian.
In agriculture industries, determinations of fruit maturity and quality are very important. There are two popular methods for fruit maturity prediction, which are non-destructive and noninvasive technique. These two methods allow the physical properties of the fruits is measured according to its maturity and quality indicator [1]. The papaya is said to be matured, if the flesh is soft, sugar is increased, soluble and total solids as well as increase in pigmentations. [1]. Most of researchers [1] used non-destructive testing technique to test fruits since this method is save for papaya, provide real-time measurement, low in costing, and less time consuming.
labor in future of fruit industries. In addition, an algorithm is proposed to automatically identify the defect in the fruits and maturity of papaya using image processing technique. The development of RFID-WMSN based system for agriculture industries will possibly increase the efficiency, productivity and profitability, as well as decreasing unintended effects on crops and the environment in agriculture production.
1.2 Problem Statement
In fruit industries, the maturity of papaya is manually predicted by human based on color which is prone to error and inefficiency due to the human subjective nature. The effectiveness of this manual classification highly depends on the experience, expertise and high concentration of the operator. Which leads to the increment the cost of labor during maturity classification of papaya. The demand for high quality fruits by consumers has increased day by day. Fast, efficient and cost effective quality control is needed to achieve the target of production. Therefore, a system that able to predict the maturity of papaya is developed by introducing RFID-WMSN technologies on a single platform. The prediction of fruit maturity is done by MATLAB software based on consecutive algorithm.
1.3 Objectives
The objectives of this project is as follows:
i) To design a new architecture of embedded system prototype components that comprise of the RFID technology and WMSN platform.
ii) To develop fruit maturity system which can analyze, classify and identify fruits based on color.
3
1.4 Scopes Project
There are 3 main part of the scopes. i. Identify fruit maturity.
MATLAB Software was used to identify the fruit maturity based on image processing concept. That means can differentiate by its color. ii. Embedded system prototype components that comprise of the RFID
technology.
Used active RFID and arduino UNO as controller. RFID be able to transmit between 30 to 60 meters indoor without router and more than 200 meters outdoor as a standalone device. The data, information and number of products produced can be of real time controlled and monitored by user.
iii. Utilizing with wireless mesh network.
Field monitoring uses 2.4 GHz operating frequency nodes for the purpose of study. Used Xbee Pro S2b as a main component for data transmission.
1.5 Thesis Outline
This thesis consists of five chapters which are Chapter 1: Introduction, Chapter 2: Literature review, Chapter 3: Methodology, Chapter 4: Result and Analysis and Chapter 5: Conclusion
Chapter 1 explains on the background of the project including introduction, problem statement, objectives and scopes of the project.
highlighted on the existing technology used for data transmission as well as the network topology available.
Chapter 3 discusses on the methodology of the project suggested in order to complete the development. It can be divided into two parts namely hardware and software. The hardware part focuses on the system development including the RFID tag and reader portion. The software part refers to the development of algorithm that use image processing method using MATLAB 2009B version, while the X-CTU program is used to configure the Radio Frequency (RF) Module.
Chapter 4 focuses on the result and analysis of the fruit maturity system based on RFID-WMSN platform. From here, it can be seen the performance of this project. The performance of the develop system and algorithm are tested based on color. Algorithm 1 is developed for pre-processing of the database and algorithm-2 is proposed for identification of defects.
5
CHAPTER 2
LITERATURE REVIEW
2.1 Introduction
In this chapter, the important aspects of RFID are described and relevant background research is later explained to understand the current state of the art and a review of the previous works undertaken in designing RFID system for fruit maturity prediction is performed to suit the requirements before a complete system can be developed. Finally, this research work is put in context with the previous and current research activities.
2.2 Overview of Fruit Maturity
two categories, which are first non-color based grading and color based grading. In this project, maturity color based grading is the main inspection criteria for papaya. The maturity of papaya changes from green (immature) to yellow (mature).
2.2.1 Non-color Based Grading
Preliminary, fruits in the market are inspected based on its maturity (non-color based grading). Consequently, several works have been identified on the fruit grading based on its taste, smell, weight, shape and size.
2.2.1.1 Fruit Taste
Fundamentally, the maturity of fruits can be determined through the taste of sour (immature) to sweet (mature) [4]. Therefore, by using Near Infrared Reflectance (NIR) method, the sucrose level content in various grades of mangoes maturity can be determined. [4]. In the previous research performed by A. Afhzan et al. [4], the acquired analysis indicates that there is a correlation between the absorption of infrared and the percentage of the sucrose level for each watermelon. Multi-linear regression (MLR), principal component analysis (PCA) and partial least squares (PLS) regression with respect to the reflectance and its derivative, the logarithms of the reflectance reciprocal and its second derivative are the vital components to develop NIR models [4].
7
Figure 2.1 : The experimental setup for testing mango fruit using NIR [7]
In determining the sugar content of melons, sugar absorption band method via NIR was used to avoid bias caused by the color information of melons proposed by Tsuta [8]. From this related work, each of the second-derivative absorbencies at 874 nm and 902 nm had a high correlation with the sugar content of melons. Xiaobo [9] used NIR to measure sugar content inside ‘Fuji’ apple. Using Multiple Linear Regression (MLR), and it is observed that there is an existing correlation between content of sugar and various NIR wavelengths in this particular work. Also, sugar content of a fruit can be determined as well as it sweetness.
2.2.1.2 Fruit Smell
A. H. Gómez et al. [11] has proposed an Electronic Nose to identify the maturity of tomatoes, as the Electronic Nose device uses ten different metal oxides sensors (portable E-nose, PEN 2) with respect to the changes of volatile production [11]. Consequently, it has been proven that the Electronic Nose PEN 2 is a successful methodology in identifying the maturity of tomato other fruit such as blueberry, apple, and mandarin [12]
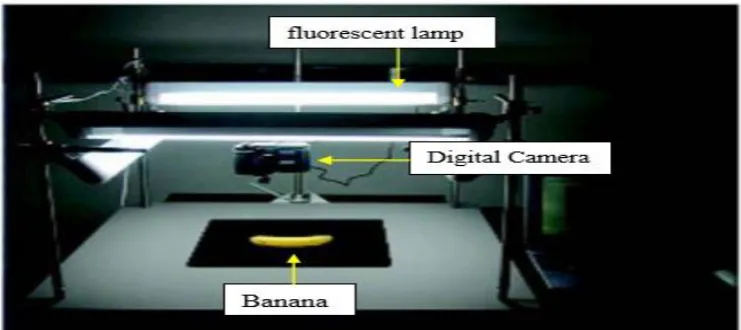
[image:21.595.179.492.427.554.2]The Electronic Nose is an efficient process and non-destructive method in practically sensing the scent of fruits as well as expecting the uppermost crop period of time. Moreover, there is an available commercial Electronic Noses that uses an array of sensors combined with pattern recognition software [13]. Additionally, there have been several hearsays on electronic sensing in environmental control, medical diagnostics in the food industry, as a good correlation between the electronic nose signals and firmness, starch index, alongside with acidity parameters were found in this procedure and electronic noses portray the potential of becoming a reliable device to determine the fruit maturity [13]. Figure 2.2 shows that the schematic diagram of the electronic nose method potential checking mandarin maturity [14].
Figure 2.2 : The schematic diagram of the electronic nose to detect the mandarin [14]
2.2.1.3 Fruit Shape and Size
9
strawberry contour are extracted from its shape and in eliminating the influence of the strawberry size, normalizing the line sequences eliminates its length of the shape. Also, size grading is implemented in strawberry and a similar process is desired, which is to reach the maximum horizontal diameter. Besides, from the fruit size the maturity of strawberry can be estimated by contour line sequence.
2.2.1.4 Fruit Weight
Additionally, in determining the fruit maturity by its weight, the fruit density or area of cross section of the fruit must be provided. Hsieh and Lee [16] introduced a homemade hyper-spectral imaging system to detect internal and external quality of papaya. Herein, to predict weight, the area parameter can be a linear correlation with a coefficient of 0.93, where the absolute calibration error is around 7% when area of side view cross section of the fruit was used.
2.2.2 Colour Based Grading
2.2.2.1 RGB Colour Space
Many researchers due to the imaging or features represented in the RGB color space broadly utilize RGB color space. The methodology works feasibly through an extract from the number of pixels of an image. Additionally, Abdul Rahman [17] used and applied RGB color space in order to monitor the ripeness of watermelon as the color space is used in extracting features from the watermelon. Also, fuzzy logic system is utilized to classified color features extracted from the three RGB components. The purpose is to determine the ripeness level of the watermelon. Herein, 95%-100% accuracy of a total of 90 samples, which contains 30 samples for each category, was achieved.
2.2.2.2 HSI Colour Space
Notwithstanding on the method employed, HSI color space was also performed by Abdullah [18] to classify starfruit maturity through its surface skin color into its maturity index based on single Hue. Therefore, in establishing the color recognition techniques, multivariate discriminant analysis and multi-layer perceptron neural network was used. This work is practicable to differentiate the maturity of the star fruit into four groups of unripe, under ripe, ripe, and overripe. Additionally, about 92% of the tested samples could be classified in this technique. Besides, Mohd Mokji has performed previous related work as well on the starfruit color maturity classification [19]. The investigation was developed based on the FAMA’s old version of starfruit color maturity standard, whereby the classification if performed at six different indices and the accuracy of this work has achieved about 93.3% for starfruit color maturity.
11
2.2.2.3 L*a*b* Colour Space
Also, L*a*b* color space was performed by Kang [20] in 2008 based on the color changes of a mango. The investigation measured on the color value of a* and b* on a curved surface that delivers about 55% to 69% of the percentage within its range measured. Additionally, hue angle and chrominance have an average error of 2 and 2.5 respectively by using the measurement results. Syahrir [21] also uses the L*a*b* color space in investigating if whether a tomato has rotten. The image was later improved through a filter and threshold process before converting the image to L*a*b* color space format. About 90% of the tomatoes tested were not rotten according to the test outcomes and thus the judgment of tomato maturity and the estimation of tomato’s expiry date were précised in this work. Besides, nine simple features of the appearance extracted from images of bananas were used for grouping purposes. The nine simple features are L*, a*, b* values; brown area percentage, number of brown spots per cm2, homogeneity, contrast, correlation, and entropy of image texture.
L* is the luminance or lightness component that goes from 0 (black) to 100 (white), and parameters a* (green to red) and b* (blue to yellow) are the 2 chromatic components, varying from – 120 to +120. The results obtained are precisely match with human observation that makes the system important to be used.
Figure 2.3 : Computer system vision
2.2.2.4 YCbCr Color Space
Shah Rizam [23] measured the ripeness and quality of watermelon based on YCbCr color space in 2009. Cb and Cr were calculated and computed by using Artificial Neural Networks. The system shows that the system can be used to classify the watermelon because the accuracy 86.51% was achieved.
2.3 Overview of RFID
13
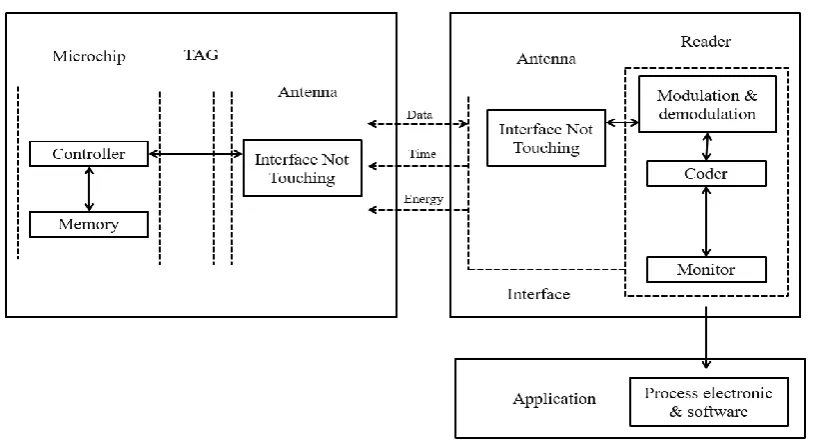
[image:26.595.126.533.221.442.2]now are RFID tags that are passive RFID is one of an operative automatic identification technology for different things. The ultimate function of RFID is the capability to trace the position of the tagged things.RFID tags attempt to receive and act repercussions against an object to be impressed with the help of an antenna emitted by RFID tags and RFID readers. Figure 2.4 shows the architecture between RFID tags and RFID readers.
Figure 2.4 : Architecture between RFID tags and RFID readers.
2.4 Part of RFID
2.4.1 RFID Antenna
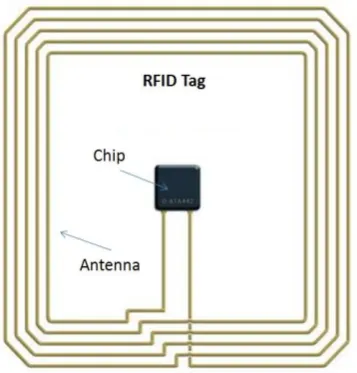
[image:27.595.247.426.299.486.2]RFID antenna is a device that transmits radio signals to enable RFID tags and RFID readers. The RFID antenna is able to read, write and control data acquisition and communication systems between RFID tags and RFID readers. The RFID antenna can be designed according to its use in RFID applications such as the use of home theft security tools, the RFID tag system applied in highway toll payments more. Electromagnetic field generated by the RFID antenna can detect the presence of RFID tags at a certain distance according to the type of RFID used. Figure 2.5 shows the example of RFID Antenna.
Figure 2.5 : Example of RFID Antenna
2.4.2 RFID Tag
15
Figure 2.6 : Types of RFID tag
2.4.2.1Passive RFID Tag
Figure 2.7 : Passive type RFID tag system.
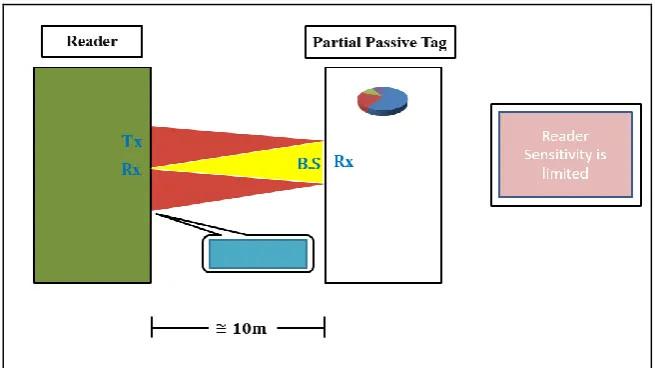
2.4.2.2Partial Passive RFID Tag
Partial passive type RFID tags are similar to active RFID tags for example they have their own power source but the batteries used are just to empower microchips instead of sending signals. Radio frequency energy will be reverted to RFID readers such as passive RFID tags. Figure 2.8 shows partially active RFID tag systems.
[image:29.595.173.501.497.681.2]17
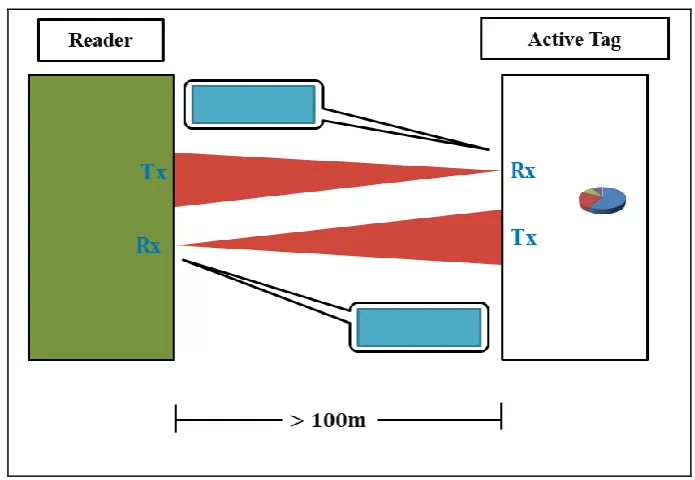
2.4.2.3Active RFID Tag
[image:30.595.144.492.398.638.2]Unlike the passive type tag, the active RFID tag has its own power supply, which uses the power supply to integrated circuits and sends signals to RFID readers. The RFID tag is activated by a power source from an integrated circuit so that the power to be used is sufficient and also produces higher power than the passive type RFID tags to enable it to work more effectively in challenging Radio Frequency environments such as ice, iron or at a fair distance far away. Mostly active type tags have a practical distance of 100 meters and the battery life exceeds 10 years. Active RFID tags are equipped with sensors such as temperature sensors, which are used to indicate the temperature of a material that is easily damaged or durable. Active RFID tags typically have a distance of about 500 m and have greater memory than passive type RFID tags. This RFID tag is also capable of storing additional information transmitted by an information conveyor. Figure 2.9 shows an active type RFID tag system.
2.4.3 Frequency Range of RFID
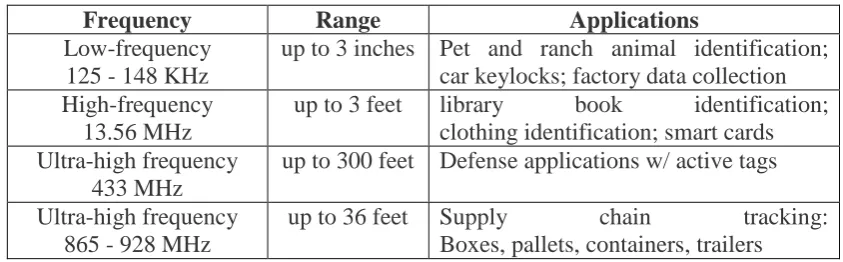
[image:31.595.107.529.317.448.2]The main aspect required in RFID selection is the appropriate frequency to be applied to the system. This is because the appropriate frequency should be chosen to allow wireless communication between the RFID reader and RFID tags to be interconnected. RFID system fracture selection will influence the communication distance of a system, frequency interference with other radio frequency and speed of data to communicate with each other in the system. Table 2.1 shows the frequency range in RFID with each applications.
Table 2.1 : Frequency range in RFID with each applications.
Frequency Range Applications
Low-frequency 125 - 148 KHz
up to 3 inches Pet and ranch animal identification; car keylocks; factory data collection High-frequency
13.56 MHz
up to 3 feet library book identification;
clothing identification; smart cards Ultra-high frequency
433 MHz
up to 300 feet Defense applications w/ active tags
Ultra-high frequency 865 - 928 MHz
up to 36 feet Supply chain tracking:
Boxes, pallets, containers, trailers
2.5 Overview of Wireless Sensor Network
Wireless network refers to the technology to communicate and access the internet without cable connection between computers and other electronic devices. Sensor Network has contributed to several applications, and awareness has expended to implement the technology into the agriculture environment. WSN is one of the most important technologies in the 21st century [24]. WSN is an assembly of a number of low-power, low-cost, multipurpose sensor nodes communicating wireless upon a short distance.
19
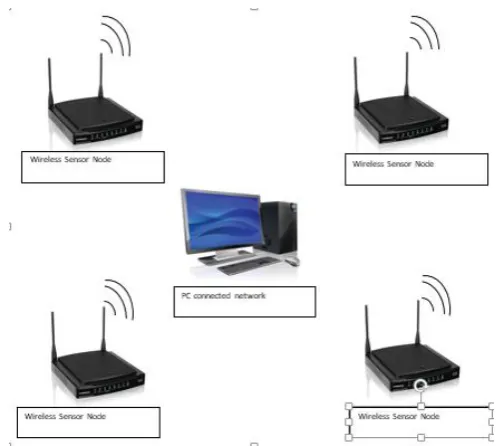
[image:32.595.211.461.129.352.2]development towards wireless outcomes in comparison to wired-based systems. Figure 2.10 shows the concept of wireless monitoring that is to be applied in the agriculture environment.
Figure 2.10 : The Concept of Wireless Monitoring Wireless Sensor Network
This systems provides a full network coverage in large facilities such as a big industries, typically massive lengths of cabling that leads to remarkable return on investment. WSN provides an intelligent platform to gather and collect data from the sensor nodes that can detect and interact with the physical environment [26].
[image:32.595.111.550.620.770.2]Using a wireless mesh as a backbone network simplifies installation and provides an affordable medium [27] WSN can be used to identify maturity to admit the irrigation system and identify where and when to irrigate. Table 2.2 show the different between RFID and WSN.
Table 2.2: Different between RFID and WSN (Hai liu et al, 2008)
RFID technology WSN
Purpose Detect presence and location of tagged objects
Sense interested parameters in environment and attach objects Component Tags, readers Sensor nodes, relay nodes, sinks Protocols RFID standards ZigBee, Wi-Fi
Communication Single hop Multihop
Mobility Tag move with attached objects Sensor nodes are usually static Programmability Usually closed systems Programmable
2.6 Overview of Wireless Mesh Sensor Network
The ZigBee platform over IEEE 802.15.4 is a protocol standard for short range wireless communication, while RFID technology uses RF technology for communication which is typically used for object identification and tracking system. In this proposed system a new design of RFID WMSN-based system adopted through ZigBee platform which upscales the active RFID system is developed to suite with the indoor application providing robust and efficient data delivery in industrial manufacturing environment. WMSN developed for this project is based on three main components function explained previously in chapter 2 which namely ZigBee end device or tag (ZED), ZigBee reader or coordinator (ZC) and ZigBee router (ZR). The function process of WMSN components comprise of a plurality of RFID tags, a plurality of transceiver to form a self-healing communication network, and a host computer deployed.
2.7 Overview of Zig Bee
21
[image:34.595.116.545.138.369.2]Zigbee supports three topologies, which are star, mesh and cluster-tree, as shown in Figure 2.11.
Figure 2.11 : ZigBee Topologies
Table 2.3: Comparison of The ZigBee, Bluetooth, Wi-Fi and UWB Protocols).
Standard ZigBee Bluetooth Wi-Fi UWB
IEEE standard 802.15.4 802.15.1 802.11a/b/g 802.15.3a Frequency band 868/915 MHz,
2.4GHz
2.4Ghz 2.4GHz, 5GHz 3.1-10.6 GHz
Max signal rate 250Kb/s 1Mb/s 54Mb/s 110Mb/s
Nominal range 10m -100m 10m 100m 10m
Nominal Tx Power (-25) – 0dBm 0 – 10dBm 15-20dBm -41.3 dBm/MHz Number of RF
channels
1/10; 16 79 14(2.4GHz) 1-15
Channel bandwidth 0.3/0.6MHz, 2Mhz
1MHz 22MHz
500MHz-7.5GHz Modulation type
BPSK(+ASK),O-QP SK
GFSK BPSK,QPSK,COFDM, CCK,M-QM
BPSK,QPSK
Spreading DSSS FHSS DSSS,CCK,OFDM
DS- UWB,MB-OFDM Coexistence mechanism Dynamic freq. selection Adaptive freq. hoping Dynamic freq. selection, Tx power control
Adaptive freq. hoping
Basic cell Star Piconet BSS Piconet
Extension of the basic cell
Cluster tree, mesh
Scatternet ESS Peer-to-peer
Max number of cell nodes
>6500 8 2007 8
Data protection 16bit CRC 16bit CRC 32bit CRC 32bit CRC
23
dimensions and reliability of the mesh networking architecture (Toscano and Bello, 2008).
2.8 Summary
Table 2.4 : Comparison of previous works for non-color based grading
Method
Researches Equipment Types of Fruits Descriptions A. Afhzan Near Infrared Reflectance
(NIR)
Mangoes Correlation between absorption of infrared and percentage of sucrose level
Taste Tsuta Near Infrared Reflectance (NIR)
Watermelon Sugar content of melons and sugar absorption
Xiaboo Near Infrared Reflectance (NIR)
Fuji Apple Using Multiple Linear Regression. Correlation between content of sugar and various wavelength NIR Smell Brezmes Electronic Nose Orange Used non-destructive instrument
A.h.Gomez.et Electronic Nose Tomato Used 10 different metal oxide sensors
Shape and Size Limimg & Yanchao Electronic Nose Strawberry Eliminate by normalizing the line sequence
60
REFERENCES
[1] A. Rocha, D. C. Hauagge, J. Wainer, and S. Goldenstein, “Automatic fruit and vegetable classification from images,” Comput. Electron. Agric., vol. 70, no. 1, pp. 96–104, 2010.
[2] A. M. Aibinu, M. J. E. Salami, A. A. Shafie, N. Hazali, and N. Termidzi, “Automatic Fruits Identification System Using Hybrid Technique,” in Proceedings of 6th IEEE International Symposium on Electronic Design, Test and Application, 2011, pp. 217–221.
[3] “MBG Yes! Fruits Survey Findings 2013,” 2013. [Online]. Available:
http://mbg.com.my/MBG/news-a-updates/1322-mbg-yes-fruits-surveyfindings-2013.html.
[4] A. Afhzan, A. Rahim, N. E. Abdullah, S. Lailatul, M. Hassan, and I. Shairah, “A Numerical Analysis of Correlation Between Sucrose Level Measurement and N ear-Infrared ( NIR ) for Various Grades of Watermelon,” pp. 180–185, 2013.
[5] G. Carlomagno, L. Capozzo, G. Attolico, and a. Distante, “Non-destructive grading of peaches by near-infrared spectrometry,” Infrared Phys. Technol., vol. 46, no. 1–2, pp. 23–29, Dec. 2004.
[6] S. Bureau, D. Ruiz, M. Reich, B. Gouble, D. Bertrand, J.-M. Audergon, and C. M. G. C. Renard, “Rapid and non-destructive analysis of apricot fruit quality using FT-near-infrared spectroscopy,” Food Chem., vol. 113, no. 4, pp. 1323–1328, Apr. 2009.
[7] Z. Schmilovitch, A. Mizrach, A. Hoffman, H. Egozi, and Y. Fuchs, “Determination of mango physiological indices by near-infrared
[8] Mizuki Tsuta, Junichi Sugiyamaand Yasuyuki Sagara (2002). Near-Infrared Imaging Spectroscopy Based on Sugar Absorption Band for Melons. J. Agric. Food Chem. 50 (1):48–52 Networks (SoftCOM), International Conference. IEEE. Split.11-13 September 2012. 1-5.
[9] Zou Xiaobo and Zhao Jiewen (2005). Apple quality assessment by fusion three sensors. IEEE Jurnal Sensors.Oct. 30 - Nov. 3. Irvine, CA: IEEE. 389- 392.
[10] Jesús Brezmes, Ma. Luisa López Fructuoso, Eduard Llobet, Xavier Vilanova, Inmaculada Recasens, Jorge Orts, Guillermo Saiz and Xavier Correig (2005). Evaluation of an Electronic Nose to Assess Fruit Ripeness. IEEE Jurnal Sensors. 5(1):97-108.
[11] A. H. Gómez, G. Hu, J. Wang, and A. G. Pereira, “Evaluation of tomato maturity by electronic nose,” Comput. Electron. Agric., vol. 54, no. 1, pp. 44–52, Oct. 2006.
[13] C. Di Natale, A. Macagnano, E. Martinelli, R. Paolesse, E. Proietti, and A. D’Amico, “The evaluation of quality of post-harvest oranges and apples by means of an electronic nose,” Sensors Actuators B Chem., vol. 78, no. 1–3, pp. 26–31, Aug. 2001.
[14] A. H. Gómez, J. Wang, G. Hu, and A. G. Pereira, “Electronic nose technique potential monitoring mandarin maturity,” Sensors Actuators B Chem., vol. 113, no. 1, pp. 347–353, Jan. 2006.
[15] Xu Liming and Zhao Yanchao (2010). Automated strawberry grading system based on image processing. Computers and Electronics in Agriculture.72:32– 39.
[16] C. L. Hsieh and M. H. Lee (2009). Applied Hyperspectral Image on
Detecting the Maturity, Weight, and Sugar Content of Tai-Farm No.2 Papaya. American Society of Agricultural and Biological Engineers. June 21 - June 24, 2009. Reno, Nevada: Curran Associates, Inc. 392-394.
62
[18] M.Z. Abdullah, J. Mohamad-Saleh, A.S. Fathinul-Syahir and B.M.N. Mohd- Azemi (2006). Discrimination and classification of fresh-cut starfruits (Averrhoa carambola L.) using automated machine vision system. Journal of Food Engineering. 76:506–523. 15
[19] Musa Bin Mohd Mokji (2009). Features Construction for Starfruit Quality Inspection. Ph.D. Thesis. Universiti Teknologi Malaysia.
[20] S.P. Kang, A.R. East and F.J. Trujillo (2008). Colour vision system evaluation of bicolour fruit: A case study with ‘B74’ mango. Postharvest Biology and Technology. 49:77–85.
[21] W. Md. Syahrir, A. Suryanti and C. Connsynn (2009). Colour Grading in Tomato Maturity Estimator using Image Processing Technique. 2nd IEEE International Conference on Computer Science and Information Technology (ICCSIT). August 08-August 11. Beijing, China: IEEE. 276 – 280.
[22] P. Properties, “E : Food Engineering and Physical Properties Application of Image Analysis,” vol. 69, no. 9, pp. 471–477, 2004.
[23] Shah Rizam M. S. B., Farah Yasmin A.R., Ahmad Ihsan M. Y. and Shazana K (2009). Non-destructive Watermelon Ripeness Determination Using Image Processing and Artificial Neural Network (ANN). International Journal of Computer Systems Science and Engineering. 4(6):391-395.
[24] Zukifli, C. Z. and Suparmin, S. 2015. Wireless Communication Network Tools Kits With Visualization Techniques: Design Consideration For Proposed Architecture. International Journal of Multimedia and Ubiquitous Engineering. 10(7): 375–386.
[25] Raed, M. T. A. 2012. Design And Implementation Of MultiHop Active RFID System With Embedded Wireless Sensor Network USM, Penang, Malaysia. [26] Abdullah, S., Ismail, W. and Zulkifli, C. Z. 2013. Integrating ZigBee-based
Mesh Network for Production Management Automation with Embedded Passive and Active RFID. Proceedings of 2013 IEEE RFID Technical & Applications Conference, Johor Bharu, 4-5 September 2013, Malaysia. [27] Zheng, J., and Jamalipour, A. 2009. Wireless Sensor Network: A Networking
Perspective. John Willey & Sons..
Applications (RFIDTA), 2013 IEEE International Conference. IEEE. Johor Bharu, Malaysia. 4-5 September 2013. 1–6. 2013. M2M Communication In Virtual Sensor Network For Shaal. Jurnal Teknologi. 65(1): 99–105. [29] Zigbee, A. 2015. The ZigBee Alliance. 2015. [Online]. Available:
http://www.zigbee.org/. [Accessed: 23-Aug- 2015].
[30] Abdulla, R. and Ismail, W. 2011. Extend active RFID with A ZigBee Network. Microwaves & RF. 50(2): 79.
[31] Baker, N. “ZigBee and Bluetooth: Strengths and weaknesses forindustrial applications,” IEE Computing & Control Engineering , vol. 16,no. 2, pp
![Figure 2.1 : The experimental setup for testing mango fruit using NIR [7]](https://thumb-us.123doks.com/thumbv2/123dok_us/8751991.892108/20.595.138.502.69.282/figure-experimental-setup-testing-mango-fruit-using-nir.webp)
![Figure 2.2 : The schematic diagram of the electronic nose to detect the mandarin [14]](https://thumb-us.123doks.com/thumbv2/123dok_us/8751991.892108/21.595.179.492.427.554/figure-schematic-diagram-electronic-nose-detect-mandarin.webp)