International Journal of Emerging Technology and Advanced Engineering
Website: www.ijetae.com (ISSN 2250-2459, ISO 9001:2008 Certified Journal, Volume 4, Issue 6, June 2014)
661
Selecting the Most Appropriate Method of Basin Sediment
Estimation by Sediment Rating Curves at Hydrometric Stations
(Case study: Atrak basin)
Mohammad R. Akbarzadeh
1, Abbas A. Ghezelsofloo
2, Mahboobeh Hajibigloo
3, Saeed R. Khodashenas
41PhD student of Water structures, Ferdowsi University of Mashhad, Iran 2Assistant professor of IAUM, Mashhad, Iran
3
Ms.c Watershed management, Yazd University, Yazd, Iran
4Associate Professor, Department of water Engineering, Ferdowsi University of Mashhad, Iran
Abstract— for stability and river basin management and preventing soil and sediment losses in river basins, as well as conducting catchments conservation plans, it is necessary to estimate suspended sediment content in rivers. In the present study, in order to select the best method of suspended sediment estimation at Barzoo, Baba Aman, Ghatlesh, Darband, Aghmazar, Tabarok Abad hydrometric stations located in Atrak river basin, corresponding data of flow and sediment discharges in the available statistical periods, were collected and analyzed. By creating a relationship between corresponding water and sediment discharges based on five linear, combined linear (multiline), linear with applied correction FAO, mean load within discharge classes and schematic method (tangent to maximum concentration line), we have selected an appropriate model which has the best predictability potential, based on the statistical indices. Therefore the index of root mean square error (RMSE), coefficient of determination (R2), mean estimated to observed data ratio (r), coefficient of variation (CV),ratio of the root mean square error to mean estimated data (GSD), the relation coefficient between estimated and observed sedimentation (R), mean absolute error (MEA), and mean bias error (MBE), were used. Results showed that the model of mean load within discharge classes at Tabarrok Abad station, linear model at Aghmazar and Barzoo stations, graphical models (maximum concentration) at Baba Aman and Ghatlesh stations, hybrid models (multiline) at Darband stations have the lowest mean square error and the best predictability in estimating sediment content among the tested models at the studied stations.
Keywords —Sediment Rating curves, hydrological techniques, statistical index.
I. INTRODUCTION
Erosion, sediment transport, sedimentation and water quality are among very important issues in the management of watersheds. These can be studied by conducting and developing estimation program for evaluating the transported sediment content at the rivers (e.g. [7]).
Several methods have been proposed for estimation of the suspended loads in rivers and various aspects of it have been discussed. Generally, river’s suspended load estimation methods are divided into two classes.
The first group is methods based on dynamic and fluid mechanic laws which are usually presented by hydraulic specialists and experts. The second group is a method based on direct measurements and statistical analysis which are rather suggested by hydrologists (e.g. [6]). The classification is performed by Preston and Bier man (1989) which seems more comprehensive. In this classification, three general divisions of hydrology can be observed, which include average ratio and regression estimators.
Regression estimators (rating curves) are in most cases applied logarithmically since appropriate distribution of the concentration and flow is a two-variation logarithmic distribution. The most common method of drawing sediment rating curve is fitting a line (or multiline) through the cloud of sediment discharge and flow discharge points which is called as single-line sediment rating curve.
Moreover, Johnson (1996), suggest that flow discharges with a given growth should be divided into some portions and for each classes' average discharge, mean sediment of the same class should be determined and sediment raving curve should be drawn using new data. This method is called rating curve of mean load within discharge classes.
Jones et.al (1981), have used parallel linear equation which passes through sedimentation points and their corresponding discharge points instead of using sediment rating power equation which passes through a point of
Logarithmic points’ average coordination of the water and sediment discharge. This method is brought up as FAO method which is practically computed as a coefficient and is applied to single-line sediment rating curve.
International Journal of Emerging Technology and Advanced Engineering
Website: www.ijetae.com (ISSN 2250-2459, ISO 9001:2008 Certified Journal, Volume 4, Issue 6, June 2014)
662
Johnson through a study concluded that due to broad variations and low frequency samples in high discharges, there is not any improvement possibility of sediment rating curve via its general method, i.e. Logarithmic method.
Therefore, in order to determine suspended sediment contents a method named rating curve of mean load within discharge classes was used (e.g. [4]). Sadeghi et.al (2010) recognized the existence of efficiency coefficient lower than 50% in studied model of Khamsan catchment as inefficiency of the rating curve for accurate and full estimation of the suspended loads. Having the knowledge that the most amount of sediment contents occurs on flood events, therefore measuring sediment contents on flood events is necessary. Results of Najafi Nezhad et.al (2010) investigations showed that power equations has the highest level of correlation among different types of sediment rating curve equations.
In the present study, we have attempted to draw sediment rating curve for each station using sedimentation and corresponding discharge statistics of 6 hydrometric stations in Atrak river and its tributaries, according to their entire data since establishment till now, based on 5 models including linear, combined linear, linear with applied FAO correction models, graphical method and mean load within discharge classes; then they were analyzed using statistical indices.
In the next step, suspended sediment load discharges of the selected stations were calculated using daily method and their daily discharge statistics, then monthly and annual results and annual suspended load's specific discharge is presented.
II. METHODS
Atrak basin is considered part of the Caspian Sea basin which its area in north Khorasan province is up to 14913.24 longitude range of 56° 01ˊ 32˝ to 56 ° 25ˊ 15˝ easts and latitude of 36°56ˊ 16˝ to 38 ° 14ˊ 42˝ north's. The length of the main river is 211 Km in Atrak catchment basin.
Existing rivers in Atrak catchment basin located in North Khorasan include: Cheri and Shahvordi rivers in Faruj city, Tensovan, Gholjogh, Ghorogh and Golul rivers in Shirvan city, Chenaran, Firozeh, Baba Aman, Besh Ghardash, Badaranlu, Ghezelgan, Khartoot, Sumbar and Chandir rivers in Bojnourd city, Shirin Dareh, Kale Imani, Kale Inche and Garmaab rivers in Mane and Semelghan city. Figure (1) shows the location of the area under study in Iran, North Khorasan province.
Figure1. Location of the area under study in Iran Northern Khorasan province
A. Selected hydraulic stations
In order to estimate the amount of selected station’s sedimentation we collected daily discharge and sediment sampling statistics. Considering that the studied area is a semiarid area, hence in the present study, we utilized QS -QW curve method with different approaches to analyze sedimentation statistics of under study hydrologic stations.
[image:2.612.325.563.244.417.2]International Journal of Emerging Technology and Advanced Engineering
Website: www.ijetae.com (ISSN 2250-2459, ISO 9001:2008 Certified Journal, Volume 4, Issue 6, June 2014)
[image:3.612.66.553.142.308.2]663
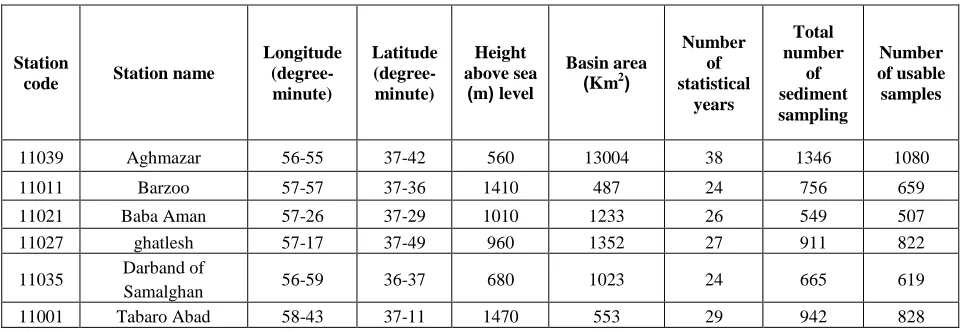
TABLE I
Characteristics and statistical time course of the selected hydrometric stations
Daily sediment estimation and sediment rating curve drawing were performed using different hydrologic methods (5 methods) all of which are based on sediment rating curve approach (e.g. [12]).
1-Unilinear rating curve: in this approach, sediment concentration or discharge and their corresponding flow rates are transferred to logarithmic scale coordination and the best fitting line using least square method are drawn through points. Hence, by using this method only one line is passed though the points regardless of the point distribution (e.g. [19]).
2-passing more than one line through the points(multiple line rating curve), if data circumstances and point cloud distribution in sediment rating curve allow, instead off one line, multiple lines can be passed through the point cloud.
Therefore, in this case, there would be more than one equation for sediment rating curve (e.g. [20]).
3-median limit of the classes: in this method, rates with given growth are divided into some classes and for mean recharge of every classes, mean estimated sediment discharge of the same class is determined, them a rating curve is obtained using mean discharge of every class and mean sediment corresponding to the same class (e.g. [2]).
4- FAO adjustment factor method: In this method which Jones, Berney, et al. (1981) have described it, at first the best line by equation of the relation (1) are fitted by least square method in a logarithmic scale (not the real scale),
Then, the above equation scale which passes through averages points of Log Qw and Log Qs is not utilized and instead of it, a line equation parallel to it which passes through averages of the corresponding Qs and Qw, the rating curve is drawn. The new equation is as follows:
(1)
In which the amount of a' is obtained from dividing average of measured corresponding Qs and Qw (a' is replaced for a).
5- Graphical method (max. concentration): in this method, an S-shaped curve is fitted through points somehow that the end of the considered curve passes asymptotic to double maximum concentration line or concentration of the maximum volumetric passage.
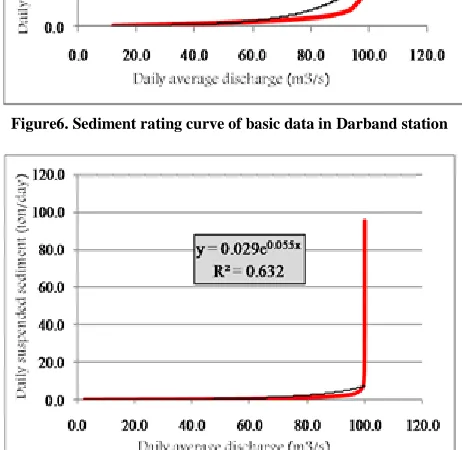
The data sets of corresponding flow rate and sediment discharge for every station in the available statistical period are investigated and sediment rating curve for discharge data corresponding to suspended sediments for every station is presented in the following figures:
Figure2.Sediment rating curve of basic data in Aghmazar station
Station
code Station name
Longitude (degree-minute)
Latitude (degree-minute)
Height above sea
level ( m )
Basin area ( Km2 )
Number of statistical
years
Total number
of sediment sampling
Number of usable samples
11039 Aghmazar 56-55 37-42 560 13004 38 1346 1080
11011 Barzoo 57-57 37-36 1410 487 24 756 659
11021 Baba Aman 57-26 37-29 1010 1233 26 549 507
11027 ghatlesh 57-17 37-49 960 1352 27 911 822
11035 Darband of
Samalghan 56-59 36-37 680 1023 24 665 619
International Journal of Emerging Technology and Advanced Engineering
Website: www.ijetae.com (ISSN 2250-2459, ISO 9001:2008 Certified Journal, Volume 4, Issue 6, June 2014)
664
Figure3. Sediment rating curve of basic data in Barzoo station
[image:4.612.329.560.234.459.2]Figure4. Sediment rating curve of basic data in Baba aman station
Figure 5. Sediment rating curve of basic data in Ghatlesh station
Figure6. Sediment rating curve of basic data in Darband station
Figure7. Sediment rating curve of basic data in Tabarrok Abaad station
B. Selecting the hydrologic method of estimating the river’s suspended sediment load
In the hydrologic method at first in sediment rating stations, suspended sediment load (c) in gram per liter and its corresponding volume passage (Qw) in cubic meter per second during a long census period is measured and suspended load (Qs) is calculated using equation 2, Uncommon autoregressive pattern in p order: PACF in 1, 2... p delays have peak and after the p delay cute and ACF are descending.
(2)
International Journal of Emerging Technology and Advanced Engineering
Website: www.ijetae.com (ISSN 2250-2459, ISO 9001:2008 Certified Journal, Volume 4, Issue 6, June 2014)
665
Therefore, the corresponding sediment and recharge statistics during the years existing were used. After determining sedimentation equation using different methods, by comparing statistical parameters, such as root mean square error (RMSE), factor of rectification, mean estimated to observed data ratio (r), coefficient of variation (CV), root mean square error to mean estimated data (GSD) ratio, correlation coefficient between estimated and observed (R) sediments, mean absolute error (MAE) and mean deviation error (MBE), the best equation were selected and sediment of the stations were estimated according to the selected approach (e.g. [12]). Applied equations for every statistical index are as follows (e.g. [5]).
(3)
In which n is data number, Y actual is the observed volume of sediments and y forecast is the estimated volume of sediments.
In this equation, Qsi is the estimated sediment discharge, Qs mean estimated sediment, Qwi is water discharge and Qw is mean inflow.
In which Stdev is estimated sediment deviation and X is mean estimated sediment.
In which Yactual is observed sediment amount and Yforecast is estimated sediment amount.
In which RMSE is root mean squared error and Y forecast is mean estimated sediments.
III. DISCUSSION AND RESULTS
Robustness index values (estimated sediment load to basic sediment load ratio) and precision index (estimating variation coefficient) of deferent methods in the selected stations are presented in table 2.
By fitting sediment rating curve equations, based on studied models among corresponding recharge data and sediment discharge in studied stations, calculated statistical index values for every model is represented in table 2.
According to table 2, the model which has a least RMSE, most R2 and least GSD has the best predictability.
Therefore, this model was determined as the most suitable model for estimating suspended sediment among investigated models.
Estimation of the suspended sediments of every studied station is based on the selected model.
(5)
(6)
International Journal of Emerging Technology and Advanced Engineering
Website: www.ijetae.com (ISSN 2250-2459, ISO 9001:2008 Certified Journal, Volume 4, Issue 6, June 2014)
[image:6.612.50.569.144.489.2]666
TABLE II
Results of the statistical index calculations of suspended sediment discharge in the stations
Station
name Model name R
2
r R RMSE CV GSD MAE MBE
Tabarrok Abaad
Uniline fitting
Uniline fitting with FAO adjustment Multi fitting(multi linear) Graphical method(maximum concentration)
Mean Load within discharge classes
0.68 1.00 0.67 0.76 0.89 0.22 9.34 4.81 1.65 0.38 0.793 0.793 0.823 0.816 0.825 18698 331434 236716 23567 13671 17.03 17.03 24.15 16.18 13.11 38.73 15.89 22.05 15.92 6.39 1769 18626 9137 1704 1431 -1750 18621 8501 1453 -1375 Barzoo Uniline fitting
Uniline fitting with FAO adjustment Multi fitting(multi linear) Graphical method(maximum concentration)
Mean Load within discharge classes
0.90 1.00 0.84 0.84 0.87 0.87 17.66 2.44 3.32 1.57 0.926 0.911 0.911 0.920 0.911 85 127 113 289 334 6.51 7.85 7.77 8.55 7.96 0.01 4.96 0.30 0.06 0.06 3848 111555 12695 16008 7263 -862 114893 9657 15509 3838 Baba Amaan Uniline fitting
Uniline fitting with FAO adjustment Multi fitting(multi linear) Graphical method(maximum concentration)
Mean Load within discharge classes
0.45 1.00 0.46 0.48 0.41 0.14 5.72 5.22 1.52 0.32 0.837 0.837 0.870 0.872 0.837 4884 183004 364111 23442 39752 18.79 10.02 11.17 9.66 10.61 82.95 7.52 16.41 3.63 29.51 3726 20062 19064 2871 3261 -3658 20062 17936 2220 -2901 Ghatlesh Uniline fitting
Uniline fitting with FAO adjustment Multi fitting(multi linear) Graphical method(maximum concentration)
Mean Load within discharge classes
0.85 1.00 0.85 0.89 0.88 0.23 35.09 2.52 2.16 4.08 0.911 0.911 0.912 0.914 0/911 3442051 179877 170583 158989 347090 8.53 8.53 8.56 7.88 8.60 6.42 8.42 6.62 5.91 7.42 396905 19078 19245 16924 37120 396845 15720 17391 13300 35343 Darband Uniline fitting
Uniline fitting with FAO adjustment Multi fitting(multi linear) Graphical method(maximum concentration)
Mean Load within discharge classes
0.77 1.00 0.85 0.76 0.81 0.34 2.28 0.75 2.66 0.47 0.886 0.886 0.917 0.917 0.886 7384 6929 6485 9327 7551 4.93 4.91 3.25 4.99 3.31 21.19 7.98 2.81 3.25 14.5 753 1817 747 1976 783 -711 1381 -267 1794 -572 Aghmazar Uniline fitting
Uniline fitting with FAO adjustment Multi fitting(multi linear) Graphical method(maximum concentration)
Mean Load within discharge classes
0.92 1.00 0.76 0.79 0.83 0.87 4.04 2.45 1.39 0.85 0.978 0.916 0.945 0.948 0.916 51794 532394 466843 122131 6473 6.15 6.15 9.01 6.15 6.35 2.52 5.23 7.55 3.48 2.92 12360 79741 48863 19965 12609 -10104 76580 36631 9857 -3020
As you have noted in table 2, sediment estimation results at the studied stations is calculated by different methods of line fitting in sediment rating curve based on the overall concurrent flow recharge and sediment discharge data.
Different statistical indices using estimated sediment and observed sediment were calculated. Final selections of the estimated sediment at the stations were determined based on the investigations of the statistical indices' results. At Tabarok Abad station, the method of median limit of the classes, at Barzo station, linear method, at Baba Aman and Ghatlesh stations, graphical method (maximum concentration), at Darband station of Semelghan, combined method and at Aghmazar station, linear method were selected in order to calculate the suspended sediments.
International Journal of Emerging Technology and Advanced Engineering
Website: www.ijetae.com (ISSN 2250-2459, ISO 9001:2008 Certified Journal, Volume 4, Issue 6, June 2014)
667
Figure8. Variations of the suspended sediment specific load in the studied stations
International Journal of Emerging Technology and Advanced Engineering
Website: www.ijetae.com (ISSN 2250-2459, ISO 9001:2008 Certified Journal, Volume 4, Issue 6, June 2014)
[image:8.612.26.591.142.591.2]668
TABLE III
Results of the monthly estimated suspended sediment load based on the selected hydrologic method in the stations
Results of the sediment estimation at the studied stations were obtained by different methods of line fitting in sediment rating curve based on the entire concurrent data of flow rate and sediment discharge. A summary of the final monthly suspended load results at the studied stations are represented in table 3.
As it is indicated in the table, maximum and minimum suspended sediment frequency percentage in the stations of plan region at the statistical period under investigation are relevant to 21 April-21 May and 22 December-20 Jan respectively. Sediment rating curve of every selected hydrologic method at the studied stations are represented in figure 10. st a ti o n n a me st a ti st ic a l p a ra m et er S ep 2 3 - Oct 2 2 Oct 2 3 - N o v 2 1 N o v 2 2 - D ec 2 1 D ec 2 2 - J a n 2 0 J a n 2 1 - Fe b 1 9 Fe b 2 0 - M a rc h 2 0 Oct 2 3 - N o v 2 1 A p ri l 2 1 - M a y 21 M a y 2 2 - J u n e 2 1 J u n e 2 2 - J u ly 2 2 J u ly 2 3 - A u g 2 2 A u g 2 3 - S ep 2 2 B a rz o o average Max. Min. Deviation Coefficient of variations
Monthly percentage 868 3449 20 1064 1.23 0.6 834 7750 42 1650 1.98 0.6 714 2365 120 645 0.9 0.5 712 4212 101 1052 1.48 0.5 1016 2748 184 710 0.7 0.7 13634 70204 234 20306 1.49 10.0 15045 64323 1273 15757 1.05 11.1 19433 127019 152 32005 1.65 14.3 41913 302590 18 93550 2.23 30.9 30523 351802 17 90654 2.97 22.5 9411 95095 12 22269 2.37 6.9 1843 25497 8 5503 2.99 1.4 T a rr o k A b a d average Max. Min. Deviation Coefficient of veriations
Monthly percentage 186 1427 0 267 1.44 0.1 359 2964 41 626 1.74 0.2 233 646 81 134 0.57 0.1 220 613 77 113 0.52 0.1 132869 4896135 102 804830 6.06 64.3 2086 55385 115 9062 4.35 1.0 6392 166251 167 27130 4.24 3.1 61551 1344134 0 27333 3.69 29.8 2077 23112 46 4610 2.22 1.0 386 7895 0 127 3.31 0.2 155 738 0 171 1.11 0.1 190 1392 0 282 1.48 0.1 A g h m a za
r average Max.
Min. Deviation Coefficient of veriations
Monthly percentage 34248 49653 10 99847 2.92 0.4 241183 517115 2850 101588 4.21 3.1 37401 264377 1696 54926 1.47 0.5 2259 7196 1913 2165 0.96 0.3 35828 13776 1833 44067 1.23 0.5 1036796 1133644 1748 2769510 2.67 13.5 1158449 1376622 3026 2905614 2.51 15.0 2744123 4697739 27 9490382 3.46 35.6 991421 1956569 14 3884454 3.88 12.9 160366 2496320 3 527729 3.29 2.1 847386 1289355 81 2597597 3.07 11.0 391648 661255 27 139924 2 3.57 5.1 Gh a tl esh average Max. Min. Deviation Coefficient of veriations
Monthly percentage 1304 20292 71 3834 2.94 0.2 11495 366598 37 62748 5.46 1.5 1505 18760 25 3187 2.12 0.2 1761 3107 51 5285 3.0 0.2 3784 37094 72 8171 2.16 0.5 84108 159992 32 25137 3.39 10.9 37534 277675 40 59986 1.60 4.9 267301 7172428 48 126913 4.59 34.8 28791 264735 3 60742 2.11 3.7 49865 1222096 7 211871 4.25 6.5 246560 7371638 11 1264223 5.13 32.1 34414 656018 10 135256 3.93 4.5 D a rb a n d o f S a m a lg h a
n average Max.
Min. Deviation Coefficient of veriations
Monthly percentage 562 4399 74 35 1.49 0.1 826 6251 75 1105 1.34 0.2 4415 71537 70 14719 3.33 1.1 1013 1208 89 2064 2.04 0.3 789 2387 124 553 0.70 0.2 8624 55905 122 17195 1.99 2.2 59661 785442 404 153646 2.58 15.4 20549 194288 101 47341 2.30 5.3 35707 774212 84 13820 3.89 9.2 545 7026 64 1243 2.28 0.1 201344 6319194 22 1116534 5.55 52.1 52239 975628 37 207981 3.98 13.5 B a b a A m a n average Max. Min. Deviation Coefficient of veriations
International Journal of Emerging Technology and Advanced Engineering
Website: www.ijetae.com (ISSN 2250-2459, ISO 9001:2008 Certified Journal, Volume 4, Issue 6, June 2014)
[image:9.612.64.552.113.653.2]669
Figure 10. Sediment rating curve of the selected models in the studied stations
Combined Method (Multi linear) Linear method
Linear method
Graphical - Maximum concentration Method
Mean load withing discharge classes
International Journal of Emerging Technology and Advanced Engineering
Website: www.ijetae.com (ISSN 2250-2459, ISO 9001:2008 Certified Journal, Volume 4, Issue 6, June 2014)
670
IV. CONCLUSION
In order to gain the regional relations of the rivers' suspended sediment load discharge in the study area, results obtained from specific sedimentation of suspended load in selected hydrometric stations on Atrak river were utilized along with establishing correlation with watershed area and its specific seepage. Therefore, two methods were used. In the first method, the considered relation is an exponential relation with correlation coefficient of 0.8991 and a confidence level of more than 99 percent is acceptable. Specific suspended sediment correlation equation with area is as follows:
Y= 363.78 e 5E-0.5X R=0.986 (8)
In this relation, X is watershed area in Km2, Y is specific suspended load in ton/year/Km2 and R is correlation coefficient.
In the second approach, another two-variable correlation between specific suspended sediment discharge and specific discharge and watershed area of study stations were created that the obtained correlation equation is as follows:
Y= 256.5+ (39.1X1) + (0.0430X2) R=0.986 (9)
In this relation, X1 is specific discharge in lit/s/Km2, X2 is watershed area in Km2, Y is specific sediment load in ton/year/Km2 and R is correlation coefficient.
The first approach based on the obtained correlation coefficient is more suitable. according to this relation, special discharge load extent of the suspended sediments in the studied stations, Tabarok Abad, Barzoo, Baba Aman, Ghatlesh, Darband, Aghmazar stations are 373.8, 279, 597.1, 568.4, 377.6 and 592.2 tons/year.Km2 respectively.
According to the above results, we can observe that the average class method, usually fitted method among water and sediment discharge underestimates sediment loads in compare with true values, and this problem is due to low frequency observations in flood time and vice versa high frequency observations of sediment discharge in low discharge period is high. Therefore low discharge is overestimated in fitting the curve to total resultant statistical formula and problem occurs while estimating high discharges. To find a solution for this problem in the present study factor of adjustment or two methods of average limit of classes and linear method were utilized.
Highest mean square error in the rating curves are related to a model in which sediment discharge is estimated regardless of discharge measuring time or flow discharge classification and this result is in line with Mosaedi (1998), Tarkhurani(2001), Mohamadi ostad Kelaleh (2002), piri (2003) and Mosaedi et. al (2005).
V. RECOMMENDATIONS
According to the results obtained in previous studies, estimated error of sediment rating curves are not similar from one basin to another. The obtained results from these investigations are not generalizable to other areas. Hence, it is recommended that the investigations be performed in other regions and if having efficiency and high effectiveness might be implicated as basic method of hydrologic investigations.
In average 51% of frequency distribution of sediments of the basin under study is relevant to three month of the spring and 27% of it is related to summer floods in 23 July-22 August and 23 August-July-22 September. So concurrence implementation of the watershed and basin management in the mentioned area is suggested.
REFERENCES
[1] Alizadeh, A. 1997. Applied Principles of Hydrology, Tehran University, Iran, 2(2), 62pp
[2] Arabkhedri, M. 2005. A study on the suspended sediment yield in river basins of Iran. Iran-Water Resources Research. 1 :2.101-103 [3] Azami, A., Najafinejad, A., and Arabkhedri, M. 2005. Evaluation of
hydrological models for estimating of suspended sediment in base flow and flood stages in Ilam dam watershed. Proceeding of 3'd National Conference of Erosion and Sedimentation. Tehran, Iran. Pp: 486-490.
[4] Crawford, C.G. 1991. Estimation of suspended and sediment ratings curves and mean suspended sediment loads, Journal of Hydrology, 129:331-398.
[5] Heydarnejad, M., Golmaee, S.H., Mosaedi, A., and Ziatabar Ahmadi, M. 2007. Improvement sediment transport formula and estimation of suspended sediment for Tale Zang hydrometric station. Proceedings of the 7th international river engineering conference. Shahid Chamran University. Ahvaz, Iran.
[6] Hicks, D.M., Gomez B., and Trustrum, N.A. 2000. Erosion Thresholds and Suspended Sediment Yields, Waipaoa River Basin, New Zealand, Water Resources Research 36(4), 1129-1142. [7] Jansson, M.B. 1996. Estimating a sediment rating curves of the
Reventzon river at Palomo using logged mean loads within discharge classes, Journal of Hydrology, 183(4):227-241.
[8] Jones, K.R., Berney, O., Carr, D.P., and Barret, E.C. 1981. Arid zone hydrology for agricultural development, FAO Irrigation and Drainage Paper, 37: 271.
[9] Lenzi, M.A., Mao, L., and Comiti, F. 2003. Inter annual variation of suspended sediment load and sediment yield in an alpine catchment. Hydrological Sciences Journal, 48(6), 899-915.
[10] Miraboulghasemi, H., and Morid, S. 1997. Investigation of hydrological methods for estimating suspended load of rivers, Journal of Water and Development, 35: 95-116.
[11] Mosaedi, A. 1998. Hydrological sizing of sedimentation reservoir system for irrigation and water supply, Ph. D. Thesis, Technical university of Budapest, Hungary, 101p
International Journal of Emerging Technology and Advanced Engineering
Website: www.ijetae.com (ISSN 2250-2459, ISO 9001:2008 Certified Journal, Volume 4, Issue 6, June 2014)
671
[13] Mohammadi ostad kalaye, A. 2002. Optimization the relationship between water discharge and suspended sediment load in river stations Gorganroud, Thesis of M.S. Gorgan university, watershed management Dep., 120 pp
[14] Olive, L.J., and Reiger, W.A. 1992. Stream Suspended Sediment Transport Monitoring – Why, How and What IS Being Measured? IAHS Public, No: 210.
[15] Piri, A., Habib nezhad, M., Ahmadi, M., Soleimani, K., and Mosaed, A.i,. 2005. Optimizing the relationship between water discharge and sediment load in the watershed represents Amameh, Journal of Agricultural Sciences and Natural Resources of the Caspian, Mazandaran Univesity, 3(3), 40
[16] Preston, S.V., Bierman, J., and Silliman, S.E. 1989. An evaluation of methods for the Estimation of tributary mass loads, Water Resources Research. 25, (6):1379-1390.
[17] Sadeghi, S.H. 2010. Development of sediment rating curve equations for rising and falling limbs of hydro graph using regression concept. Iran-Water Resources Research. 1: 1.101-103.
[18] Shafaee bajestan, M. 2004. Hydraulic deposition, Shahid Chamran University, 3: 470 pp
[19] Sobhani, H., Malekian, A. 2011. Effect on the accuracy of Classification models to estimate suspended sediment in Hablehrud basin, 4th International Conference on Water Resources Management, Tehran University
[20] Tarkhorani, H. 2001. Optimizing the relationship between water And sediment discharges in Lighvan basin, Thesis of M.S. Gorgan University, watershed management Dep., 86 pp.
[21] Waling, D.E. 1977. Assessing the accuracy of suspended sediment rating curves for a small basin, Water Resources Research, 13: 531-538
[22] Walling D.E, Webb, B.W. 1981. The reliability of suspended sediment load data, Erosion and Sediment Transport Measurement, IAHS Pub. 133:177-194.