International Journal of Emerging Technology and Advanced Engineering
Website: www.ijetae.com (ISSN 2250-2459,ISO 9001:2008 Certified Journal, Volume 5, Issue 5, May 2015)
43
Text-Dependent Speaker Verification System Using Neural
Network.
S. O. Kassim
1, Ejike. C. Anene
2 1Department of Electrical/Electronic Engineering Technology, Federal Polytechnic Damaturu, Yobe State. 2Department of Electrical/Electronic Engineering Technology, Abubakar Tafawa Balewa University, Bauchi.
Abstract-This paper presents the use of back propagation neural network to implement voice recognition. The focus is to identify voice patterns of different people so as to recognize their voices electronically. The signals corresponding to a text phrase of a group of people are recorded in voice files on a computer using sound recording software. The information in these files is converted from time domain to frequency domain using digital signal processing techniques. The resulting preprocessed signal samples in frequency domain are then used to train a neural network to identify them from among other voice samples.
Keywords-- Back-propagation, feature extraction, feed-forward neural network, FFT, similarity analysis, spectral density.
I. INTRODUCTION
Voice recognition and processing has received a lot of attention during the last few decades. This technique makes it possible to use a speaker's voice signal to verify his identity and control access to services such as voice dialing, banking by telephone, telephone shopping, database access services, information services, voice mail, security control for confidential information areas, and remote access to computers [1].
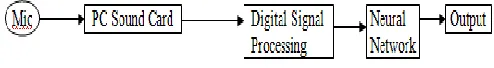
[image:1.612.48.295.575.609.2]The applications of voice recognition are markedly different from those of speech recognition. Most commonly, voice recognition technology is used to verify a speaker’s identity or determine an unknown speaker’s identity. Speaker verification and speaker identification are both common types of voice recognition. Figure 1 below shows the block diagram of a typical voice recognition system.
Figure 1: Block diagram of a typical voice recognition system.
Voice verification is the process of analyzing an individual’s voice pattern with the aim of confirming the identity of the speaker. This process requires an existing sample of the individual’s voice to be present in the software database record. Once a sample of the voice is recorded, the person’s voice patterns are tested against a database to see if the voice matches their claimed identity.
This form of identification is most commonly used in situations where secure authorized access is required.
Speaker recognition methods can be divided into text-dependent and text-intext-dependent methods. The former require the speaker to say key words or sentences having the same text for both training and recognition trials. Whereas the latter do not rely on a specific text being spoken, i.e. it is not necessarily that the same training text will be required for the recognition session [2]. Both systems perform the following tasks: "feature extraction", similarity analysis and selection (pattern matching). Voice recognition systems depend on several different factors that can influence the accuracy of the utterance, this includes: the environment, the speaking rate of the speaker, the context used in recognition (grammar). The voice signal carries information about the speaker's identity, his language, his physical and emotional state, and his geography and societal background [3].
International Journal of Emerging Technology and Advanced Engineering
Website: www.ijetae.com (ISSN 2250-2459,ISO 9001:2008 Certified Journal, Volume 5, Issue 5, May 2015)
44
The basic problem with Speech/Voice recognition is identification of proper features for the recognition task, and the strategy to extract these features from the signal [8]. Feature extraction involves analysis of signal. Broadly, feature extraction techniques are classified as temporal analysis and spectral analysis technique. In temporal analysis the waveform itself is used for analysis, while in spectral analysis, spectral representation of the signal is used for analysis. Pre-processing using Speech Filling System to extract the feature in a collected speech data for use in the testing and training of the input of a back propagation neural network was described by [9]. The speech features are extracted through frequency-energy interpretations (using fast Fourier transform algorithm) and power spectral densities of the signals. Their absolute values were used to train the ANN for the pattern matching (recognition) process.
In this work a voice recognition system for speaker verification, using text-dependent speaker recognition method is researched. The goal is to identify someone using his voice patterns. The process entails recording, spectrum analysis and Fourier analysis. The test users shall utter the same test word or phrase for identification purposes.
The paper is organized as follows: section I presents the introduction and review of similar works. Section II outlines the methods employed in the speaker verification process. Section III gives the system design requirements and implementation. Results obtained are presented and discussed in section IV. Conclusion on the work done, problems and recommendation for future expansion and/ improvement are presented in the remaining section.
II. METHODOLOGY
A. Voice Recognition System Architecture
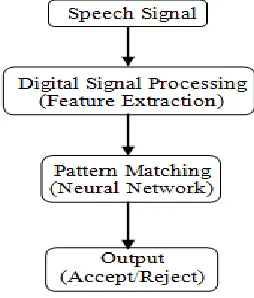
The voice recognition system consists of a sound recording device (PC microphone and recording software), a digital signal processing stage (feature extraction) and the pattern matching using the Neural Network (for the verification) and finally the required output (verification accepted or rejected). Figure 2 below shows the different components for the voice recognition process.
The first block consists of the acoustic environment plus the transduction equipment (PC microphone). The voice signals which corresponds to a text word (TRAIN) of a group of four (4) people are recorded using the PC microphone, and are stored as sound files on the PC memory. The information in the voice files are converted from the time domain to the frequency domain using appropriate digital signal processing techniques.
[image:2.612.369.496.199.348.2]The frequency spectra of the speech signals are used for the training of the Neural Network. The output of the Neural Network is the identity of the speaker (accept/reject) when tested with trained or untrained samples.
Figure 2: Components for Voice Recognition process.
B. Feature Extraction
The speech features (Fourier transform values of the sampled voice signals) are presented to the neural network inputs and will be verified or recognized at the output of the network. Before extraction of features from the recorded voice samples, they are first checked to ensure that the recorded samples can enhance the results anticipated at the end of the work, that is, the system should be able to recognize any voice trained with the ANN. This is done by carrying out a similarity test on the voice samples using the Sound Forge 9.0 computer program for the spectrum analysis of the voice samples
C. Pattern Matching Using Neural Network
International Journal of Emerging Technology and Advanced Engineering
Website: www.ijetae.com (ISSN 2250-2459,ISO 9001:2008 Certified Journal, Volume 5, Issue 5, May 2015)
45
III. SYSTEM REQUIREMENTS
The voice recognition test requires a personal computer with an inbuilt system microphone for capturing the sound signals needed. Record pad sound recorder and sound forge 9.0 were installed for recording the sound signals captured and for processing it respectively. The sound forge 9.0 program provides an avenue for direct spectral analysis, which is used to carry out similarity check on the voice signals.
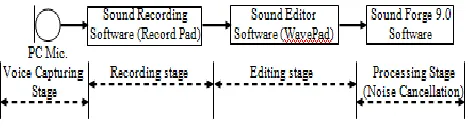
A. Voice Capturing and Processing
In-built microphone in a personal computer (PC, laptop) was used for the capturing of the voice signals through the record pad sound recording software, and was edited using the wave pad sound editor software. Figure 3 describes the voice data capturing, recording, editing and processing sequence. These voice signals are saved in the PC system as sound file. A fixed time of recording is established to have homogeneity in the signals.
Seven voice samples are used for the voice recognition system. These are obtained from four speakers with each uttering the same word (TRAIN) at two different time periods for the first three speakers and once for the last speaker. The voice signals are digitized at 8 KHz sampling frequency, yielding a signal with 8192 sample points after pre-processing.
B. Similarity Analysis
[image:3.612.53.287.363.427.2]Voice signals when viewed from their resulting speech wave tends to look alike; the need to check these similarities arises to ensure their suitability when used for voice recognition. The Sound Forge 9.0 computer program was used for checking the correlation between the recorded voice data. This was done by generating the corresponding spectrum analysis of the signal. These spectrums clearly show the differences that lie within each of the voice signals. Figure 4 below show the spectrum analysis of one speaker uttering the word "TRAIN".
Figure 4: Spectrum Analysis of a Speaker uttering the word "TRAIN".
C. Feature Extraction
The extraction of voice features for the input of a neural network plays a very vital role in the speaker verification system. Human speech can sensibly be interpreted using frequency energy interpretation such as a spectrogram. Frequency-energy interpretations and power spectral densities can be used to differentiate between the speakers. In this work, frequency-energy interpretations are used for the extraction of the features in the speech signal. This was achieved by determining the Fourier transforms (1) of the seven voice samples and are represented in this work as E1,
E2,….,E7.
The discrete Fourier Transform (DFT) obtained from MATLAB fft function shows the spectral peaks present in the voice samples. The absolute value of Fourier transforms of the voice samples were computed to determine the unique features attributed to an individual voice. These are presented to the pattern matching network (Neural Network) for the verification required.
The MATLAB commands used for this computation are:
>> x = data; representing the recorded voice sample >> fs = 8000; sampling frequency
>> N = fs;specifies the signal length
>> NFFT = 2^nextpow2 (N); next power of 2 from length of
signal
>> X = fft (x, NFFT)/N;Discrete Fourier Transform of the vector x
>> plot (abs(X)); plot the absolute value of DFT.
>> title ('DFT Computation (AbsoluteValue)'); plot title >> xlabel ('Frequency (Hz)'); x-axis labeling
International Journal of Emerging Technology and Advanced Engineering
Website: www.ijetae.com (ISSN 2250-2459,ISO 9001:2008 Certified Journal, Volume 5, Issue 5, May 2015)
46
[image:4.612.48.296.175.349.2]Figures 5 below shows one of the resulting plots of the absolute value of DFT Computations for the voice signal in figure 4 above.
Figure 5: DFT plot (absolute values) for the signal in figure 4.
D. Network Model and Parameters
[image:4.612.323.565.376.631.2]A three layer ( perceptron) feed-forward NN was used for the verification processes. This consists of an input layer, hidden layers and an output layer of neurons as shown in figure 6.
Figure 6: Model of NN network
The hidden layer is one; it is well-known that NN with one or two hidden layers can realize any continuous vector-valued functions, [11]. For training multilayer feed-forward networks, any standard numerical optimization algorithm can be used to optimize the performance function; here the resilient back-propagation algorithm was employed. Through iterations and modifications, the average square errors of the test data are used to determine the optimal weights and biases. To enhance optimal results, the training criteria and network parameters setting for this work was chosen as given below.
Number of hidden neurons: 20 Number of hidden layer: 1 Number of training samples: 5734 Number of validation samples: 1229 Number of testing samples: 1229 Performance Goal: 0.00
Performance: Mean Squared Error (MSE) Transfer function: TANSIG
Learning rate (
(
) : set at 0.0001E. Networks for NN Voice Recognition Training
The networks used for the training process of the NN were created for the seven recorded voice signal samples. Samples E1and E2 from speaker 1; E3 and E4 from speaker
2; E5 and E6 from speaker 3; and E7 from speaker 4
respectively The different voice samples were recorded at different times. This is to investigate the uniformity of their voice with respect to time periods. For the purposes of this paper three networks denoted by E1-1, E1-2, E1-3, were
trained for target voice samples E2, E4 and E6 respectively.
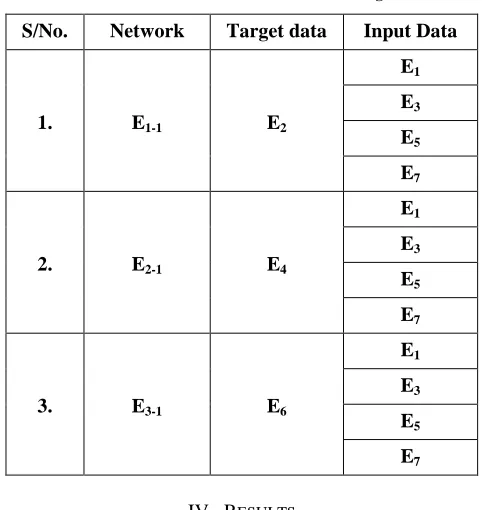
Table 1 lists the networks, their associated target or actual data and the input data presented to it for discrimination and recognition. The objective is to capture the response of the network to inputs different from the target data so as to verify its recognition status.
Table 1:
Networks Created for NN Voice Training
S/No. Network Target data Input Data
1. E1-1 E2
E1
E3
E5
E7
2. E2-1 E4
E1
E3
E5
E7
3. E3-1 E6
E1
E3
E5
E7
IV. RESULTS
A. Similarity Analysis
[image:4.612.53.282.438.517.2]International Journal of Emerging Technology and Advanced Engineering
Website: www.ijetae.com (ISSN 2250-2459,ISO 9001:2008 Certified Journal, Volume 5, Issue 5, May 2015)
47
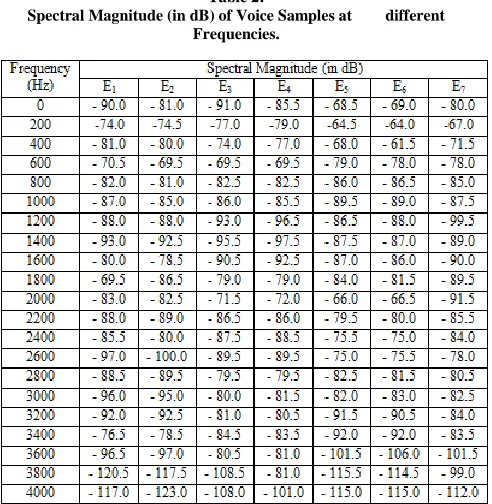
While the spectral magnitudes for the same speakers in most cases are closely related, verifying that the signals are actually from the same speaker.
The networks are thus expected to be able to distinguish between different speakers since their voice spectra are distinguishable. Therefore any network presented with any two voice samples at a time should yield an output signifying a rejection or acceptance in a properly trained network.
B. Training Results
[image:5.612.50.296.329.581.2]The results obtained from the networks’ training are summarized in Table 3 below. The mean square errors (MSE) and the regression coefficients for the training, testing and validation data are given in the table, so also are the overall regression coefficients for trainings included.
Table 2:
Spectral Magnitude (in dB) of Voice Samples at different Frequencies.
C. Network Performance
The regression analysis in Table 3 show a high degree of recognition of output data by networks which had been trained on it while rejecting other inputs that were not trained on it. This is shown by the regression data of the networks E1-1, E2-1, E3-1 each tested and validated with a set
of four input voice data samples E1, E3, E5 and E7 to get the
MSE and Regression outputs. Note that E1 and E2; E3 and
E4; and E5 and E6 are from the same speakers. Results show
International Journal of Emerging Technology and Advanced Engineering
Website: www.ijetae.com (ISSN 2250-2459,ISO 9001:2008 Certified Journal, Volume 5, Issue 5, May 2015)
[image:6.612.44.571.160.587.2]48
Table 3:
Training Results of the Networks
From figure 7, the test curve and the validation curve all tends to decrease simultaneously (i.e their mean squared errors). As such, there are no points within the plots where the test curves increases significantly before the validation curves increases. Hence, there are no cases of over fitting occurring. Similarly, the validation performances in all the trained networks reach their minimum at values which are within the set training goal.
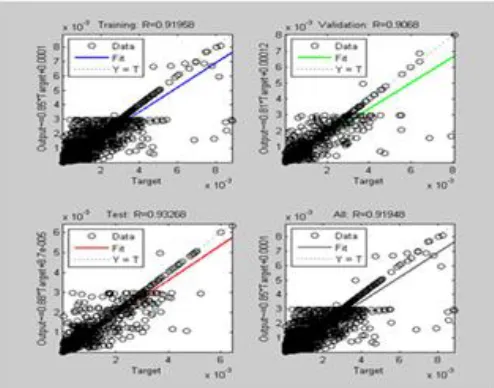
D. Regression Analysis
The regression analysis plot shows the relationship between the outputs of the network and the targets. The regression coefficients in the figure are above 0.90 for all the three target data in the respective networks, with regression coefficients of 0.91948, 0.9431, 0.9403 respectively. This indicates that the relationship between the required output of the network and the target is very close. Thus, the result indicates an acceptance of the input signal (i.e. the speaker's voice is verified).
Figure 7: Network performance progress plot for network E1-1
Networks
Target Data
Input Data
Mean Square Error (MSE) No. of Epoch
Regression
Training Test Validation Training Test Validation Overall
E1-1 E2
E1 1.323 e-7 9.816 e-7 1.455 e-7 49 0.9196 0.9327 0.9068 0.9195
E3 5.134 e-7 4.836 e-7 4.969 e-7 234 0.5509 0.5351 0.5841 0.5536
E5 1.230 e-6 1.232 e-6 1.302 e-6 465 0.4403 0.4554 0.4606 0.4458
E7 5.026 e-7 6.372 e-7 6.814 e-7 52 0.4372 0.4693 0.4461 0.4425
E2-1 E4
E1 7.416 e-7 7.124 e-7 7.146 e-7 56 0.3786 0.3839 0.3896 0.3802
E3 8.090 e-8 8.231 e-8 7.555 e-8 29 0.9450 0.9371 0.9388 0.9431
E5 1.081 e-6 1.125 e-6 1.211 e-6 102 0.5316 0.5608 0.5160 0.5336
E7 5.907 e-7 6.276 e-7 6.468 e-7 60 0.4155 0.3910 0.4323 0.4145
E3-1 E6
E1 7.724 e-7 8.673 e-7 7.300 e-7 60 0.5302 0.2981 0.3475 0.3416
E3 5.466 e-7 5.768 e-7 5.770 e-7 63 0.4550 0.5616 0.5591 0.4894
E5 1.829 e-7 1.813 e-7 1.444 e-7 53 0.9377 0.9391 0.9530 0.9403
International Journal of Emerging Technology and Advanced Engineering
Website: www.ijetae.com (ISSN 2250-2459,ISO 9001:2008 Certified Journal, Volume 5, Issue 5, May 2015)
[image:7.612.51.298.136.330.2]49
Figure 8: Regression plot for network E1-1 V. CONCLUSION
The results obtained from the system performance indices gives credence to the possibility of using the system for voice recognition. The network performance presented in this work shows an acceptance for voice signals from same speaker and a rejection for voice signals from difference speakers. These are clearly deducible from the regression analysis, where approximate values of the regression coefficients for trained voice signals from same speaker are 0.90 (acceptance). And the approximate values of the regression coefficients for trained voice signals from different speakers are 0.60. Thus, the system performance can be rated to an approximate recognition rate of close to100 %.
REFERENCES
[1] T. Matsui and S. Furui (1993), “Concatenated phoneme models for text-variable speaker recognition”, proceedings of ICASSP’93, pp. 391 – 394.
[2] S. Furui, (1981). "Cepstral analysis technique for automatic speaker verification", (pp. 254-272). IEEE Transactions on Acoustics, Speech and Signal Processing, Vol. 29(2).
[3] Christopher Bishop (1995), Neural Network for Pattern Recognition. New York: Clerendon Press, Oxford. Pp. 128 - 205. [4] Salam F. M., Waheed K., and Weaver K. (2002). A Robust
Algorithm for detecting speech segment using an entropic contrast. Circuits and Systems WWSCAS, vol. 3, pp. 328-331, Michigan state university.
[5] Joe Tebelskis. (1995).Speech Recognition using Neural Networks. Doctorate degree dissertation, school of computer science, Carnegie Mellon University, Pittsburgh, Pennsylvania.
[6] Wouter G., Georgi T., and Valeri M. (2010). Neural Network used for Speech Recognition. Journal of Automatic Control, University of Belgrade, vol. 20: 1- 7.
[7] Ganesh, K. V., Viresh M., and Kumbas S. (1998). Voice Recognition using Neural Network. IEEE Trans on Acoustic, Speech and Signal processing. Vol.29, no. 5, pp. 29 - 32.
[8] Yu Hen Hu, Jeng-Neng Hwang, (2002). Hand book on Neural Network Signal Processing, (pp. 37 - 49). CRC Press PLC. [9] Nursuliza, S. (2007). Speech Recognition using back- propagation
neural network via internet. Unpublished Master's thesis, Universiti Teknologi Mara, Shah Alam, Selangor, Malaysia.
[10] Rumelhart, D. E., Hinton G. E. and Williams R. J. (1986). Learning representations by back-propagating errors, Nature, vol. 323, no. 6088, pp. 533 - 536.