© 2016, IRJET | Impact Factor value: 4.45 | ISO 9001:2008 Certified Journal | Page 124
Human Age Estimation Based on Facial Aging Patterns
Dipali Bhat
1, Prof. V. K. Patil
21
PG Student, Electronics and Telecommunication, D .N. Patel College of Engineering, Shahada, India
2
Assistant Professor, Electronics and Telecommunication, D. N. Patel College of Engineering, Shahada, India
---***---Abstract -
Human age estimation based on facial agingpatterns has taken facial features from wrinkles and skin color on the human face to estimate the age group and age in point. Geometric ratio was used to estimate the classification of age of human age. Then, density was implemented to estimate the age in adulthood faces corresponding in each group resulting from respective density value. For performance evaluation, k-fold cross validation was carried out using FG-NET databases consisting of 700 and 500 faces, respectively. The proposed method was evaluated in comparison with five advanced methods in literature. The results showed that the proposed method provided 88.84% and 90.88% of accuracy in aging group estimation in FG-NET databases, respectively. In addition, the proposed method reported of based paper reported is 4.81 and 3.12 for MAE (mean absolute error) for point age estimation using FG-NET and PAL, respectively. In this regard, the proposed method provided the higher performance on accuracy and MAE superior to the compared methods.
Key Words: Age Estimation, Anthropometric model, FG-NET Database, Geometric ratio
1. INTRODUCTION:
Age estimation is defined to label a face image automatically with the exact age (year) or the age group (year range) of the individual face. Because of their particularity and complexity, both problems are attractive yet challenging to computer-based application system designers. Large efforts from both academia and industry have been devoted in the last a few decades. In this research, I survey the complete state-of-the-art techniques in the face image-based age synthesis and estimation topics. Existing models, popular algorithms, system performances, technical difficulties, popular face aging databases, evaluation protocols, and promising future directions are also provided with systematic discussions.
The human traits displayed by facial attributes, such as personal identity, facial expression, gender, age, ethnic origin, and pose, have attracted much attention in the last several decades from both industry and academia since face image processing techniques yield extensive applications in graphics and computer vision fields.
II Age Estimation system
[image:1.595.309.540.295.399.2]An easy way to comply with the conference paper formatting requirements is to use this document as a template and simply type your text into it.
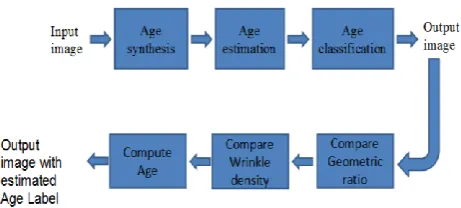
Fig. 1 Age Estimation Block Diagram.
In general, there are five main components of age estimation shown in Fig. 2 as follows:
Pre-processing: to crop the facial area from an input image in order to process in the next step.
Feature extraction: to determine facial features such as wrinkles from important positions on face; forehead, left eye corner, right eye corner, left cheek, and right cheek. In addition, skin color feature was also key features.
Age group classification: to estimate age group using machine learning techniques.
Compare Geometric ratio: to estimate age in point using machine learning techniques and Geometric ratio and compute age if ratio is less than threshold.
© 2016, IRJET | Impact Factor value: 4.45 | ISO 9001:2008 Certified Journal | Page 125 The aimed to enhance accuracy of age estimation both age
group and estimate age by using a different facial aging patterns.
III HUMAN AGING ON FACES
Human face aging is generally a slow and irreversible process, even though some retinoids (e.g., tretinoin) may slightly reverse minor photoaging effects. Although people are aging differently and aging shows different forms in different ages, there are still some general changes and resemblances we can always describe. From the biological or anthropometric point of view, there are roughly two stages during the human life that are quite different in face growth, development, and aging forms.
1. Craniofacial aging (shape change) 2. Adult aging
[image:2.595.36.272.312.422.2]Craniofacial aging (shape change)
Fig. 2 Craniofacial Growth Model for Age Progression. In craniofacial aging shape of face get changed and after some extend of time it get stoped.
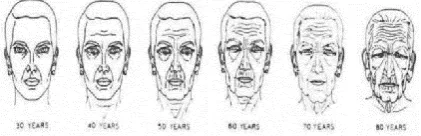
Adult aging:
Fig. 3 Face Aging Sketches From 30 to 80 Years With 10 Years Per Sketch
In adult aging facial features get changed.
1 Age Image Representation: • Anthropometric Models:
The main idea of this approach is to consult studies in cranio-facial development theory. The theory of craniofacial research uses the mathematical model to describe the growth of a person’s head from infancy to adulthood: θ'=θ, R'=R(1+k(1-cosθ))
Where θ= the angle formed from the vertical axis, R= the radius of the circle,
k= parameter that increases over time
(R',θ')s= successive growths of the circle over time. • Active Appearance Models:
Lanitis et al. extended the AAMs for face aging by proposing an aging function,
age=f (b)
Where, age = the actual age of an individual in a face image, b = vector containing 50 raw model parameters
learned from the AAMs f =the aging function
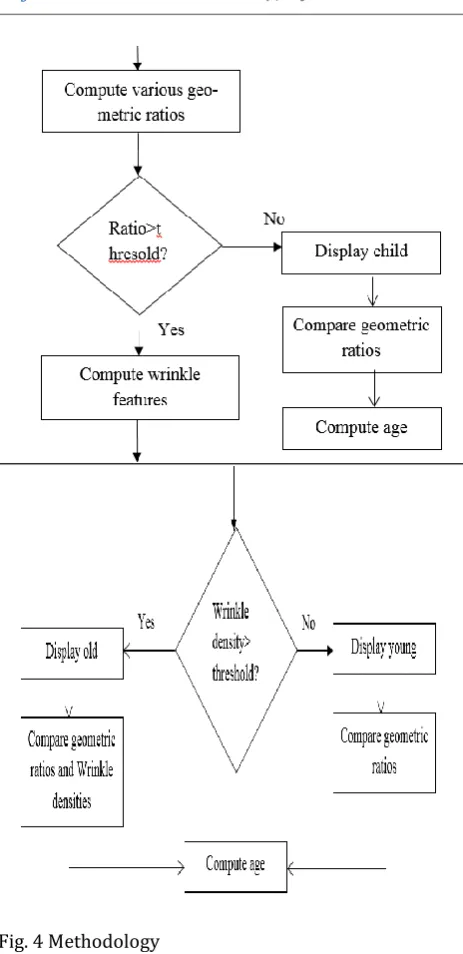
[image:2.595.41.252.525.593.2]© 2016, IRJET | Impact Factor value: 4.45 | ISO 9001:2008 Certified Journal | Page 126 Fig. 4 Methodology
Steps:
1 Pre-processing:
In order to make the feature extraction step easier, a set of functions to pre-process the the input image has been developed. The pre-processing step require following steps. • RGB To Gray:
The first step is to convert the input images from RGB to gray space. The transformation from RGB to grey space is done using the eqation
Y=0.3R+0.59G+0.11B
But we do not need to make our implementation because we can use the Matlab function Y_image=rgb2gray (RGB_image).
2 Illumination correction:
Different lighting condition affects the outputs. So it will become necessary to correct them to get appropriate output. In this we used HSI Based Color Image Equalization using Iterative nth Root and nth Power. The iterative proposed method for equalization is based on achieving a normalized image with mean of 0.5 in R, G and B channels.
3 Geometric features detection:
[image:3.595.308.530.294.403.2]Specify a threshold value as a scalar integer. This value definesthe criteria needed to declare a final detection in an area wherethere are multiple detections around an object.
Fig. 5 Geometric features detection 4 Tilt correction:
It may be possible that we get face as an input which is tilted. So it is necessary to correct them. We have to rotate them at the angle at which they are tilted.
5 Geometric ratios
Geometric features is nothing but Anthropometric model used for aging detail in craniofacial growth. In this phase different ratios are obtained as shown in figure below. Geometric features are obtained using location of eyes, nose and mouth. This model is useful for the classification of people in minors and adults, but it cannot distinguish between adults of different age, for example, young adults and seniors.
6 Wrinkle features:
After computing above ratios we extract winkle features. Here gradient operation is used for wrinkle detection. Histogram Equalization:
Histogram equalization is a technique for adjusting image intensities to enhance contrast. Let f be a given image represented as a mr by mc matrix of integer pixel intensities ranging from 0 to L − 1. L is the number of possible intensity values, often 256. Let p denote the normalized histogram of f with a bin for each possible intensity.
© 2016, IRJET | Impact Factor value: 4.45 | ISO 9001:2008 Certified Journal | Page 127 Wrinkle density:
Wrinkle density is given by the following formula
With the growth of the human age, the wrinkle density becomes larger.
7 Age classification:
First we divide the age range in three groups as shown below. The main goal of this classification to improve the efficiency of age estimation.
TABLE I Age Classification
GROUP NAME Age Range
Child 1-14
Young 14-30
old above 30
Age Estimation:
If the input facial image is of child and young people then 28 geometric ratios are computed and compared with training database for age estimation. The best match gives the estimated age.
If the input facial image is of old people then 28 geometric ratios and 5 wrinkle densities are computed and compared with training database for age estimation. The best match gives the estimated age.
V SIMULATION RESULT:
Fig. 5 Simulation result of age estimation
CONCLUSION:
© 2016, IRJET | Impact Factor value: 4.45 | ISO 9001:2008 Certified Journal | Page 128
ACKNOWLEDGMENT
I am highly indebted to Prof. V. K. Patil, D. N. Patel COE, Shahada for his guidance and constant supervision as well as for providing necessary information regarding the research work. I am also thankful to all contributors for giving me their valuable time for clarify my points, providing me Facial age estimation using various Geometric ratio and wrinkles density algorithm, FG-NET Database for my research and certify the results.
REFERENCES
[1] Yun Fu, Thomas S. Huang, "Age Synthesis and Estimation via Faces: A Survey"IEEE transactions on pattern analysis and machine intelligence, November 2010.
[2] G. Guo, Y. Fu, C. Dyer, and T.S. Huang, "Image-Based Human Age Estimation by Manifold Learning and Locally Adjusted Robust Regression,” IEEE Trans. Image Processing, vol. 17, no. 7, pp. 1178-1188, July 2008. [3] Alireza Keshavarz Choobeh “Improving Automatic Age
Estimation Algorithms using an Efficient Ensemble Technique” International Journal of Machine Learning and Computing,April 2012@IEEE.
[4] Wen-Bing Horng, Cheng-Ping Lee and Chun-Wen Chen “Classification of Age Groups Based on Facial Features”, Tamkang Journal of Science and Engineering, 2001. [5] B. Ni, Z. Song, and S. Yan, “Web Image Mining Towards