ISSN 2250-3153
The Effect of Partial Replacement of Cement With
Ground and Unground Sugarcane Bagasse Ash (SCBA)
on Mechanical Properties of Concrete
C. K. Osore1, J. N. Mwero1
1 Department of Civil & Construction Engineering, University of Nairobi.
DOI: 10.29322/IJSRP.9.01.2019.p8546
http://dx.doi.org/10.29322/IJSRP.9.01.2019.p8546
Abstract
This paper assesses the suitability of using sugarcane bagasse ash (SCBA) as partial replacement of cement in concrete as well as the effect of its grinding on the mechanical properties of concrete. The SCBA was ground in a ball mill for 60 minutes and 30 minutes and its physical and chemical properties determined to establish if it was pozzolanic. 0%, 10%, and 20% by weight of cement was then replaced by the ash in concrete and the physical properties of concrete determined.
The specific gravity values increased with the grinding; with 60 minutes ground SCBA having a specific gravity of 2.14 compared to a value of 1.99 for the 30 minutes ground SCBA and 1.81 for the unground SCBA. It was found that SCBA is highly pozzolanic, with properties close to those of class C fly ash. (01).The workability is improved with grinding as well as with increase in the amount of SCBA up to a certain limit with 10% replacement of cement with 60 minutes ground SCBA giving concrete with the highest workability. Density was improved with grinding and age of curing, with 10% replacement of 60 min ground SCBA giving the highest 90th day density of 2435kg/m³ compared with a value of 2408kg/m³ of the unground SCBA. The compressive strength and tensile
strength also increased as the amount of SCBA was increased, as days of curing increased. Lastly, water absorption reduced with grinding and increase in number of curing, with 10% replacement of 60 min ground SCBA giving a 90th value of 0.36% compared to
0.61% of the unground SCBA.
In a nutshell therefore, it was established that 60 minutes ground SCBA and 10% replacement produced concrete with the highest performance in terms of strength, durability and workability.
Key Words: Density, Workability, Compressive strength, Tensile splitting Strength, Water Absorption, Sugar Cane Bagasse Ash (SCBA).
Introduction
There has been an increase in infrastructural works in this century, especially in developing countries in line with realization of the Millennium goals. This has led to an increase in demand and consumption of cement since it is the major constituent of concrete. In the early 20th century, the composition of concrete was primarily cement, water and aggregates (02). With time and use of technology, the scientists discovered the benefits that came with use of admixtures in the concrete production. Such benefits include; reducing the cost of concrete production, reducing the heat of hydration, increasing the workability, reducing environmental pollution among others. This research paper focuses on how sugarcane bagasse ash (SCBA) can be used to replace cement partially in order to improve the performance of concrete.
Concrete is an artificial material in which aggregates both fine and coarse are bonded together by the cement when mixed with water. The selection of the relative proportions of cement, water and aggregate is called mix design. The requirements in mix design can be summarized into; strength, workability, durability and economy.
ISSN 2250-3153
a) Intrinsic: the cement has some inherent characteristic or defect that gives rise to the problem.
b) Extrinsic: the cement itself is not the cause of the problem; the low strength is in some way related to how the cement was used, or to the effect on the cement of other materials in the mix.
Extrinsic problems are, broadly, within the control of the concrete producer or contractor while intrinsic problems are generally for the cement manufacturer to identify and resolve. (03)
It is also important to note that the main constituent of cement is limestone (Calcium Carbonate). During manufacture of cement, this limestone is heated in the process of calcination and plenty of Calcium Oxide is produced, which is necessary for production of both hydraulic and non-hydraulic cement(04). However, the other product of this combustion is Carbon (IV) Oxide, which is part of the green gases, responsible for pollution of the environment and the global warming, with its many negatives. Unfortunately, cement’s huge contribution to air pollution is overlooked by the general public (Rosenwald, 2011).
The problems addressed above prompted scholars to try and find appropriate methods of making cement with several admixtures, to try and solve them. A contemporary popular way has been the use of ash, a good example being the construction of the Hoover Dam in 1929, in the United States in whichfly ash from the steel manufacturing industries was largely used as a cement replacing material(02). This was to reduce the high internal heat that was experienced when Portland cement was used alone. A lot of research has been put into the study of ash from steel manufacturing industries and this has provided a lot of information and positive steps into the replacement of cement with fly ash from the steel manufacturing industries. Much, however, remains to be researched as pertaining to the optimal use of bagasse ash as a cement replacement alternative.
Materials and Methodology
Obtaining and preparation of the bagasse ash
The SCBA was obtained from Mumias sugar factory, in western Kenya, where the bagasse had been burnt at about 10000Cto produce
electricity. The SCBA was then dried in the oven at 1100C for 24 hours before it was ground in a ball mill for 60 minutes and 30
minutes. A sample of the SCBA was then taken for determination of the chemical properties. Specific gravity and hydrometer analysis was then done on the SCBA.Various replacements of cement with the ground and unground SCBA was then done and the resulting concrete tested for the workability as well as the various mechanical properties. Workability of the concrete was determined using slump and compaction factor. The mechanical properties were done after 28, 60 and 90 days of curing.
Specific gravity
The specific gravity was done on the unground and ground SCBA according to BS 1377-part 2-1990.
Hydrometer Analysis
This was done on the 60 minutes ground, 30 minutes ground and the unground SCBA, according to BS 1377-pt2-1990.
Plate 1. Hydrometer Analysis in progress
The Mix Design
ISSN 2250-3153
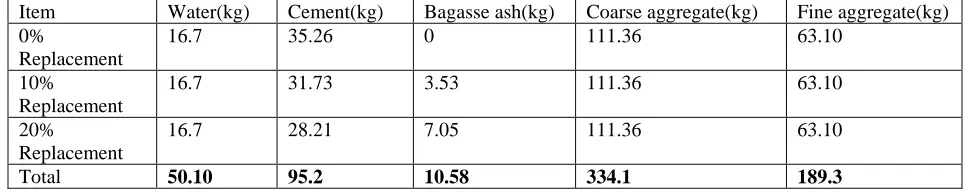
Table 1: Mix Proportions.
Item Water(kg) Cement(kg) Bagasse ash(kg) Coarse aggregate(kg) Fine aggregate(kg) 0%
Replacement
16.7 35.26 0 111.36 63.10
10%
Replacement
16.7 31.73 3.53 111.36 63.10
20%
Replacement
16.7 28.21 7.05 111.36 63.10
Total 50.10 95.2 10.58 334.1 189.3
Workability
Slump Test
The slump test was done according to the recommendations of BS 1881-128(1997) on the fresh concrete.(10)
Compaction Factor Test
The compaction factor test was done according to the recommendations of BS 1881-128(1997) on the fresh concrete.
Compressive test
Compressive strength was done according to specifications BS 1881: Part 111, BS 1881:Part 108 and 116 and BS EN 12390-3 on 10mm by 150mm by 150mm cubes after 28, 60 and 90 days of curing.
Tensile strength of concrete (Cylinder splitting)
The tensile splitting strength was done in line with the specifications of BS 1881 and ASTM C496. The concrete cylinders were tested after 28 day, 60 day and 90 days of curing.
Water Absorption Test
For this test, 150mm Х 150mm Х 150mm cubes were cast and cured for 28 days, 60 days and 90 days in ordinary water. Immediately upon curing, the cubes were removed from the curing tank, wiped dry with a tissue paper and weighed, which is the dry weight. The cubes were then immersed in water for 24 hours. Cubes were removed, patted dry with a lint free cloth, and weighed, this is the wet weight. Water absorption is expressed as increase in weight percent as shown below;
Percent Water Absorption = [(Wet weight - Dry weight)/ Dry weight] x 100
Density of Hardened Concrete Test
The Density was determined on the cubes and cylinders just before crushing them, in accordance with BS EN 12390-7.
Results and Discussions
Chemical composition of the SCBA
[image:3.612.32.520.98.196.2]The following was the findings for the chemical composition of the bagasse ash;
Table 2; Chemical composition of the SCBA
No. Chemical Sample A (%) Sample B (%) Average (%)
1 Silica(SiO2)
Soluble
ISSN 2250-3153
Insoluble Residue 43.87 43.81 43.84
2 SiO2 60.56 60.31 60.435
3 Fe as FE2O3 2.64 2.64 2.64
4 Alumina 10.14 10.46 10.30
5 Sulphates 1.8968 1.7562 1.8265
6 Ca as CaO 8.4 8.4 8.4
7 Mg as MgO 4.5324 3.7584 4.1454
8 Chlorides 0.1773 0.154 0.166
9 Iron and Alumina 12.78 13.10 12.94
10 L.O.I 31.48 31.81 31.645
Discussion
The chemical composition of the SCBA was found to be within the recommendations of ASTM C618 and it was found to be close to class C fly ash(01). Class C Fly Ash in addition to being a pozzolan is also cementitious.
It is however worth noting that the Loss of Ignition (L.O.I) is very high. This implies that the ash was not burnt at appropriate temperature. This means that there is high carbon content and hence workability may be lowered. The silica content was found to be 60.4%, implying that the SCBA was an effective pozzolanic material and cementitious.
Specific Gravity of the SCBA
The specific gravity of unground SCBA was found to be 1.81, 30 minutes ground SCBA to be 1.99 and 60 minutes ground SCBA was 2.14, giving an average of 1.98.
Discussion
The difference in specific gravity is brought about by the grinding which reduces the size of particles, increasing the surface area per given volume, consequently making them have a higher parking density, hence the high specific gravity in the ground SCBA.
These values were however lower than that of the cement used, which had a specific gravity value of 3.15. This implies that even the grinding did not reduce the particles to sizes comparable to those of cement as outlined below. Cement thus still had higher parking density.
This low value of specific gravity(compared to that of cement) is of economic significance because the more the percentage replacement of cement in the concrete, the lesser the overall weight of the concrete and structure at large. This would be an economic gain for the massive structures such as storey buildings and bridges. Lighter concrete would mean less logistics and costs of handling it. Lighter structures or members thereof would also result in lower reinforcement costs due to the reduction in dead load.
Hydrometer Analysis Results
ISSN 2250-3153
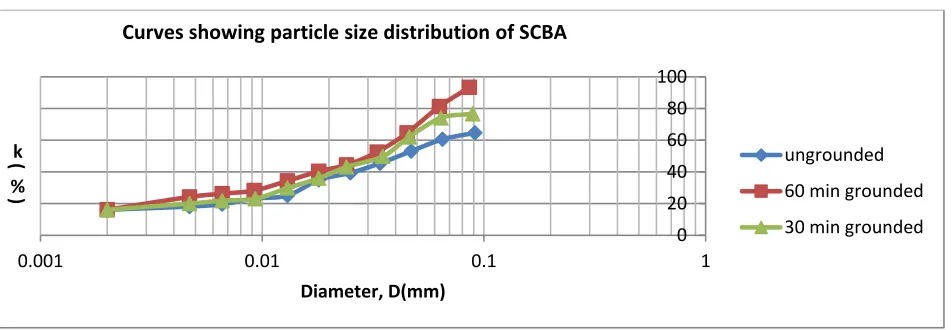
[image:5.612.44.520.71.236.2]The grain distribution curve is represented on the semi-logarithmic scale below;
Fig 1. A graph showing particle size distribution of variously ground SCBA
Discussion
From the graph above, it can be seen that grinding reduced the sizes of the SCBA significantly. For instance, the 60 minutes ground
SCBA had particles sizes ranging from 2μm and 78μm. About 95% of the particles were found to be 75μm and below while about
70% of the particles were found to be 45μm and below, which is the fineness of OPC.
For the 30 minutes ground SCBA, the particles sizes ranged from 2μm and 85μm. About 70% of the particles were 45μm and below.
For the unground SCBA, particle sizes ranged from 2μm and 92μm. Only about 50% of the particles were 45μm and below.
As outlined above, grinding was effective and the reduction in particles was a function of the time of grinding. Particles reduced as the time of grinding was increased. The reduction in particle size has an effect on specific gravity, density of concrete, strength and water absorption of the concrete as outlined elsewhere in this report.
Workability Results
Slump Results
Fig 2. Slump vs % replacement of variously ground SCBA
0 20 40 60 80 100
0.001 0.01 0.1 1
k( %
)
Diameter, D(mm)
Curves showing particle size distribution of SCBA
ungrounded 60 min grounded 30 min grounded
0 10 20 30 40 50 60 70
0% 5% 10% 15% 20% 25%
S l u m p( m m)
% Replacement
Slump vs % replacement of SCBA
[image:5.612.38.530.458.634.2]ISSN 2250-3153
Fig 3. Slump vs time of grinding of SCBA for the various replacements.
Compaction Factor Results
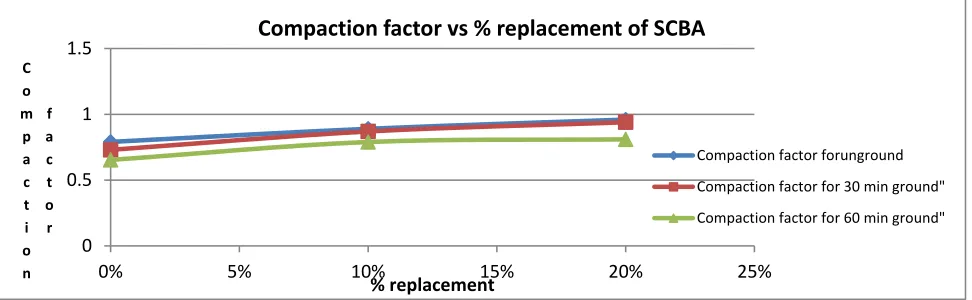
Fig 4. Compaction factor vs % replacement of SCBA
Discussion
It is evident from the above figures that slump values increased with replacement up to a certain limit and then started decreasing. 10% replacement of SCBA produced concrete with slightly higher slump value than the control, which dropped slightly when the replacement was 20%. The same observation is made with the compaction factor values.
It is also worth noting that the slump values increased with increase in time of grinding. The 60 min. ground SCBA produced concrete with the highest slump values, followed by 30 min. ground SCBA while unground SCBA produced concrete with the lowest slump values, although, the differences were very minimal.
The above observations imply that workability was improved by addition of the SCBA slightly, 10% replacement producing concrete with a slightly higher workability. This can be attributed to the fact that the SCBA particles are rounder than cement particles and hence allows water to move around them easily hence improving workability of concrete.(02) The other reason for the increase in workability is that SCBA has slightly bigger particles than cement, making them to have a lower surface area to volume ratio hence few particles that are easily wetted. Grinding improves workability slightly since as the particle sizes reduce, the roughness also reduce.(02).The reduction in workability as the SCBA increase can be attributed to the fact that as the SCBA increase, the surface area to volume ratio of the ash increase, increasing roughness and carbon content with subsequent reduction in workability.
However, the values of slump obtained are lower than those found by previous researches at the same w/c ratio. This is because of the high Loss on Ignition value-31.6%! This means that the SCBA was not well burnt hence had a high carbon content, were rougher and hence absorbed more water, leading to lower workability compared with previous studies.(06)
30 50 70
0 10 20 30 40 50 60 70
s l u m p( m m
) Time of grinding(Mins)
Slump vs time of grinding of SCBA
slump results vs grinding for control
slump results vs grinding for 10 % replacement
slump results vs grinding for 20% replacement
0 0.5 1 1.5
0% 5% 10% 15% 20% 25%
C o m p a c t i o n
f a c t o r
% replacement
Compaction factor vs % replacement of SCBA
[image:6.612.37.523.239.389.2]ISSN 2250-3153 Density Results
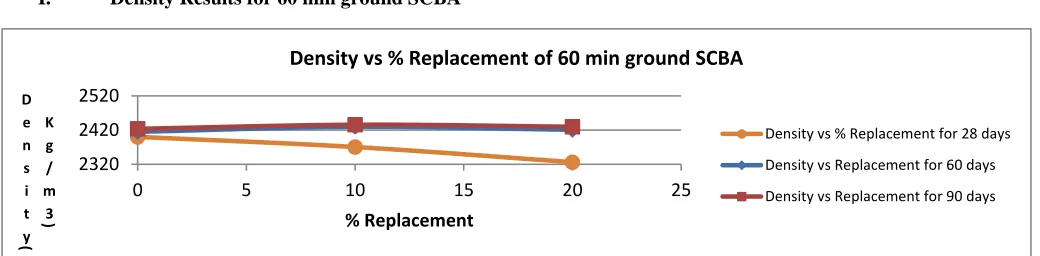
[image:7.612.35.555.83.211.2]I. Density Results for 60 min ground SCBA
[image:7.612.37.553.267.396.2]Fig 5. Density vs % replacement for various time of curing.
Fig 6. Density vs time of curing for the various replacements.
[image:7.612.32.523.532.717.2]II. Density Results for 30 min. ground SCBA
Fig 7. Density vs % Replacement of SCBA for 30 min. ground SCBA 2320
2420 2520
0 5 10 15 20 25
D e n s i t y(
K g / m
3) % Replacement
Density vs % Replacement of 60 min ground SCBA
Density vs % Replacement for 28 days Density vs Replacement for 60 days Density vs Replacement for 90 days
2300 2350 2400 2450
0 20 40 60 80 100
D e n s i t y( k
g / m
3)
Time of curing(Days) Density vs time of curing for 60 min ground SCBA
Density vs time of curing for 0% Density vs Time for 10 % Density vs Time for 20%
2300 2350 2400 2450
0 5 10 15 20 25
d e n s i t y
(
k g / m 3)
% replacement Density vs % replacement for 30 min ground SCBA
Density vs % Replacement for 28 days
Density results for 60 Days
Density Results for 90 days
2300 2350 2400 2450
0 20 40 60 80 100
d e n s i t y( k g
/ m
3)
Time of curing(Days)
density vs time of curing for 30 min ground SCBA
Density vs time for control
ISSN 2250-3153
Fig 8. Density vs time of curing for 30 min. ground SCBA
[image:8.612.56.562.76.373.2]III. Density Results for unground SCBA
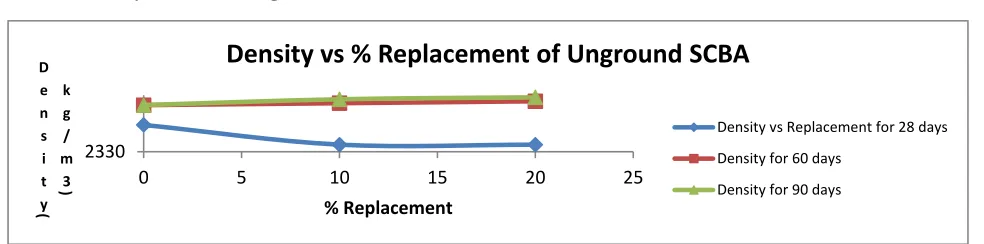
Fig 9. Density vs % Replacement of unground SCBA
Fig 10. Density against time of curing for the unground SCBA
Discussion
From the figures above, several observations can be deduced. Firstly, at early age of concrete, the density reduces with increase in SCBA. This can be attributed to the fact that at this age, the only contributing factor to the density is the density of the constituent materials. SCBA being lower in density (1.98g/cm³) than cement (3.15g/cm³), produces concrete with lower dry density.(07)
Secondly, as the time of curing increase, the density increases with increase in SCBA up to a certain limit before starting to drop. For instance, the concrete made from 10% replacement SCBA had the highest density at 60 and 90 days of curing, followed by 20% replacement concrete and lastly the control, which increased only slightly as days of curing increased. This increase in density with increase in time of curing can be attributed to the hydration of tricalcium silicate and dicalcium silicate with water to produce calcium hydroxide and calcium-silicate-hydrate(C-S-H), which is a rigid hard and compact structure, hence the higher density. This reaction increases with increase in time of curing, hence the increase in density with time of curing. The increase in density with SCBA at later ages of curing can be attributed to the fact that in addition to the C-S-H produced above, more C-S-H is also produced from the reaction of calcium hydroxide produced above with silica from the SCBA. The slight reduction in density at 20% replacement is due to lack of Tricalcium and Dicalciun silicate hence less calcium hydroxide to react with silica, resulting in less C-S-H(08)
Lastly, it is seen that the density increased with increase in time of grinding. This is due to the increase in surface area to volume ratio and specific gravity with time of grinding as outlined above.
Compressive Strength Results
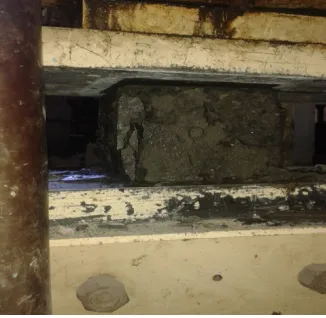
It was observed that the cubes failed in a normal and acceptable way as shown by the plate below; 2330
0 5 10 15 20 25
D e n s i t y(
k g / m
3)
% Replacement
Density vs % Replacement of Unground SCBA
Density vs Replacement for 28 days Density for 60 days
Density for 90 days
2300 2350 2400 2450
0 20 40 60 80 100
D e n s i t y( k
g / m
3)
Time of curing(Days)
density vs time of curing for unground SCBA
Density vs time of curing for control
Density vs Time of curing for 10% replacement
[image:8.612.50.542.87.209.2]ISSN 2250-3153
Plate 3. Failed compressive strength sample
[image:9.612.36.199.55.214.2]I) Compressive strength results for 60 min. ground SCBA
Fig 11. Compressive strength vs % replacement of 60 min ground SCBA.
Fig 12. Compressive strength vs time of curing for the various replacements.
II. Compressive Strength for 30 min. ground SCBA 0
20 40
0 5 10 15 20 25
c o m p r .
S t r e n g
t h
(
N / m m
2) % replacement
compressive strength vs % replacement of 60 min ground SCBA
Compressive strength vs % Replacement for 28 days
Compressive strength for 60 days
Compressive results for 90 days
0 10 20 30 40
0 20 40 60 80 100
C o m p r .
S y r e n g t
h( N / m m
2) Time of curing (Days)
Compressive strength vs time of curing for 60 min ground SCBA
Compressive strength vs time for control
Compressive strength for 10%
[image:9.612.35.548.420.562.2]ISSN 2250-3153
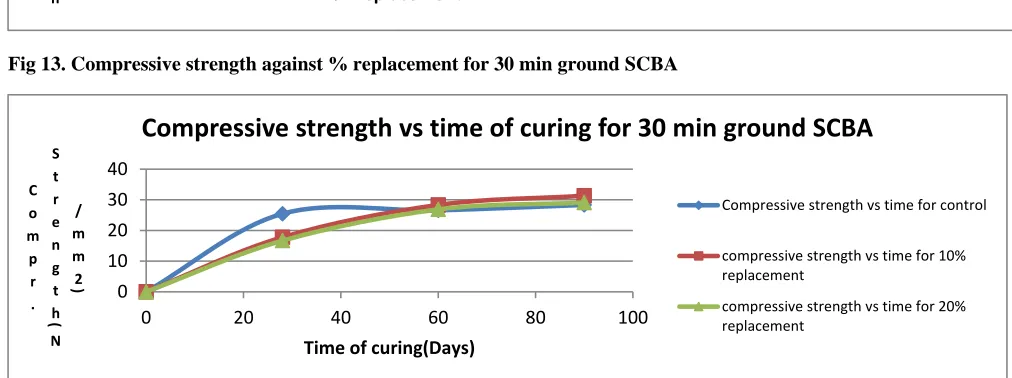
Fig 13. Compressive strength against % replacement for 30 min ground SCBA
Fig 14. Compressive strength results vs time of curing for 30 min ground SCBA
[image:10.612.32.538.157.346.2]
III. Compressive strength results for unground SCBA
Fig 15. Compressive strength vs % Replacement for unground SCBA 0
20 40
0 5 10 15 20 25
C o m p r .
S t r e n g t h
(
N / m m 2)
% Replacement
Compressive strength vs % replacement of 30 min ground SCBA
Compressive strength vs % Replacement for 28 days
Compressive results for 60 days
Compressive results for 90 days
0 10 20 30 40
0 20 40 60 80 100
C o m
p r .
S t r e n g t h( N
/ m m 2)
Time of curing(Days)
Compressive strength vs time of curing for 30 min ground SCBA
Compressive strength vs time for control
compressive strength vs time for 10% replacement
compressive strength vs time for 20% replacement
0 20 40
0 5 10 15 20 25
C o m p r .
S t r e n g t h(
N / m m 2)
% Replacement
Compressive strength vs % Replacement of Unground SCBA
[image:10.612.48.545.404.552.2]ISSN 2250-3153
Fig 16. Compressive strength against time of curing for unground SCBA
Discussion
Firstly, it was seen that compressive strength increases with increase in days of curing. This is because hydration of cement is a continuous process that goes on forever, as long as favourable conditions are provided. With increase in time of curing, more C-S-H is produced hence the increase in compressive strength with time of curing. Also, at early age, concrete has more pores hence low strength. With increase in time, these pores are replaced with C-S-H hence the increase in strength.(09)
Secondly, the compressive strength for the control (0% replacement) was the highest at early ages of concrete. As time of curing increase, the concrete having SCBA had higher compressive strength values, which reduces slightly as the content of SCBA increase further. At early age, 0% SCBA concrete has the highest compressive strength because of the high Tricalcium silicate and Dicalcium Silicate hence high C-S-H than the 10% SCBA and 20% SCBA concrete.(04) As the time of curing increase, the 10% SCBA concrete has the highest compressive strength because in addition to C-S-H from hydration, the calcium hydroxide formed as a product of hydration contributes to strength by; i) Providing a P.H medium for reaction with Silica from SCBA, ii) Silica from SCBA reacts with it to produce more C-S-H. (07,08) As outlined earlier, at 20% SCBA, the strength is lower than the 10% SCBA concrete since the reduction in cement implies that there is less Dicalcium and Tricalcium silicates to form C-S-H.(08)
Lastly, it is observed that compressive strength increases with grinding, with 60 min. ground SCBA giving the highest compressive strength. This can be attributed to i), the higher surface area to volume ratio implying that more particles and more silica for reaction with calcium hydroxide to form C-S-H, ii) Smaller particles ensure faster reactions hence faster rate of formation of C-S-H and iii), The higher specific gravity(Density) hence more compact concrete and subsequently higher strength.
TENSILE SPLITTING RESULTS
I. Tensile results for 60 min. ground SCBA
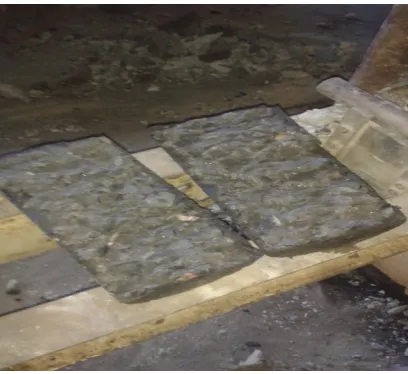
The cylinders were observed to fail in recommended way by splitting into two halves as shown on the plate below;
Plate 4. Failed tensile split cylinder sample 0
20 40
0 20 40 60 80 100
C o m p
r .
S t r e n g t h(
N / m m 2)
Time of curing(Days)
Compressive strength vs time of curing for unground SCBA
Compressive strength vs time of curing for control
Compressive strength vs time for 10% replacement
ISSN 2250-3153
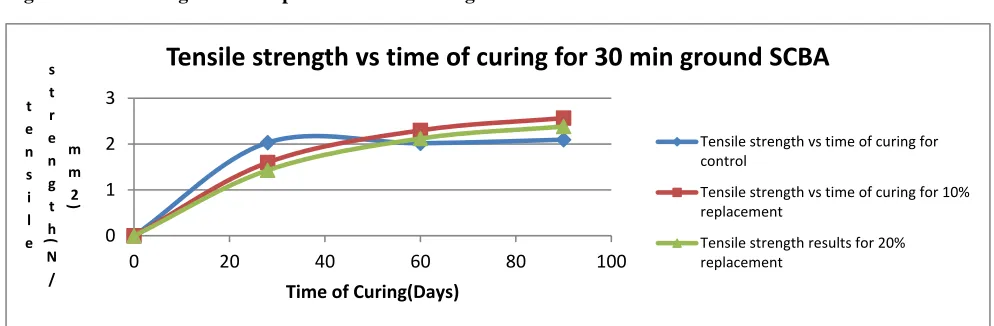
[image:12.612.32.523.79.359.2]Fig 17. Tensile strength vs % Replacement for 60 min ground SCBA.
Fig 18. Tensile strength vs time of curing for 60 min ground SCBA
[image:12.612.33.530.549.712.2]II. Tensile strength results for 30 min. ground SCBA
Fig 19. Tensile strength vs % Replacement of 30 min. ground SCBA 0
2 4
0 5 10 15 20 25
t e n s i l e s t r e n g t h( N / m m 2) % replacement
Tensile strength vs % replacement of 60 min ground SCBA
Tensile Strength vs % Replacement for 28 days
Tensile results for 60 days
Tensile Results for 90 days vs replacement
0 1 2 3
0 20 40 60 80 100
T e n s i l e s t r e n g t h( N / m m 2)
Time of curing(days)
Tensile strength vs time of curing for 60 min ground SCBA
Tensile strength vs days for control Tensile strength for 10 % replacement Tensile results for 20%
0 2 4
0 5 10 15 20 25
t e n s i l e s t r e n g t h ( N / m m 2) % Replacement
tensile strength vs % Replacement of 30 min ground SCBA
Tensile strength vs % Replacement for 28 days
Tensile results for 60 days
Tensile results for 90 days
0 1 2 3
0 20 40 60 80 100
t e n s i l e s t r e n g t h( N / m m 2)
Time of Curing(Days)
Tensile strength vs time of curing for 30 min ground SCBA
Tensile strength vs time of curing for control
Tensile strength vs time of curing for 10% replacement
ISSN 2250-3153
Fig 20. Tensile strength vs time of curing for 30 min ground SCBA
[image:13.612.32.538.95.376.2]III. Tensile Strength results for unground SCBA
Fig 21. Tensile strength vs % Replacement for the unground SCBA
Fig 22. Tensile strength against time of curing for the unground SCBA
Firstly, it was seen that tensile strength increases with increase in days of curing. This is due to the increase in C-S-H production with time of curing as outlined above, as hydration of cement goes on. Another observation is that the values obtained were very low compared to the compressive strength. This explains why reinforcements are normally put in concrete elements subjected to tension. The values were however in the range of 1/8-1/12 the compressive strength.(04)
Secondly, the tensile strength for the control (0% replacement) was the highest at early ages of concrete. As time of curing increase, the concrete having SCBA had higher tensile splitting strength values, which reduces slightly as the content of SCBA increase further for the same reasons as explained under compressive strength.
Lastly, it is observed that tensile strength increases with grinding, with 60 min. ground SCBA giving the highest tensile strength, again for the same reasons as outlined under compressive strength.
WATER ABSORPTION RESULTS
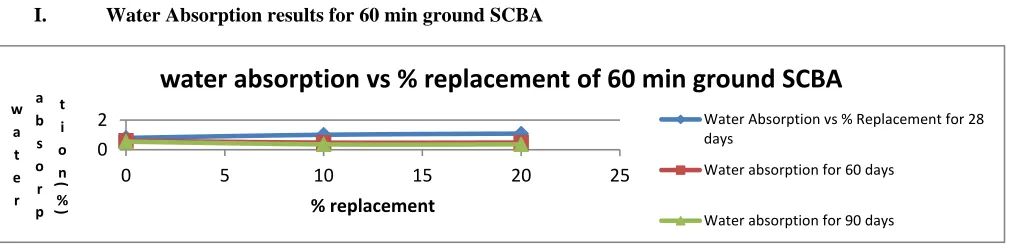
[image:13.612.31.534.107.237.2]I. Water Absorption results for 60 min ground SCBA
Fig 23. Water Absorption vs % Replacement for the 60 min. ground SCBA 0
2 4
0 5 10 15 20 25
T e n s i l e
s t r e n g t
h( N / m m 2)
% Replacement
Tensile strength vs % replacement for unground SCBA
Tensile vs replacement for 28 days Tensile results for 60 days Tensile results for 90 days
0 1 2 3
0 20 40 60 80 100
T e n s i l e
s t r e n g t h(
N / m m 2)
Time of Curing(Days)
Tensile strength vs time of curing for unground SCBA
Tensile strength vs time of curing for control
Tensile strength vs time for 10% replacement
Tensile strength vs time for 20% replacement
0 2
0 5 10 15 20 25
w a t e r
a b s o r p
t i o n( %
) % replacement
water absorption vs % replacement of 60 min ground SCBA
Water Absorption vs % Replacement for 28 days
Water absorption for 60 days
[image:13.612.37.542.583.706.2]ISSN 2250-3153
Fig 24. Water Absorption vs time of curing for the 60 min ground SCBA
II. Water Absorption Results for the 30 min ground SCBA
[image:14.612.37.542.59.180.2]Fig 25. Water Absorption vs % Replacement for the 30 min ground SCBA
Fig 26. Water Absorption vs time of curing for the 30 min ground SCBA
III. Water Absorption Results for the Unground SCBA
Fig 27. Water absorption vs % Replacement for the unground SCBA 0
0.51 1.5
0 20 40 60 80 100
W a t e r a b s o r p t i o n( % )
Time of curing(Days)
Water absorption vs time of curing for 60 min ground SCBA
water absorption for control water absorption for 10% water absorption for 20%
0 2
0 5 10 15 20 25
w a t e r a b s o r p t i o n( % ) % Replacement
water absorption vs % replacement of 30 min ground SCBA
Water Absorption vs % Replacemet for 28 days
Water absorption for 60 days
Water absorption for 90 days
0 2
0 20 40 60 80 100
w a t e r a b s o r p t i o n( % )
Time of curing(days)
water absorption vs time of curing for 30 min ground SCBA
Water absorption vs time of curing for control
Water absorption vs time for 10% replacement
Water absorption vs time for 20% replacement
0 5
0 5 10 15 20 25
W a t e r a b s o r p t i o n( %) % Replacement
Water absorption vs % replacement of unground SCBA
Water absorption vs replacement for 28 days
Water absorption for 60 days
[image:14.612.32.529.465.635.2]ISSN 2250-3153
Fig 28. Water absorption vs time of curing for the unground SCBA
From the figures above, several observations can be deduced. Firstly, at early age of concrete, the water absorption increases with increase in SCBA. This can be attributed to the fact that at this age, concrete without SCBA has the highest density due to the high density of cement and higher C-S-H gel than concrete made from SCBA, as outlined earlier.(07)
Secondly, as the time of curing increase, the water absorption decreases with increase in SCBA up to a certain limit before starting to drop. This decrease in water absorption with increase in time of curing can be attributed to the hydration of tricalcium silicate and dicalcium silicate with water to produce calcium hydroxide and calcium-silicate-hydrate(C-S-H), which is a rigid hard and compact structure, hence the higher density concrete that allows only little water to go through it. This reaction increases with increase in time of curing, hence the increase in density with time of curing with consequent reduction in water absorption. The reduction in water absorption with SCBA at later ages of curing can be attributed to the increase in density with SCBA at later ages of curing due to the fact that in addition to the C-S-H produced above, more C-S-H is also produced from the reaction of calcium hydroxide produced above with silica from the SCBA. The slight increase in water absorption at 20% replacement compared to 10% replacement is due to the reduction in density at 20% replacement due to lack of Tricalcium and Dicalciun silicate hence less calcium hydroxide to react with silica, resulting in less C-S-H(08)
Lastly, it is seen that the water absorption decreased with increase in time of grinding of the SCBA. This is because density increased with increase in time of grinding due to the increase in surface area to volume ratio and specific gravity with time of grinding as outlined above.
COMPARISON OF THE MECHANICAL PROPERTIES FOR 10% REPLACEMENT FOR 60 MIN GROUND, 30 MIN GROUND AND UNGROUND SCBA
This was done to assess the effect of grinding the SCBA on the mechanical properties of the SCBA.
I. Density
Fig 29. Density vs time of curing for 10% replacement
From the above figure, it can be seen that the density increases with with increase in time of grinding of the SCBA. This is because grinding reduces the particle sizes, increasing surface area to volume ratio hence increasing the specific gravity and consequently density of the concrete.
II. Compressive strength 0
1 2 3
0 20 40 60 80 100
W a t e r
a b s o r p t i o
n( %)
Time of curing(Days)
water absorption vs time of curing of unground SCBA
Water absorption vs time of curing for control
Water absorption vs time for 10% replacement
Water absorption vs time for 20% replacement
2300 2400 2500
0 20 40 60 80 100
D e n s i t y(
K g / m
^ 3)
Time of curing(Days)
Density vs Time of curing for 10% Replacement
DENSITY VS TIME FOR 60 MIN GROUND SCBA
DENSITY VS TIME FOR 30 MIN GROUND SCBA
[image:15.612.35.520.499.630.2]ISSN 2250-3153
Fig 30. Compressive strength vs time of curing for 10% Replacement.
From the figure above, it is observed that compressive strength increases with grinding, with 60 min. ground SCBA giving the highest compressive strength. This can be attributed to i), the higher surface area to volume ratio implying that more particles and more silica for reaction with calcium hydroxide to form H, ii) Smaller particles ensure faster reactions hence faster rate of formation of C-S-H and iii), The higher specific gravity(Density) hence more compact concrete and subsequently higher strength.
[image:16.612.34.506.323.471.2]III. Tensile strength
Fig 31. Tensile strength vs time of curing for 10% replacement
The tensile splitting strength from the figure above shows that tensile strength increases with grinding, with 60 min. ground SCBA giving the highest strength. This can be attributed to i), the higher surface area to volume ratio implying that more particles and more silica for reaction with calcium hydroxide to form C-S-H, ii) Smaller particles ensure faster reactions hence faster rate of formation of C-S-H and iii), The higher specific gravity(Density) hence more compact concrete and subsequently higher strength.
IV. Water absorption
Fig 32. Water absorption vs time of curing for 10% Replacement. 0
20 40
0 20 40 60 80 100
C o m p r . s t r
e n g t h( N / m m
2)
time of curing(days)
Compressive Strength vs Time of curing for 10% Replacement
COMPRESSIVE STRENGTH VS TIME FOR 60 MIN GROUND SCBA
COMPRESSIVE RESULTS FOR 30 MIN SCBA
COMPRESSIVE RESULTS FOR UNGROUND SCBA
0 1 2 3
0 20 40 60 80 100
T e n s i l e
S t r e n g t h(
N / m m 2)
Time of curing(Days)
Tensile Strength vs Time of curing for 10% replacement
TENSILE RESULTS FOR 60 MIN GROUND SCBA
TENSILE RESULTS FOR 30 MIN GROUND SCBA
TENSILE RESULTS FOR UNGROUND SCBA
0 2
0 20 40 60 80 100
w a t e r
a b s p o r t
i o n( %
)
time of curing(days)
water absorption vs time of curing for 10% replacement
WATER ABSORPTION FOR 60 MIN GROUND
WATER ABSORPTION FOR 30 MIN GROUND
[image:16.612.32.527.563.678.2]ISSN 2250-3153
It can be seen from the figure above that the water absorption decreased with increase in time of grinding of the SCBA. This is because density increased with increase in time of grinding due to the increase in surface area to volume ratio and specific gravity with time of grinding as outlined above.
Conclusions
The following conclusions can be drawn from this research;
a) Sugarcane bagasse ash(SCBA) is highly pozzolanic, based on the chemical composition obtained, and it can be classified as class C fly ash according to ASTM C618.
b) Use of SCBA as partial replacement of cement improves workability slightly up to a certain limit before starting to drop, with 10% replacement giving the highest workable concrete.
c) The compressive strength and tensile strength of concrete is increased by replacing cement partially with SCBA up to a certain limit. It was found out that a replacement of 10% gave concrete with the highest compressive and tensile strength. d) The density of concrete is increased as SCBA replacement increases up to 10% replacement before starting to drop.
e) Water Absorption reduces as the SCBA replacement increases up to 10% before dropping. This low water absorption and the increase in density thus means that the concrete will be more durable and the reinforcements will not rust too much.
f) Grinding of SCBA improves the performance of concrete since at 10% replacement, 60 minutes ground SCBA gave concrete with the highest 90th day compressive and tensile strengths, highest 90th day density and lowest 90th day water absorption
values.
From these findings, it can be concluded that 60 minutes ground SCBA with a 10% replacement gave concrete with the best performance.
Acknowledgement
I wish to most sincerely express my gratitude to the following, without whom the success of this research would have been futile; The Almighty God for the gift of life, good health and resources. DrMwero-Lecturer, University of Nairobi,Charles Karugu-Lab technician, JKUAT, Njoroge-Ministry of transport lab,Eunice Munene-Soil’s lab, University of Nairobi,Muchina, Rose and Martin all of the concrete lab, University of Nairobi and lastly my classmates and friends, Kogi, Katee, Matungo and Makubo.
References
01. ASTM Standards C618-99(2009). Standard specifications for coal fly ash and raw or calcined Natural Pozzolan for use as a mineral admixture in concrete. West Conshocken, U.S.A
02. Gill.O (2013). Fundamentals of concrete (3rded.). Midrand, South Africa: The concrete institute
03. Nicholas B.W (2014). Low concrete strength? Ten potential cement-related causes. Woodbridge Suffolk, United Kingdom:WHD Micro analysis Consultants Ltd.
04. Neville A.M and Brooks J.J (2010). Concrete technology (2nded). England: Pearson Education Limited
05. Building Research Establishment (1992). Design of normal concrete mixes (2nded). Watford, England:Building Research
Establishment LTD
06. Guilherme.C.C. et al (2004). Influence of mechanical grinding on the pozzolanic activity of Residual sugarcane bagasse ash. Barcelona, Spain.
07. Mwero.J.N et al (2011). Sugarcane Waste Fiber Ash: Composition, Particle size distribution and pozzolanic properties. ICASTOR Journal of Engineering, 20111;4(2)
08. Zhang M.H, Lastra R, Malhotra V.M (1992). Rice husk ash paste and concrete: Some aspects and hydration and the Microstructure of the Interfacial Zone Between the Aggregate and Paste. New Delhi, India: Cement and Concrete research 09. The concrete countertop Institute (2012). Curing-How exactly does it work? Accessed from
>www.concretecountertopinstitute.com< on 31/01/2016.