2018 International Conference on Information, Electronic and Communication Engineering (IECE 2018) ISBN: 978-1-60595-585-8
Consider the Test Coverage Function and Software Reliability
Evaluation Model for Imperfect Troubleshooting
Hui-bo DONG
*, Tong WANG, Xian SHEN, Jian LI and Hui-xia DING
No. 15, Xiaoying East Road, Qinghe, Haidian District, Beijing, China
*Corresponding author
Keywords: Test coverage, Imperfect troubleshooting, Logistic function, Software reliability growth model.
Abstract. In order to simultaneously describe the impact of two important test factors, test coverage and imperfect troubleshooting, on the reliability of software reliability assessment, and improve the evaluation accuracy of existing software reliability models, this paper based on test coverage function, based on test coverage Software reliability modeling method for rate and imperfect troubleshooting. Firstly, based on the non-homogeneous Poisson process (NHPP), a software reliability modeling framework considering test coverage function and imperfect troubleshooting assumptions is proposed. On this basis, the test coverage function is combined with the imperfect troubleshooting situation, and a new software reliability evaluation model (ILTCS) is proposed. On the three sets of real failure data sets, the proposed model is compared with several classical software reliability growth models. The example verification results show that the proposed new model is accurate and accurate on the two sets of failure data sets. Both are significantly better than others. Therefore, considering the test coverage function and imperfect troubleshooting in the modeling process, the fitting and predictive performance of the software reliability model can be effectively improved
Preface
As software is widely used in various fields of society, the failure of software, especially security-critical software, is likely to lead to catastrophic loss of life and property. Software reliability has become one of the most important quality indicators for users when software is released. Software reliability refers to the probability that the software will not fail during operation within the specified time within the specified time [1]. Software reliability is to understand the software quality from the user's point of view, which is more closely related to the actual operation of the software [2]. Therefore, Software Reliability Growth Models (SRGMs) are the main means of quantitative evaluation and estimation of software reliability in development and operation phases. Since the 1970s, they have become the key research direction in the field of software reliability engineering. It has been successfully applied to the development process of various safety critical software [3]. Studies have shown that if the effects of software testing process factors on software reliability are considered in the software reliability modeling process, the fitting and predictive performance of existing models will be improved [4]. Test Coverage (TC) [4] and Imperfect Debugging (ID) [5] are two important test process factors.
Existing SRGMs are based on the assumption of a perfect troubleshooting that the troubleshooting process does not introduce new defects. However, in actual tests, due to factors such as software complexity and developer level, troubleshooting is often introduced with new defects, the so-called imperfect troubleshooting. Therefore, this imperfect troubleshooting phenomenon should be accurately described in the software reliability modeling process. The existing research results also show that the consideration of imperfect troubleshooting in the modeling process is an important means to improve the model fitting and prediction accuracy.
software reliability models more accurately describe the impact of these two factors on software reliability, in order to improve the fitting and predictive performance of existing software reliability models.
Logistic Test Coverage Function
Due to the complexity of the testing process, the growth trend of the test coverage function may take many forms. For example, in the actual test process, due to the combined influence of software structural characteristics and learning factors, there is often a situation in which the test coverage increases rapidly in the initial stage, but when the test proceeds to a certain point in time, the test coverage is tested. The increase rate will gradually slow down, that is, the test coverage will show a trend of increasing first and then decreasing. The Logistic function is very suitable for describing such S-type growth trends, and has the advantages of simple structure and good flexibility [10].
The test coverage of the moment is marked as C t
, Assume that the Logistic function can beused to describe the test coverage function (LC function) based on the Logistic function:
max
1 exp
C C t
A
t
(1) among them Cmax Indicates the test coverage value that is ultimately expected to be reachable:
max
C C , A as a constant, Indicates the growth rate parameter of test coverage Known by Equation 1. As Equation 1 shows:
1) C t
Is a three-parameter function, Software test coverage is an effective indicator todescribe test adequacy and test efficiency [6], which can be used to predict software defects and estimate the test resources required for completion. Some studies have pointed out that there is a clear correlation between test coverage and software reliability and defect coverage [6~7], and the fitting and predictive effects of software reliability models combined with test coverage information may also be obtained. Effective improvement [8~10]. At present, there are many test coverage functions with different distribution forms: exponential distribution [11], log-exponential distribution [6], Weibull distribution and Log-Logistic distribution [12], S-shaped distribution [13], gamma Horse distribution [14], Sedigh-Ali function [15], Logistic function [10] and so on. These research results show that considering the test coverage in the software reliability modeling process can effectively improve the fitting and prediction accuracy of the model. It has important theoretical significance and engineering practical value, which deserves further research.
max (1 ) (0)
C A C . If Cmax=1, Then Equation 1 is:
1
1
exp
C t
A
t
(2)2) C t
Non-negative and monotonically increasing over time 2, consistent with the actualgrowth behavior of test coverage, so, at least in form, the Logistic function can be used to describe the test coverage function;
3) Deriving a derivative of C t
to t, the test growth rate with time can be further obtained asa function of the rateC t
:
2max
) exp( 1
) exp( )
( ) (
t A
t A
C dt
t dC t c
(3)
time. At time tmax 1ln( )A
, it reaches a maximum value.
NHPP Reliability Modeling Process Based on Test Coverage Function
NHPP Modeling Framework Based on Test Coverage Function
The non-homogeneous Poisson process (NHPP) is currently the most mature software reliability modeling method. This chapter will present an NHPP modeling framework based on the test coverage function. The basic assumptions are as follows:
1) The software defect detection process obeys the NHPP process, and the total number of software defects is a fixed value, which is recorded as N;
2) The detected defects are immediately eliminated and no new defects are introduced;
3) At any time, the failure strength of the software is proportional to the number of residual defects in the software;
4) The defect detection rate function is measured by the ratio of the test coverage growth rate C’(t) to the uncovered code ratio 1- C(t)at t time. Where C(t) is the test coverage growth function and C’(t)is the derivative of C(t) with respect to time.
Based on the above assumptions, the following NHPP-like software reliability modeling framework considering the test coverage function can be obtained:
'
( )
( ) 1
C t dm t
N m t
dt C t (4) Once the specific form of the test coverage function C(t) can be determined, it can be taken into the above differential equation and solved to obtain the defect mean function m(t), which is the reliability of the NHPP software considering the test coverage function. model.
NHPP Model Based on Logistic Test Coverage Function
The basic assumptions of the NHPP-like software reliability model (abbreviated as LTCS model) considering the logistic test coverage function are basically consistent with the assumptions in Section 2.1, and the Logistic function is used to describe the test coverage function. Substituting Equations 2 and 3 into Equation 4:
( )
( )
1 exp( ) N m t dm t
dt A t
(5) Under the initial condition m(0)=0, the differential equation of Equation 5 is solved, and the specific form of the LTCS model can be obtained as follows:
( ) 1 exp( )
1 exp( ) t m t N
A t
(6) From Equation 6, the following conclusions can be drawn:
1) If the parameter is equal to 0, the LTCS model can be degraded to a G-O model; 2) The software failure strength function based on the logistic test coverage function is
22exp( )
) exp( )
(
W
t t A W W
t N
dt t dm
t
(7)
Software Reliability Model Based on Test Coverage Function and Imperfect Troubleshooting
NHPP Modeling Framework Based on Test Coverage Function and Imperfect Troubleshooting
The basic assumptions of the NHPP modeling framework based on test coverage function and imperfect troubleshooting are as follows:
1) The defect detection process of the software obeys the NHPP process;
2) The detected defects are immediately excluded, but a new error may be introduced in the process of troubleshooting, that is, the total number of potential defects of the software N is no longer a fixed value, but a function N along the test time. ), the so-called imperfect troubleshooting phenomenon;
3) The software failure strength is proportional to the number of residual defects;
4) The defect detection rate function is measured by the ratio of the time coverage growth rate C'(t) to the uncovered code ratio 1-C(t).
Based on the above assumptions, the following modeling framework is available:
'
( )
( ) ( )
1
C t dm t
N t m t
dt C t (8) Under the boundary condition m(0)=0, the general form of the test coverage model considering test coverage and imperfect troubleshooting can be obtained by solving the differential equation in Equation 8:
0'
( ) ( )
0
( ) ( )
1 ( )
t
B t B
t
C
m t e m N e d
C
(9)among them,
0
'
1
t t
C
B t d
C
, M0 is the boundary condition of Equation 8, and t0 is the initial time point of the software test.Imperfect Troubleshooting Function
In order to obtain a test coverage software reliability model that considers imperfect troubleshooting, the specific form of the test coverage function C(t) and the total defect function N(t) must be determined. The test coverage function selects the Logistic test coverage function. The total number of defects function N(t) has many forms of expression, and one of the more important ones is as follows:
The number of defects introduced is proportional to the number of defects, ie
( ) ( )
N t N m t (10)
Reliability Evaluation Model Based on Test Coverage Function and Imperfect Troubleshooting
According to Equation 10, the following software reliability model (ILTCS) combining test coverage function and imperfect troubleshooting can be obtained:
Substituting Equation 10 and the Logistic test coverage function into Equation 8, respectively, the following differential equation can be obtained:
( ) [ (1 ) ( )]
1 exp( )
dm t N m t
dt A t
( ) 1 exp( ) 1 exp( )
N t
m t
A t
(12)
Instance Verification
This example will compare the fitting performance of multiple software reliability models including ILTCS on three sets of real failure data sets to verify the validity and applicability of the new model in fitting performance.
1) The three sets of true failure data sets selected in this example are 'ATT', 'Ohba' and 'Wood'; 2) Select MSE (mean squared difference) as the comparison criterion for model fitting performance; 3) Six software reliability models are selected as the comparison models, namely GO, DS, IS, YW, YR, GGO.
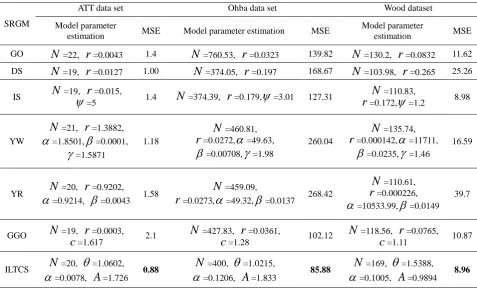
[image:5.595.59.537.318.608.2]Table 1 lists the parameter estimates and fitting results (ie, MSE values) of the seven NHPP class models (6 comparison models and ILTCS models) on the three sets of failure data. According to the calculation results of Table 1, the fitting results of the seven sets of models on each set of data were analyzed as follows.
Table 1. Parameter Estimation and Fitting Results of the NHPP Software Reliability Model on Three Failure Datasets.
SRGM
ATT data set Ohba data set Wood dataset
Model parameter
estimation MSE Model parameter estimation MSE
Model parameter
estimation MSE
GO N =22, r=0.0043 1.4 N =760.53, r=0.0323 139.82 N =130.2, r=0.0832 11.62 DS N =19, r=0.0127 1.00 N =374.05, r=0.197 168.67 N =103.98, r=0.265 25.26
IS N =19, r=0.015,
=5 1.4 N =374.39, r=0.179,=3.01 127.31
N=110.83,
r=0.172, =1.2 8.98
YW
N =21, r=1.3882,
=1.8501, =0.0001, =1.5871
1.18
N =460.81,
r=0.0272,=49.63,
=0.00708, =1.98
260.04
N =135.74,
r=0.000142,=11711,
=0.0235, =1.46
16.59
YR N =20, r=0.9202,
=0.9214, =0.0043 1.58
N =459.09,
r=0.0273,=49.32,=0.0137 268.42
N=110.61,
r=0.000226,
=10533.99,=0.0149 39.7
GGO N =19, r=0.0003,
c=1.617 2.1
N=427.83, r=0.0361,
c=1.28 102.12
N =118.56, r=0.0765,
c=1.11 10.87
ILTCS N =20, =1.0602,
=0.0078, A=1.726 0.88
N=400, =1.0215,
=0.1206, A=1.833 85.88
N =169, =1.5388,
=0.1005, A=0.9894 8.96
1. ATT data set
On the ATT dataset, the model with the best fitting effect is the ILTCS model proposed in this paper, and its MSE value (0.88) is significantly smaller than other models;
2. Ohba data set
On the Ohba dataset, the model with the best fitting effect is the ILTCS model proposed in this paper, and its MSE value (85.88) is significantly smaller than other models;
3. Wood dataset
On the Wood dataset, the model with the best fitting effect is still the ILCCS model, and its MSE value is the smallest (8.96).
4. Based on the above three analysis, the following conclusions can be drawn:
modeling process, considering the important factors in the test coverage, such as test coverage and incomplete troubleshooting, it can effectively improve the fitting performance of the model;
2) Combining the evaluation results of each group of data, the two test factors of “imperfect troubleshooting” and “test coverage” do have a significant impact on the evaluation of software reliability.
Conclusion
Based on the test coverage function, this paper carries out a software reliability modeling method based on test coverage and imperfect troubleshooting. Firstly, based on the non-homogeneous Poisson process (NHPP), a software reliability modeling framework considering test coverage function and imperfect troubleshooting assumptions is proposed. On this basis, combining the Logistic test coverage function with the imperfect troubleshooting situation, two new software reliability models (ILTCS) are proposed. On the three sets of real failure data sets, the new model proposed in this paper is compared with several classical software reliability growth models. The example verification results show that the fitting and prediction results of the proposed ILCCS model on the three sets of failure data sets are The accuracy is significantly better than other models. Therefore, considering the test coverage function and imperfect troubleshooting in the modeling process, the fitting and predictive performance of the software reliability model can be effectively improved. In addition, this paper can advance the progress of existing software reliability modeling methods, which is of great significance for improving the fitting and prediction accuracy of existing models in engineering practice.
References
[1] Li Haifeng. Software Reliability Model Considering Test Workload and Coverage[J]. Journal of Software, 2013, 24(4): 749-760.
[2] S. S. Gokhale, M. R. Lyu. A simulation approach to structure-based software reliability analysis [J]. IEEE Trans. on Software Engineering, 2005, 31(8): 643~656.
[3] A. Gana and S. T. Huang. Statistical modeling applied to managing global 5ess-2000 switch software development [J]. Bell Labs Technical Journal, 1997, 2(1): 144~153.
[4] X. Cai. Software Reliability Modeling with Test Coverage Experimentation and Measurement with a Fault-Tolerant Software Project [C].//ISSRE, 2007. Washington DC: IEEE Computer Society: 17-26.
[5] Kapur PK. Optimal price and testing time of a software under warranty and two types of imperfect debugging [J].Journal of System Assurance Engineering and Management, 2014, 5(2): 120-126.
[6] Yashwant K. Malaiya, Michael Naixin Li and etc. Software reliability growth with test coverage [J]. IEEE Transactions on Reliability, 2002, 51(4): 420-426.
[7] Li Q, Hoang Pham. NHPP software reliability model considering the uncertainty of operating environments with imperfect debugging and testing coverage [J]. Applied Mathematical Modeling, 2017, 51:68-85.
[8] X. Cai. Coverage-based testing strategies and reliability modeling for fault-tolerant software systems [D]. Hong Kong: The Chinese University of Hong Kong, 2006.
[10] Li Haifeng, Li Qiuying, Lu Minyan. Software Reliability Modeling Based on Logistic Test Coverage Function[J]. Journal of Computer Research and Development, 2011, 48 (2): 232-240.
[11] S. Gokhale and Trivedi. A time/structure based software reliability model [J]. Annals of Software Engineering, 1999, 8(1): 85-121.
[12] M. H. Chen, M. R. Lyu, and E. Wong. Effect of code coverage on software reliability measurement [J]. IEEE Transactions on Reliability, 2001, 50(2): 165-170.
[13] Pham, H., Zhang Xuemei. NHPP software reliability and cost models with testing coverage [J]. European Journal of Operational Research, 2003, 145(2): 445-454.
[14] Grottke, M. A vector markov model for structural coverage growth and the number of failure occurrences [C]. //ISSRE. Washington DC: IEEE Computer Society, 2002: 304-315.