2018 International Conference on Applied Mechanics, Mathematics, Modeling and Simulation (AMMMS 2018) ISBN: 978-1-60595-589-6
Economic Dispatch Model of Power System with Wind Power
Based on Tradable Green Certificate System
Gui-li YUAN, Pei-de LIU, Xin-chao JIA and Jin-feng DONG
School of Control and Computer Engineering, North China Electric Power University, Beijing, China
Keywords: Wind power, Tradable green certificate, Bilateral net revenue, Adaptive immune vaccine algorithm.
Abstract. In this paper, the tradable green certificate (TGC) system was introduced into the day-ahead scheduling plan of power system with wind power. Based on renewable portfolio standard (RPS), it was assumed that there was TGC trading between the power side and the grid side. Taking the maximum net revenue of both sides as the objective function, an economic dispatch model of power system with wind power was constructed. The model was solved by adaptive immune vaccine algorithm. The results indicate that the proportion of renewable energy quota and TGC price have a certain impact on the production of TGC and bilateral net revenue in the day-ahead scheduling plan.
Introduction
In recent years, more and more people are attracted by environment problems such as climate change and air pollution. Wind energy is clean energy. Relying on renewable energy support scheme, wind power has developed rapidly worldwide [1]. Currently, there are mainly two kinds of renewable energy support scheme [2]: 1) Price-Based Support: fixed-in tariff (FIT); 2) Quantity-Based Support: tradable green certificate (TGC). The FIT system plays a significant role in the early stage when China began to develop wind power. Recently, the wind power technology is becoming more mature, and the unit cost of wind power is declining. Moreover, the chance for wind power to participate in the electricity market is coming [3]. The TGC system is gradually adopted by China government.
Traditional dispatch models of power systems with wind power mostly aim at minimizing the total cost, without considering the impact of TGC system [4-6]. In Ref. [7], it proposed a carbon emission intensity rating system of power user-side and set up a TGCs distribution model, which provided a useful reference for the grid’s demand-side management. In Ref. [8], virtual power plant (VPP) was constructed and TGC system was introduced. The reference analyzed the output of different parts of VPP when the output of PV and WPP were different, which didn’t take the impact of TGC price on day-ahead scheduling plan into account. In Ref. [9], it established a low-carbon economic dispatch model based on TGC system, and analyzed the impact of TGC price on the dispatch model, which ignored the influence of different proportion of renewable energy quota.
In this paper, the TGC system is introduced into the day-ahead scheduling model of power system with wind power. The grid side is regarded as the subject of compulsory liability, which purchases TGCs from the power side in order to complete the quota. Taking the maximum net revenue on both sides as the objective function, the economic dispatch model of power system with wind power is established. The model is applied to a power system composed of 6 thermal power units and a 300 MW wind farm. The effects of the proportion of renewable energy quota and TGC price on TGC production and net revenue of both sides are analyzed.
Renewable Energy Quota Allocation and TGC Trading Process
to get TGCs from TGC market. In case of massive wind power abandonment, both sides are punished when the grid side is failing to reach the quota target. The distribution of renewable energy quota and TGC trading process are stated as follows:
1) The government initially allocates renewable energy quota to relevant grid enterprises according to the regional resource distribution and power consumption.
2) In order to meet the need of the grid side, the grid side and the power side reach a TGCs purchase agreement. It is assumed that renewable energy quota is allocated to each day further.
3) The power side makes day-ahead scheduling plan according to the forecast output of wind power, TGC price, renewable energy quota and so on. When the TGC production of power side exceeds the demand of power grid, the power side can sell the surplus TGCs in the TGC market to obtain more profits; Otherwise, both sides need to purchase TGCs from the TGC market or accept punishment.
Mathematic Model
The purpose of constructing an economic dispatch model of power system with wind power based on TGC system is to optimize day-ahead scheduling plan of power side in the early stage of the implementation of the TGC system and maximize the net revenue of both sides. Therefore, the model suggested in this paper aims to maximize the net revenue of the power side and the grid side.
Power Side Net Revenue
Net revenue devices from the differences between revenue and cost. The power side revenue consists of the electricity sales revenue and the TGC sales revenue. The cost of power side contains wind power generation cost and thermal power generation cost.
Electricity Sales Revenue. Under the TGC system, the price of wind power and thermal power both are the benchmark price for local coal-fired units, which are settled by local power grid companies. Therefore, the revenue from power side sales F1 can be expressed as follows:
1 grid w, G ,
1 1
T t
N i tt i
F C P P (1)
Where t is time series. It takes 1 h as a time interval in this paper, t=1,2,3,...,T; T=24; Cgrid represents
the benchmark electricity price of coal-fired unit; Ppower,t stands for the total planned output of the
power side at t time; Pw,t is the planned output of wind power at t time; i stands for the thermal power
units series, i=1,2,3,...N; N=6, PGi,tindicates the planned output of i-th thermal power unit at t time.
TGC Sales Revenue. The TGC sales revenue on the power side consists of three parts: 1) the TGC transaction revenue according to the bilateral agreement, which assumes that the grid side enjoys a certain degree of price discount; 2) the revenue that the power side obtains through selling the surplus on the market when TGC production exceeds the demand; 3) the penalty fee the the power side bears, when the TGC production cannot meet the demand. The power side TGC sales revenue F2 is stated as
follows:
green discount green
2
green discount punish
green, 1
quota w, G ,
1 1
T
t t
T N
t i t
t i
C k Q C G Q G Q
F
C k G C Q G G Q
G G
Q k P P
(2) Where Cgreen is the TGC price on the market; kdiscount is the discount ratio according to the bilateral
agreement; Q is the renewable energy power quota on the grid side in 24 h; G is the TGC production on the power side in 24 h; Cpunish is the penalty coefficient of power side when the supply of TGC is
Wind Power Generation Cost. Wind power generation cost includes operation cost and output deviation cost. Since there is no energy consumption during the operation of wind power, the cost of wind farm construction and fans maintenance are converted. The unit cost of the service life of fans is used as the wind power operation cost coefficient. At the same time, due to the large forecast error, the actual output of wind power will be inconsistent with the planned, and there will be overestimation or underestimation. The thermal power needs to change the output to maintain the system balance, which has negative effects on the system operation. The negative effects can be seen as wind power output deviation cost, which is calculated by the method of Ref. [11]. The uncertainty of wind power output directly affects the TGC production. Therefore, wuncertain times TGC price is adopted to
represent the overestimation and underestimation cost coefficient of wind power. The wind power cost F3 can be expressed as follows:
3 function w, uncertain green w, wr, uncertain green wr, w,
1
( )+ ( )
T t t t t tt
F C P w C P P w C P P
(3) Where Cfunction is the wind power operation cost coefficient; Pwr,t represents the actual wind power
output at t time.
Thermal Power Generation Cost
The thermal power generation cost is composed of coal consumption cost, environment cost, and spinning reserve cost. The environment cost is calculated by the operating cost of desulfurization, denitrification and dust removal system per unit of power supply [12]. The thermal power generation cost F4 is stated as follows:
2
4 G , G , 1 2 3 G , up up . up load, down up w. up load,
1 1 1
T N i i t i i t i i t
T w t t t t t i t
F a P b P c T T T P C k P l P C k P l P
(4) Where ai, bi, ci represent the coal consumption cost coefficient of the i-th thermal power unit; T1, T2,
T3 represent operating cost coefficients of unit power supply desulfurization, denitrification and dust
removal system; Cup, Cdown represent the positive and negative spinning reserve cost coefficients; kup,
kdown are the wind power fluctuation coefficients; lup, ldown stand for the system fluctuation coefficients;
Pload,t is the system load at t time.
In summary, the net revenue of power side Fpower is presented as follows:
power 1 2 3 4
F F F F F
(5)
Grid Side Net Revenue
The grid side net revenue Fgrid results from the difference between the electricity sales revenue and the
cost of purchasing electricity and TGC from the power side. Its function is described as follows:
grid consumer load, grid load, green discount
1 1
min( , ) E( )
T t
T t t t
F C P C P C k G Q Q G
(6) Where Cconsumer is the average price of electricity sold to users by the grid; E(Q-G) is the mathematical
expectation of the cost of the grid purchasing TGCs from the market or accepting punishment when the production of TGC from the power side is insufficient.
Constraints
1) Power balance constrains
G , w, load, 1
N i t t ti
P P P
min max
G G , G
down up
G G , G ,1 G
i i t i
i i t i t i
P P P
P T P P P T
(8) Where PmaxGi , P
min
Gi represent the maximum and minimum output of the i-th thermal power unit. P
up Gi and
Pdown
Gi are the upward and downward ramp rates of the i-th thermal power unit; T is the time interval.
3) Wind power generation constrains
w, wf ,
0P t P t
(9) Where: Pwf,t is the wind power forecast output at t time.
4) positive and negative spinning reserve constraints
max
G w, load, up, 1
min
load, G w, down,
1
Ni t t t
i
N
t i t t
i
P P P R
P P P R
(10)
Model Solution
The multi-objective multiplication and division are used to solve the multi-objective optimization problem, the main idea of which is to multiply or divide the sub-objective functions in the model to solve the single-objective optimization problem in the feasible region [13]. Considering the revenue and cost of the power side and the grid side, the multi-objective optimal dispatch model with the largest net revenue on both sides can be obtained as follows:
power grid
maxFF *F
(11) The adaptive immune vaccine algorithm is adopted to solve the model. The principle of the algorithm are described in Ref. [14]. The parameters are set as follows: population size: Size=50; inoculation coefficient: =0.3; evolutionary algebra: M=500; crossover probability: pc1=0.9, pc2=0.4;
mutation probability: pm1=0.2,pm2=0.01; vaccine threshold: 1=0.7,2=0.3;
Case Study
It is assumed that a regional power grid consists of 6 thermal power units and a 300 MW wind farm. The details of thermal power units are shown in Table 1. The benchmark electricity price of coal-fired unit is 360 ¥·(MW·h)-1. The grid enterprises sell electricity to the users for an average price of 750 ¥·(MW·h)-1. The penalty coefficient of power side when the supply of TGC is insufficient is 120 ¥·(MW·h)-1. Wind power operation cost coefficient is 370 ¥·(MW·h)-1 [15]. The operation cost coefficients of desulfurization, denitrification and dust removal system are 24.3 ¥·(MW·h)-1, 10.9 ¥·(MW·h)-1, 9.1 ¥·(MW·h)-1. The positive and negative spinning reserve cost coefficient is 306 ¥·(MW·h)-1 [16]. Other parameters are set as follows: kdiscount=0.9; wuncertain=1.5. The day-ahead load
[image:4.595.121.476.674.800.2]and wind power forecast output are shown in Figure 1.
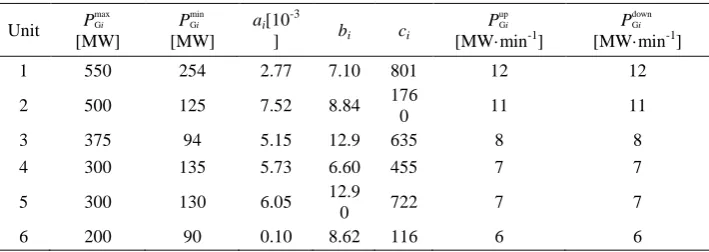
Table 1. Parameter of thermal power unit.
Unit P
max Gi [MW]
Pmin
Gi [MW]
ai[10-3
] bi ci
Pup
Gi
[MW·min-1]
Pdown
Gi
[MW·min-1]
1 550 254 2.77 7.10 801 12 12
2 500 125 7.52 8.84 176
0 11 11
3 375 94 5.15 12.9 635 8 8
4 300 135 5.73 6.60 455 7 7
5 300 130 6.05 12.9
0 722 7 7
0 5 10 15 20 25 1100 1200 1300 1400 1500 1600 1700 1800 1900 2000 load forecast Lo ad forec as t/MW Time/h 100 200 300 wind power foreast
[image:5.595.196.401.72.216.2]Wind po wer f oreca st /MW
Figure 1. Day-ahead load and wind power forecast output curve.
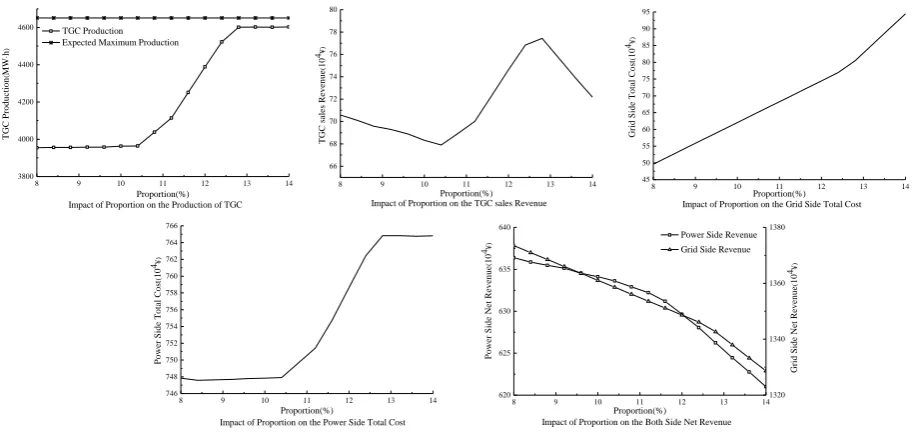
Impact of the Proportion of Renewable Energy Power Quota on the System
In order to quantitatively analyze the impact of the proportion of renewable energy power quota on the system, the price of TGC is 180 ¥·(MW·h)-1, and the simulation results are shown in Fig. 2.
8 9 10 11 12 13 14 3800
4000 4200 4400 4600
8 9 10 11 12 13 14 66 68 70 72 74 76 78 80
8 9 10 11 12 13 14 620
625 630 635 640
8 9 10 11 12 13 14 746 748 750 752 754 756 758 760 762 764 766
8 9 10 11 12 13 14 45 50 55 60 65 70 75 80 85 90 95
Impact of Proportion on the Grid Side Total Cost
Impact of Proportion on the Both Side Net Revenue Impact of Proportion on the Power Side Total Cost
TGC Production Expected Maximum Production
T GC Pr o d u ctio n ( MW · h ) Proportion(%) Impact of Proportion on the Production of TGC
T GC s ale s R ev en u e ( 10
4¥)
Proportion(%)
Power Side Revenue
Po we r Si d e Net R ev en u e ( 10 4¥ ) Proportion(%) 1320 1340 1360 1380
Grid Side Revenue
Gr id Si d e Net R ev en u e ( 10
4¥)
Impact of Proportion on the TGC sales Revenue
Po we r Si d e To tal C o st ( 10 4¥ ) Proportion(%) Gr id Si d e To tal C o st ( 10 4¥ ) Proportion(%)
Figure 2. Impact of the Proportion of Renewable Energy Power Quota on the System.
In the Fig. 2, the impact of the proportion of renewable energy power quota on the system can be decomposed into three stages: 8%~10.4%, 10.4%~12.8%, 12.8%~14%.
1) When the proportion of the quota is between 8% and 10.4%, the TGC production and the total cost of power side have a small change, witch results from that the main factor affecting TGC production is TGC price. Based on the condition that the price of TGC is 180 ¥·(MW·h)-1, the power side weighs the cost of wind power and thermal power and makes an economic dispatch. In the day-ahead scheduling plan, the TGC production is sufficient to meet the demand. Because of the price discount according to the agreement, on the behalf of the power side, the quantity of TGCs sold in the market is reduced, which causes linear descent of TGC sales revenue and power side net revenue. In addition, due to unchanged price of TGC, the grid side total cost decreases linearly and the grid side net revenue increases linearly with the proportion.
[image:5.595.69.528.305.522.2]generation cost and the power side net revenue decline accelerated. Meanwhile, as the proportion grows, the grid side net revenue increases linearly and the grid side total cost decreases linearly.
3) When the proportion of the quota is between 12.8% and 14%, the production of TGC reaches its maximum and no longer changes, which is lower than its theoretical maximum production because of the spinning reserve plan [17]. The total cost of power side is therefore no longer changing. Since the renewable energy quota cannot be met, both sides are subject to punishment. The cost of the grid side increases linearly. The TGC sales revenue and the both sides revenue decline linearly. The difference is that the grid side net revenue declines faster than before, due to the punishment or the purchase of TGCs in the market.
Impact of the Price of TGC on the System
The model established in this paper is in the seller's market, so the situation that the price of TGC is too low is not taken into consideration. It only analyses the impact of the TGC price in the range of 100 to 400 ¥·(MW·h)-1 on the production of TGC on the power side and the net revenue on both sides. The proportion of renewable energy power quota on the power grid side is 10%.
5.2.1 Impact of Prcie of TGC on the Production and Sales Revenue of TGC
The impact of Prcie of TGC on the production and sales revenue of TGC is shown in Fig. 3.
100 150 200 250 300 350 400
3600 3700 3800 3900 4000 4100 4200 4300 4400 4500 4600 4700
100 150 200 250 300 350 400
20 40 60 80 100 120 140 160 180
Estimated Maximum Production TGC Planed Production RPS Demand Quantity
TG
C
Product
ion
(MW
h
)
TGC Price(¥·(MW·h)-1
) Impact of TGC Price On the Production of TGC
TGC Sa
les Re
ven
ue
(10
4¥
)
TGC Price (¥·(MW·h)-1)
[image:6.595.143.459.317.461.2]Impact of TGC Price on the TGC Sales Revenue
Figure 3. Impact of Prcie of TGC on the Production and Sales Revenue of TGC.
From the Fig. 3, what can we learn is shown as follows:
1) When the TGC price is in the range of 100 to 150 ¥·(MW·h)-1, the production of TGC of the power side remains almost unchanged. The reason is that the economics of wind power are still worse than that of thermal power in the situation that TGC price is relatively low. When the power side formulates the daily scheduling plan, the thermal power output will be given priority under the premise of meeting the demand for the TGC on the grid side. At this time, the price of TGC increased linearly, so the TGC sales revenue increased linearly.
2) When the price of TGC is in the range of 150 to 350 ¥·(MW·h)-1, the economics of wind power gradually increase with the increase of the price of TGC. When the daily scheduling plan is being formulated, the wind power output will be gradually increased to obtain more TGC sales revenue.
In order to refine the analysis of the trend of TGC production and the TGC sales revenue when the TGC price is in the range of 150~350 ¥·(MW·h)-1. The result of the comparison of cost and revenue in the case of TGC price at 150 ¥·(MW·h)-1, 250 ¥·(MW·h)-1, 350 ¥·(MW·h)-1 is shown in Tabel. 2.
Table 2. Comparison of cost and revenue under different TGC prices.
TGC Price
[¥·(MW·h)-1]
Thermal Power
Generation Cost
[104¥]
Wind Power Cost [104¥] TGC Sales
Revenue [104¥] Operating
Cost
Output
Deviation Cost Total
150 570.5 135.7 27.8 163.5 49.5
250 568.4 160.3 34.8 195.1 99.2
[image:6.595.80.514.699.769.2]Comparing the cost of TGC price at 150 ¥·(MW·h)-1 and 350 ¥·(MW·h)-1, thermal power generation cost is reduced by 2.8·104 ¥ , and wind power cost is increased by 53.7·104 ¥. Comparatively, the cost of wind power generation has a greater impact on day-ahead scheduling plan. However, the wind power operation cost and the TGC sales revenue are linear with the production of TGC. Therefore, the wind power output deviation cost is the main factor affecting the trend of wind power output. The change of wind power output deviation cost when TGC price is between 250 ¥·(MW·h)-1 and 350 ¥·(MW·h)-1 is bigger than that when TGC price is between 150 ¥·(MW·h)-1 and 250 ¥·(MW·h)-1. As a result, the growth rate of TGC production in the range of 150 ¥·(MW·h)-1 to 250 ¥·(MW·h)-1 is gradually accelerated, and the growth rate of the other stage is gradually reduced.
3) When the price of TGC is in the range of 350 ¥·(MW·h)-1 to 400 ¥·(MW·h)-1, affected by the spinning reserve plan of the thermal power, the wind power output reaches its maximum, which means the production of the TGC reaches the maximum value. Therefore, the TGC sales revenue increases linearly with the increase of the price.
Impact of Price of TGC on the Net Revenue of Both Sides
The impact of price of TGC on the net revenue of both sides is shown in Fig. 4.
100 150 200 250 300 350 400
600 610 620 630 640 650 660 670 680 690 700
Power Side Net Revenue
Power Si
de Ne
t Reve
nue
(10
4¥
)
TGC Price(¥·(MW·h)-1 )
1280 1300 1320 1340 1360 1380 1400
Grid Side Net Revenue
Grid S
ide Net R
eve
nue
(10
4¥
[image:7.595.199.399.289.429.2])
Figure 4. Impact of TGC price on the net revenue of both sides.
It can be seen from Fig. 4 that with the increase of TGC price, the net revenue of the power side is gradually increasing, and the net revenue of the grid side is linearly decreasing. When TGC price is in the range of 100 ¥·(MW·h)-1 to 200 ¥·(MW·h)-1, the production of TGC is lower, and the net revenue growth rate of the power side is slower. When the price of TGC is in the range of 200 ¥·(MW·h)-1 to 350 ¥·(MW·h)-1, the production of TGC is higher. And the higher TGC price is, the faster the net revenue of the power side grows. When TGC price is in the range of 350 ¥·(MW·h)-1 to 400 ¥·(MW·h)-1, production of TGC reaches the maximum value at this time, so the net revenue of the power side and TGC price increase linearly. The grid side only needs to meet the renewable energy power quota, so its net revenue decreases linearly with the linear increase of the TGC price.
Summary
This paper introduces the TGC system into the daily scheduling plan model of power system with wind power, and combines the RPS system to establish an economic dispatch model, which takes the maximum net revenue of both sides as the objective function. As a result of simulation, the impact of large-scale wind power access to the grid on the economics of power systems based on the TGC system is comprehensively analyzed, which provides a useful reference for power system dispatchers.
References
[1] Zhao Jianhua, Zhang Dian, Xia Huaimin, et al. Research on consumption problem and generation·side pricing mechanism of wind power in Chma [J]. Water Power, 2017, 43(10).
[3] An Xuena, Zhang Shaohua, Li Xue. Equilibrium analysis of oligopolistic electricity markets considering tradable green certificates [J]. Automation of Electric Power Systems, 2017, 41(9):84-89.
[4] Zhai Junyi, Ren Jianwen, Zhou Ming, et al. Multi-time scale fuzzy chance constrained dynamic economic dispatch model for power system with wind power [J]. Power System Technology, 2016, 40(4):1094-1099.
[5] Lu Zhigang, Guo Kai, Yan Guihong, et al. Optimal dispatch of power system integrated with wind power considering virtual generator units of demand response and carbon trading [J]. Automation of Electric Power Systems, 2017, 41(15):58-65.
[6] Yang Jiaran, Wang Xingcheng, Sui Lintao, et al. Multi-objective optimal scheduling of wind integrated power systems with hybrid intelligent algorithm[J]. Power System Protection and Control, 2017, 45(11):21-27.
[7] Luo Yifan, Gong Yu, Jiang Chuanwen, et al. Study on carbon emission intensity rating of power consumer side and green power certificates distribution[J]. Water Resources and Power, 2015(10):199-203.
[8] Lazaroiu G C, Dumbrava V, Roscia M, et al. Energy trading optimization of a virtual power plant on electricity market[C]// International Symposium on Advanced Topics in Electrical Engineering. IEEE, 2015:911-916.
[9] Xu Jiguang. Low-carbon economic dispatching for power grid integrated with wind power system based on the green certificate trading mechanism[J]. Electric Power, 2016, 49(7):145-150.
[10] Hasani-Marzooni M, Hosseini S H. Trading strategies for wind capacity investment in a dynamic model of combined tradable green certificate and electricity markets[J]. Iet Generation Transmission & Distribution, 2012, 6(4):320-330.
[11] Zhang Chengfei, Yuan Yue, Zhang Xinsong, et al. Day-ahead dispatching scheduling for power grid integrated with wind farm considering influence of carbon emission quota [J]. Power System Technology, 2014, 38(8):2114-2120.
[12] Cui Yang, Zhou Haitao, Yan Gangui, et al. Combined dispatching of wind and thermal power generation considering environmental cost and network constraints [J]. Power System Technology, 2017(11):3457-3462.
[13] Deng Xue, Zhao Junfeng, Li Rongjun. Bi objective portfolio selection model based on multiplication and division of sub objectives [J]. Statistics & Decision, 2011(18):167-169.
[14] Yuan G L, Xue Y G, Liang Q J. The Design of Adaptive Immune Vaccine Algorithm[J]. Advanced Materials Research, 2011, 308-310:1094-1098.
[15] Li Zhixue, Wang Huanhuan, Ling Li. Research on the relationship between production cost level and price subsidy in Chinese wind power enterprises[J]. Price: Theory & Practice, 2017(1):70-73.
[16] Zhang Guoquan, Wang Xiuli. Study on benifits and costs of spinning reserve capacity in power market[J]. Automation of Electric Power System, 2000, 24(21):14-18.
2018 International Conference on Applied Mechanics, Mathematics, Modeling and Simulation (AMMMS 2018) ISBN: 978-1-60595-589-6
Mission Effectiveness Modeling of Remote Sensing Satellite System
Xin-lin DE, Jian JIAO* and Yi-peng ZHU
School of Reliability and Systems Engineering, Beihang University, Bejing, China
*Corresponding author
Keywords: Modeling, Remote sensing satellite. Mission effectiveness.
Abstract. With the update of remote sensing technology, remote sensing satellite has been applied to daily life of people. The ability of satellites to accomplish mission has become the focus of attention, this paper presented a method for modeling and analyzing mission effectiveness of remote sensing satellite system. Based on the discussion of the mission and structure of the satellite, we use the ADC model to evaluate the mission effectiveness of satellite. The state transition probabilities of the satellite in the model are calculated by continuous Markov chain with discrete states continuous time. Finally, the validity of the method is demonstrated by a case study.
Introduction
Effectiveness is an important index of system, and has been studied in many industries [1-4]. The effectiveness of a system, in short, refers to the system’s actual ability to complete an intended mission [5]. Modern remote sensing satellites have the characteristics of multi-function of structure, miniaturization and integration, so that the redundant design and the number of hardware are limited to a certain extent in volume, but the performance requirements of the entire satellite are not reduced relative to the traditional satellites. How to accomplish the mission efficiently with the existing resources has become a challenge. At present, there is not enough attention paid to the research on the effectiveness evaluation of remote sensing satellite. Although some scholars [6-10] have studied the effectiveness evaluation of remote sensing satellite for specific functions, there is still a lack of research on the effectiveness evaluation of remote sensing satellite. On the other hand, effectiveness evaluation has been widely used in the fields of weaponry, machinery manufacturing and civil aviation. According to the characteristics of different industries, many methods to evaluate the effectiveness of the system have also been proposed. The introduction of effectiveness evaluation technology in remote sensing satellite system can reflect the ability of the system to a great extent.
This paper focused on the effectiveness evaluation of remote sensing satellite. In Section II, the characteristics of remote sensing satellite are analyzed; in Section III, an evaluation model of effectiveness is proposed based on ADC model combining with Markov model. A case study is given in Section IV, and some conclusions are summarized in Section V.
Remote Sensing Satellite Characteristics Analysis
In recent years, more and more attention has been paid to satellite remote sensing technology. Many new types of remote sensing satellites have been designed and the requirements for satellite missions are getting higher continuously. How to ensure remote sensing satellite to accomplish its mission effectively and efficiently and improve its effectiveness has become a major challenge for satellite designers. To evaluate effectiveness, a characteristics analysis of remote sensing satellite and its mission is needed.