Spatial Determinants of CBD
Emergence: A Micro-level Case Study on
Berlin
Ahlfeldt, Gabriel M. and Wendlan, Nicolai
University of Hamburg, ETH Zurich
July 2008
Online at
https://mpra.ub.uni-muenchen.de/11572/
Spatial Determinants of CBD Emergence:
A Micro-level Case Study on Berlin
∗
Abstract: Over the recent decades, scholars and planning practitioners have developed strategies for directed urban decentralization, which aim at the optimization of urban commuting patterns by allow-ing households to locate closer to job opportunities. However, given ongoallow-ing changes in the socio-economic framework, households are becoming less likely to choose their residences with respect to location of the workplace. In order to optimize trip patterns with respect to public transport and to simultaneously promote sustainable urban growth, we therefore suggest a strategy of Directed Urban Concentration, which purports the generation of very strong (employment) sub-centers, if not multiple central business districts (CBDs), as a complementary strategy to established approaches of mixed and multifunctional land use. In an empirical analysis we show that in the case of Berlin, Germany, the emergence of the second CBD during the first half of the past century was largely driven by market access generated by rail-based public transport. Our results suggest that city planners could successful-ly promote the emergence of new urban economic cores with focal transport nodes that are equiva-lently well-connected to their hinterlands as well as to the existing CBD.
Keywords:Directed urban concentration, urban transport, market access, urban planning, Berlin JEL classification:N74, N94, R28, R33, R41
Version: July 2008
1
Introduction
One of the key urban planning challenges of the 21st
century towards sustainable urban growth is the reduction of the overall length of urban residents’ trip pat-terns and a more prominent role for public transport in the modal split. During
♣ University of Hamburg, Von-Melle-Park 5, 20146 Hamburg.
fon +49 40 42838 5569/4622, fax +49 40 42838 6251, [email protected]
♦ KOF – Swiss Economic Institute ETH Zurich. [email protected]
∗ We thank, Stephen Redding, Daniel Sturm and Nikolaus Wolf for excellent research
the second half of the last century, the traditional monocentric city gradually dis-appeared in many developed parts of the world while sub-centers and edge cities increasingly account for employment opportunities and provision of retailing and entertainment services. While on one hand the maintenance of compact econom-ic activity clusters, as provided by organeconom-ically grown CBDs, is vital for further eco-nomic growth, on the other hand traffic congestion within overcrowded central areas still imposes high social cost in the form of increased commuting costs, higher energy consumption and ongoing social exclusion.
While most economists tend to focus on weighing the benefits of agglomeration economies against the cost of congestion, disregarding the numerous implica-tions for social and urban life-style, various city planners concentrate on the de-velopment of decentralized, safe, attractive and lively areas with a slighter busi-ness density. Choosing an interdisciplinary perspective, we suggest a concept of
Directed Urban Concentration that combines both perspectives and puts as
equiv-alent objectives economic growth as well as sustainable development and livable urban environments on the planning agenda.
We exploit a unique natural experiment to investigate how areas in immediate proximity to new major transport nodes may become subject to initial advantag-es whereupon agglomeration forcadvantag-es and cumulative causation lead to the emer-gence of strong activity clusters, or even alternative CBDs. Berlin, Germany, represents a frequently cited example of a large European metropolis suffering only to a minor extent from problems related to traffic congestion.1
While in Ber-lin there is a relatively high proportion of mixed use (SENATSVERWALTUNG FÜR STADTENTWICKLUNG BERLIN, 2007) which, according to the relevant planning theories, might prevent excessive concentration of economic activity, there is another striking particularity that accounts for the relaxed traffic situation: a nearly perfect duo-centricity.2
We conduct a detailed micro-level case study
1
Relevant information available at www.stadtentwicklung.berlin.de
2
ing on the area around the Kurfürstendamm that is unique in the level of geo-graphic disaggregation in a historical context. Our results suggest that the emer-gence of Berlin’s duo-centric structure was essentially promoted by market access generated by rail-based public infrastructure, indicating that economic activity within focal areas may be fostered by means of a well-directed development of public transport infrastructure. While section 2 provides a detailed overview of the perspectives of urban economics and planning studies on the related spatial dynamics, it is followed by a description of collected data sets and the empirical strategy. Based on the idea of Directed Urban Concentration developed in section 2 and our empirical findings presented in section 4, section 5 concludes our con-tribution to the discussion on how to achieve sustainable urban growth.
2
Planning the Post-Monocentric City
2.1
New Economic Geography and Urban Economics Background
Common explanations for the uneven distribution of economic activity across space refer to differences in location endowments (BLOOM & SACHS, 1998) or the quality of institutions (ACEMOGLU, JOHNSON, & ROSINSON, 2001), while the new economic geography literature emphasizes the role of market access in shap-ing patterns of economic activity (DAVIS & WEINSTEIN, 2002; KRUGMAN, 1991).3
Accordingly, regions may benefit from good access to other regions’ mar-kets due to a reduced cost for firms supplying customers and the raised availabili-ty of goods for consumers (CRAFTS, 2005). Recent empirical evidence confirms theoretical implications showing that access to regions is of causal importance
3
for the economic performance of regions (REDDING & STURM, 2008).4
It has been shown that these principles also apply to an urban scale and that access to re-gions (AHLFELDT, 2008) as well as to intra-urban markets (AHLFELDT, 2007) shape spatial patterns of economic activity within cities.
Considering internal and external scale economies,5
transport costs and the mutual attraction of business and customers, processes of cumulative causation may lead to a stable equilibrium where income and economic activity concentrate in regional (or urban) agglomerations. In contrast to the view that fundamentals such as institutions or endowments determine patterns of economic activity, new economic geography models predict that the steady-state distribution depends on a range of parameter values as well as on initial conditions and historical accident. This kind of path dependency is also referred to as “hysteresis” (ARTHUR, 1994; BALDWIN & KRUGMAN, 1989; DAVID, 1985). REDDING, STURM & WOLF (2007) provide compelling evidence for the existence of multiple equilibria in industrial location.
Early urban economics (ALONSO, 1964; MILLS, 1972; MUTH, 1969) assumed eco-nomic activity within cities to be completely concentrated in the urban core. However, over the course of the last decades urban economic research has made considerable advances in theoretically explaining the existence of complex poly-centric structures (LUCAS & ROSSI-HANSBERG, 2002). ANAS & KIM (1996) develop a general equilibrium model of urban land use that predicts multiple equilibria in
4
Empirical tests also reveal a significant spatial correlation between regional wage levels and market access for the U.S. (HANSON, 2005), Europe (NIEBUHR, 2006), Germany (BRAKMAN, GARRETSEN, & SCHRAMM, 2004) and Italy (MION, 2004). In a cross-country analysis, REDDING & VENABLES (2004) provide evidence for the geography of market access being a significant determinant for worlds’ income differentials. HEAD & MAYER (2004) and OVERMAN, REDDING & VENABLES (2003) provide surveys on the empirical literature.
5
production agglomeration depending on agglomeration and access. Stronger ag-glomeration leads to fewer and bigger urban cores while with the increasing cost of congestion, the number of centers increases. ANAS (1992) shows how a mono-centric equilibrium may become unstable after a city’s population exceeds a cer-tain threshold. As a result a duo-centric equilibrium emerges following accident migration. These theoretical implications are in line with tendencies of urban de-centralization occurring in developed countries while in many mega-cities, par-ticularly in developing countries, traffic nightmares are still observed within the CBDs (BOARNET, 1994). The case of Los Angeles even demonstrates that prox-imity to the urban core may become an inferior indicator for attractiveness of lo-cation compared to several smaller sub-centres (HEIKKILA et al., 1989).
Hence, from the existing urban economics and new economic geography litera-ture we conclude that following increasing population and congestion a mono-centric urban equilibrium may become unstable. Given attractive alternatives, sub-centers are expected to emerge at those locations that exhibit a comparable advantage in terms of market access. Initial advantage together with processes of cumulative causation may then lead to path dependent development and a new spatial equilibrium where the significance of new centers depends on the degree of their effective accessibility.
2.2
Directed Urban Decentralization
1960s the conceptual idea of polycentric urban areas gained wide consideration (KLOOSTERMAN & MUSTERD, 2001) owing to further pioneer work (FRIEDMAN & MILLER, 1965; LYNCH, 1961; LYNCH & RODWIN, 1958; WURSTER, 1963). As for the main reasons of spatial reorganization within complex systems, the literature offered the same combination of influential forces as formalized by the urban economists decades later.
The idea of cycles existing in the evolution of urban spatial structure is discussed by CHESHIRE (1995). Accordingly, following a period of rapid urban growth and an increasing concentration of economic activity within urban cores up until the mid 20th
century, the second half was mainly characterized by processes of urban de-centralization. While Cheshire finds signs of re-urbanization within continental European metropolises, many mega-cities in developing countries are currently experiencing the first stage of rapid urbanization, where high congestion leads to reduced mobility, rising transport costs and an overall economic inefficiency (GORDON, KUMAR, & RICHARDSON, 1989; NEWMAN, 1996). Increasing commut-ing costs furthermore create social inequity and thus possible social exclusion (NEWMAN, 1996), which contradicts one of the core principles of sustainable de-velopment (HAUGHTON, 1997; TU & SHI, 2006).
The acknowledgment of changing economic principles going hand in hand with rapidly developing transport modes after World War II, and an overall shift within social life and therefore changing trip patterns, required new forms of defining and directing the ongoing processes of decentralization in growing as well as in shrinking regions of developing and developed countries (CHAMPION, 2001; DA-VOUDI, 2003; KLOOSTERMAN & MUSTERD, 2001). In order to avert the numerous disadvantages linked to undirected spatial reorganization and the possibly nega-tively-associated resulting urban sprawl, well directed planning should foster the emergence of more efficient land use patterns (BURCHELL & MUKHERJI, 2003; CARRUTHERS & ULFARSSON, 2003; NELSON et al., 1995; STURM & COHEN, 2004). Based on this principle the spatial planning concepts of Multifunctional Land Use,
New Urbanism, Smart Growth, and the Compact City have gained considerable
1997; DE ROO & MILLER, 2000; JENKS & BURGESS, 2000; JENKS, BURTON, & WIL-LIAMS, 1996). Besides manifold sets of detailed planning agendas they all aim at the efficient and sustainable development of urban designs emphasizing an overall compact urban form and good accessibility by means of public transport infrastructure. Various social and economical synergy effects in areas characte-rized by higher densities and mixed use may lead to an overall improvement in economic performance, increased social equity and to a more modest consump-tion of resources (NEWMAN & KENWORTHY, 1989; POUYANNE, 2005; VREEKER, 2004; WILLIAMS, 1999; WILLIAMS, BURTON, & JENKS, 2000).
2.3
Directed Urban Concentration
One of the common principles of the abovementioned planning concepts, which we subsume under the main idea of directed urban decentralization, is to optim-ize overall trip patterns by bringing places of work and residences closer together. In this context it is important to note that, despite the theoretical prominence, commuting time and cost in practice appear to play only a limited role in deter-mining households’ residential location choice. Empirical results suggest that cross-commuting accounts for the larger share of overall commuting compared to the commuting “up the land gradient” (GIULIANO & SMALL, 1993; HAMILTON & ROELL, 1982; SMALL & SHUNFENG, 1992). This finding contradicts theoretical im-plications as households could maximize utility by interchanging houses and hence reduce commuting time without having to face higher rents. Common ex-planations refer to idiosyncratic preferences for local mixes of amenities, senti-mental attachments, constraints in location choice of two-worker households and frequent job changes leading to the consideration of a wider array of job op-portunities rather than a particular job location (ANAS, 1992). Ethnical segrega-tion, which is one of the key issues in urban social sciences (CUTLER & GLAESER, 1997), may also account for residents choosing locations that deviate from the economic optimum (WALDFOGEL, 2008).
the provision of an attractive alternative location for dense business agglomera-tion represents an intuitively plausible strategy. Still, having economic activity concentrated to a large extent in focal locations, employees’ and customers’ access to business activity can more easily be organized by means of public mass transport compared to a situation where economic activity is widely dispersed across a space. Hence, the considered creation of duo-centric spatial structure (or at least the generation of very strong sub-centers) may represent a pragmatic approach for the optimization of residents’ trip patterns, at least when authori-ties also aim at improving the competitiveness of public relative to individual transport. Referring to the abovementioned model developed by ANAS (1992), the provision of an attractive, highly accessible alternative location to the existing CBD could represent an incident that facilitates the directed transformation into a stable duo-centric equilibrium. Hence, considered planning could encourage new (sub-) centers to emerge at designated locations before congestion in the existing cores becomes unbearably large.
However, we would like to emphasize that such a strategy may feasibly be em-ployed in addition to – not instead of –mixed or multifunctional land use strate-gies. There are certainly numerous services regarding daily demand (e.g. for shop-ping and entertainment) that represent perfect substitutes and are not subject to very large scale economies, and hence may efficiently be provided locally in more peripheral areas of mixed use. Experiences in the city of Toronto also indicate that downtown population intensification in mixed areas surrounding the very urban core – which reads similar to the ideas of Multifunctional Land Use – reduces the need for commuting facilities even in times of growing downtown office space and ongoing downtown employment agglomeration (NOWLAN & STEWART, 1991). In contrast, as the experiences of most U.S. cities during the second half of the 20th
century demonstrate, growing areas of widespread low-density develop-ments not only increase overall commuting length, but also lead to a decline in the competitiveness of public transit (BAUM-SNOW & KAHN, 2005).
3
Data, Methodological Issues and Empirical Strategy
In order to validate our assumptions and affirm suggested planning strategies, the spatial transformation of Berlin from a dense monocentric structure to a state of commonly accepted duo-centricity offers a unique natural experiment. Collect-ing a one-of-a-kind historical data set provides the rare opportunity to historically track the evolution of market access generated by means of public railway trans-port over the key-period of network implementation.
Firms tend to outbid households in competition for central locations since the attractiveness of commercial areas critically depends on access to consumer and labor markets. In equilibrium markets, any increase in location attractiveness per-ceived by market participants due to improved accessibility will capitalize into land values of designated business areas, and hence become observable. There-fore, for the purposes of our empirical analysis, it was indispensable to meet both requirements, identifying designated business blocks within our observation area (3.3) and collecting the corresponding land values assigned to them.
Our empirical strategy basically consists of comparing the evolution of land valu-ation and access to markets within the study area in order to allow for conclu-sions on a casual relationship. The next sub-sections introduce our data and indi-cators of economic activity, which we employ in our empirical setup discussed in section 3.3.
3.1
Data
The analytical frame is defined by a georeferenced GIS map of the whole of Berlin based on the Urban and Environmental Information System of the Senate De-partment of Berlin (2006). It divides the area of approximately 892 km2
into 15,937 statistical blocks, which represent the most disaggregated level for data provided by the Senate Department. With a median surface area of less than 20,000 m2
the city’s railway network. However, population data for this level of disaggrega-tion covering the whole research period from 1875-1936 could not be retrieved. The most disaggregated data available refer to the wider areas of 94 historical villages and adjacent communities. They were collected from Leyden (1933) and the Statistical Yearbook of Berlin (STATISTISCHES AMT DER STADT BERLIN, 1878-1939) and were found to be consistent across sources.
Notwithstanding, assuming the population being equally distributed within the built up area of village o, we approximate block i's population (Pi) with respect to its proportion at the total village’s built up area Do
∑ , (1)
where Di represents the total built up area within block i in m
2
and Po is the total population of village o.
Processing historical cartographic maps made it possible to obtain the relevant information. For this purpose, they needed to be scanned and georeferenced. Fur-ther steps included digital editing, color extraction and the assignment to Berlin's official GIS map. The subsequent application of standard GIS software allowed for calculating and aggregating the areas of interest. In a next step, we gradually traced back the evolution of the city’s complete public railway network over the course of our study period in order to form digital maps.6
In line with the available census data, which offer population data for approximately every five years, the work was carried out for the observation period from 1875 to 1936. That informa-tion had to be gathered as a prerequisite for later modeling of centrality indica-tors (3.2).
Since we are dealing with historical data sets, the collection of the abovemen-tioned information regarding land values and the location of designated business blocks within the observation area proved to be sophisticated. Bruno AUST (1986)
6
Relevant information and network plans can be found at
http://www.bahnstrecken.de/indexf.htm; http://www.bahnstrecken.de/bse.htm;
rendered outstanding services to all subsequent Berlin related research by collect-ing invaluable information regardcollect-ing historical land uses. This way, by extractcollect-ing the relevant blocks and digitally processing them, the areas of interest could be properly identified.
As for the collection of corresponding land values, two sources proved to be es-sential. Firstly, maps drawn by Gustav MÜLLER (1890-1910) indicating land values of Berlin’s inner city on block level were digitally processed and the relevant data digitized. Secondly, street directories were used, which provided land values on street level (KALWEIT, 1928, 1936). The data appendix offers a more detailed de-scription on the process of value generation and assignment to subject blocks.
3.2
Market Access Indicators
In the economic geography literature, a long tradition dating back to HARRIS (1954) models agglomeration forces by calculating market access indicators as the distance-weighted sum of population. For instance, if Pi is the population of block i, then
)
exp( ij
j j
i Pop a d
PP =
∑
− (2)is the population potentiality (PPi) of block i, where Popj is the population of block
j, a is a distance decay factor implicitly determining transport costs, and dij is the straight-line distance between the geographic centroids of blocks i and j. Because we deal with blocks of different sizes, a basic concept of empirical economic geography (CRAFTS, 2005; KEEBLE, OWENS, & THOMPSON, 1982) is employed to generate a block internal distance measure based on surface area, which can be used to determine the self-potential:
dii=
1 3
blockareai
Pi (3)
This indicator represents a fairly intuitive measure for urban centrality in a broad sense from a business perspective, since regions with high population potentiality maximize access to employees and customers.
However, accessibility within metropolitan areas is essentially determined by metro-rail and suburban railway networks. AHLFELDT (2007) develops a multi-level market access indicator allowing for spatial aggregation of population on the basis of public transportation networks. It considers both distance to stations and the centrality of stations within the network as well as the effective distribution of population on micro-level and hence, for the purposes of our research, draws a more comprehensive picture of rail-based centrality than standard approaches exclusively relying on distance to railway stations (BOWES & IHLANFELDT, 2001; GATZLAFF & SMITH, 1993; GIBBONS & MACHIN, 2005; GRASS, 1992; MCMILLEN & MCDONALD, 2004). All 15,937 statistical blocks of Berlin are related to each other by combined network distances allowing for distinct travel costs for train rides and walks. Assuming that residents use the nearest station, choose the shortest network connection within the combined metro and suburban railway network, and leave the railway system at the station located closest to their destination, the generation of population potentiality basically consists of three steps.
Firstly, the population potentiality of each station within the network is the dis-tance-weighted sum of the surrounding blocks’ population:
SPm= Pjexp
j
∑
(−b dmj), (4)where SPm is the population potentiality, respectively market access, of station m,
Pj is the resident population of block j, b is a distance decay factor, and dmj is the straight-line distance between station m and block j.
∑
− =m m sm
s SP a d
NSP exp( ), form ≠s (5)
where NSPs is the population potentiality of station s, which can be thought of as the potential for a resident who lives immediately adjacent to station s and wishes to commute by rail-based public transportation. Parameter a, again, de-termines spatial decay and dsm is the shortest network distance between stations s and m. Stations’ self-potentials are not considered since residents travelling within the catchment area of the same station will obviously not take the train.
Finally, network station potentiality has to be discounted by the walking distance from the station to a business location in order to account for customers’ or em-ployees’ transport costs:
) exp( is
s
i NSP b d
RPP = − , (6)
where RPPi is the population potentiality generated by the urban railway network at business block i and dis is the distance from block i to the nearest station s. Combining equations (4) – (6), employment potentiality can be written as:
(
exp( ))
exp( ))
exp( sm
m j j mj
is
i b d P b d a d
RPP = −
∑ ∑
− − , form ≠s (7)Fig. 1 Sp
Source: AH
3.3
Emp
Given tha areas lega tivity and Relying o of our ob impressiv as to the whether a
The relev gated at t tion abov area exhi tive locat focus on role of ac pared ove scheidpla Kudamm area. The
patial Decay
HLFELDT (200
pirical Stra
at firms ou ally assign d the attrac
n historica bservation
ve increase next stron and when t
vance of m two stages ve to test w
bited an in ions that m the heart o ccessibility
er time. Ku atz, Kurfürs Area 3 co e data appe
y Paramete
07)
ategy
tbid each o ed to busi ctiveness o al data on s period the e in signific ngest sub-c the new ce
market acce s. First we whether pr nitial advan may explai
of the new at a micro udamm Are stendamm over consid
endix prov
ers and Im
other for lo ness use to of a busines standard la e location o cance comp centers. We
enter emer
ess for the employ acc receding th ntage in te n the emer w urban cor o-level. The ea 1 is lim
and Tauen derably lar
ides a ratio
plicit Decay
ocation, we o be a feas ss location and values of the
City-pared to th e track land ged as a se
emergenc cessibility he concent erms of acc
rgence of t re around erefore thr ited to the ntzienstras ger areas onale for th
y Function
e assume la sible indica n within an , we show -West of B he historica d gradient elf-sufficien
ce of the n indicators ration of e cessibility c the new ur
Breitscheid ree areas a e very urba sse, while
of Berlin’s he definitio
s
and valuat ator for eco
urban env that over Berlin expe al urban co
over time nt core. ew center described economic a compared t ban core. S dplatz to a
re defined an core aro Kudamm A western d on of these
tion within onomic ac-vironment. the course rienced an ore as well to identify
visualizes them. We track differences over time by application of simple differ-ence estimation:
log(Ybt)=dt a+Kudamm1b×dt b+Kudamm2b ×dt c+εbt (8)
where Ybt either stands for standard land values (SLV), population potentiality (PP) or rail population potentiality (RPP) of business block b in period t, dt is a full set of time dummies and a, b and c represent the sets of coefficients to be estimated. εbt is an error term satisfying the usual conditions. Kudamm1 and Kudamm2 are dummy variables denoting business blocks within Kudamm Area 1 and Kudamm Area 2 respectively. We use a pooled sample of data on SLV for the years 1890, 1896, 1900, 1905, 1910, 1929 and 1936, while RPP data is available for five-year intervals from 1875 to 1930 with the exception of 1915. 1936 data was con-structed using the 1936 railway network and the linearly interpolated population of 1933 and 1939. For PP, additional data is available for 1871 when the whole area had not been connected to the railway network yet.
Since our sample is restricted to Kudamm Area 3, coefficients on interactive terms give average block differences between Kudamm Area 1 and Kudamm Area 2 and Kudamm Area 2 vs. Kudamm Area 3 respectively for all available years. As we use a log-linear specification, estimated coefficient d can be interpreted as percen-tage differences (PD) according to a well-established formula (HALVORSEN & PALMQUIST, 1980; KENNEDY, 1981).
PD=100 exp((d−var(d)
2 )−1) (9)
4
Results
(KRAUSE, 1958; LEYDEN, 1933). This development started-off the ongoing ten-dency towards Berlin’s duo-centricity.
4.1
Market Access as Spatial Determinant for emerging Sub-Centers
The powerful dynamics of spatial reorganization triggered by a rapid population growth during the 19th
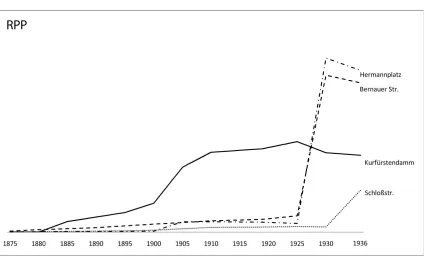
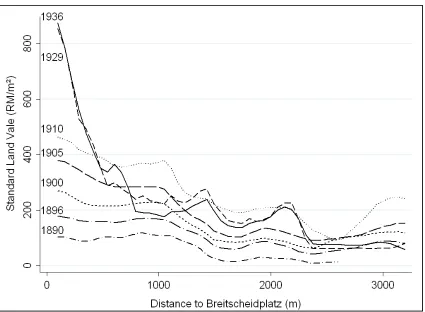
century led to a general gain in the importance of slightly decentralized sub-centers in Berlin. Figure 2 shows the general land value devel-opment for representative business blocks within the most important sub-centers.7
After 1895 the Kudamm started overtaking the other sub-centers and extended its lead from 1910 on. Given its evident dominance regarding land value devel-opment, the objective to unravel the relevant determinants for the emergence of economic activity clusters was restricted to that area. In terms of relative centrali-ty quantified by the abovementioned indicator (RPP) this area demonstrated a remarkable initial advantage, which emerged after 1880 and was strengthened during the first decade after the turn of the century owing to far-reaching exten-sions of the railway network (Figure 2).
7
Fig. 1 St Notes: Au Apparent accompan path-dep the most tive declin
Fig. 2Ra
Notes: Au
andard Lan
uthors` own c
tly, emergi nied by su
endent de important ne in acces
ail Potentia
uthors` own c
nd Values f
calculations.
ng agglom upplement velopment t center bes ssibility afte
ality for Imp
calculations.
for Importa
meration fo tary ampli t so that t sides the h er 1925.
portant Su
ant Sub-cen
rces togeth fications o the Kudam historical CB
b-centers nters
her with cu of the net mm area m BD, despite
umulative twork, esta maintained
e a conside
[image:19.595.115.543.91.317.2] [image:19.595.116.542.500.757.2]-The impo even bett beginning tivity for Kudamm While the western a lic infrast tion adva even repr access. Th agglomer the impre 1920s.
Fig. 3Ku
Notes: Ind C 8 In order tation of lue and r
ortance of ter demon g of our ob
hundreds area relati
e general s and south tructure fu antages an resented th he perceive ration force essive eco urfürstenda dices represe CBD. Authors to represent f sub-centers railway poten the Kudam strated by bservation
of years. F ive to the h
shift in ma western di rther bene nd therefor he most ad ed attractiv
es may hav nomic grow
amm vs. Hi
ent ratios of ` own calcul
the CBDs pe s. The one bu ntiality until
mm region directly co period had igure 3 vis historical C
rket access istricts, the efited the K re attractin dvantaged veness app ve led to s wth within
istorical CB
f Kudamm v ations.
erformance th usiness block 1936 was ch
n within th omparing i d already b sualizes tre
BD.8
s is owed t e undertak Kudamm a ng busines d area in te parently cap
pillover eff n Kudamm
BD
values to the
he same stra with the bes osen.
he whole a t to the ol een the ce ends in PP,
to the incre en investm rea, expos ss to a larg erms of ne
pitalized in fects, whic m3 region
e respective
ategy was ap st performan
area of Ber d CBD, wh enter of eco
RPP, and S
easing pop ments rega
ing remark ge extent. etwork-bas
nto land va ch at least until the e
values in th
plied as for t nce regarding
rlin can be hich by the onomic
ac-SLV for the
pulation of rding pub-kable loca-In 1910 it ed market alues while supported end of the
he historical
-Considering land value trends until 1910, which were in line with those for the other major sub-centers, the large investments into connectivity of the Kudamm area are surprising since, intuitively, one would expect the focal node of a trans-port network within the existing core of economic activity. From the historical center, the other major sub-centers, Hermannplatz and Bernauer Strasse, could also have been connected more easily. However, despite their shorter distance from the historical center, these centers were not connected until the end of the 1920s, almost 30 years after the Kudamm, although metro lines would have run through very densely populated areas. Even the obvious underground line below the traditionally most important retail and commercial boulevard Friedrichstrasse was not developed until the mid 1920s. Anecdotic evidence also shows that the selection of the first metro rail paths was determined exogenously to urban eco-nomic development (ERBE, 1987). The extension of preexisting railway tracks took place through widely undeveloped areas, which led to the effect of a perceived increasing attractiveness created by improved accessibility. The declared inten-tion of property developers was to promote further investments and building (BOHM, 1980). Taking together these indications and the evident time lag, it ap-pears more likely that causality runs from accessibility to economic development rather than the other way round.
Fig. 4Kernel Smoothed Gradients for Kudamm Area
Notes: Authors` own calculations. Kernel is Epanechnikov.
4.2
Initial Advantage in Market Access, a Micro-Study
From comparison to other major sub-centers and the traditional CBD we know that during the early years of the 20th
[image:22.595.117.542.109.421.2]Note, that our sample is restricted to all business blocks within Kudamm Area 3 and all blocks within Area 1 also belong to Area 2. Estimates therefore yield dif-ferences between areas 3 and 2 and areas 2 and 1 respectively.
While in 1875 PP already showed a remarkable advantage for area 1, it still did not capitalize into corresponding SLV.9
The continuously decreasing PP of area 1 relative to area 3 until 1936 is owed to an rapid population growth within the broader area, which before was unpopulated in most parts. In 1890 land values of Kudamm Area 1 had exceeded Area 2 and Area 3 by 55.7%, which underlines a relatively high attractiveness from the beginning of the Kudamm development. Preceding, the core region had gained an advantage in RPP of 112.1% compared to Area 3, following the inauguration of the east-west suburban railway line in 1882 (Stadtbahn).
9
Tab. 1 Empirical Results
(1) Log(SLV)
(2) Log(PP)
(3) Log(RPP)
Kudamm1 x 1871 (3.97) 0.2985***
Kudamm1 x 1875 (5.52) 0.2834*** (-5.29) -1.2536***
Kudamm1 x 1880 (3.89) 0.2834*** (-4.2) -1.0913***
Kudamm1 x 1885 (3.84) 0.2723*** (3.96) 0.5651***
Kudamm1 x 1890 (4.65) 0.4474*** (3.42) 0.2061*** (3.93) 0.5558***
Kudamm1 x 1895/1896 (6.18) 0.3448*** (4.32) 0.1626*** (3.68) 0.4969***
Kudamm1 x 1900 (7.5) 0.5107*** (4.29) 0.1217*** (0.85) 0.1005
Kudamm1 x 1905 (7.37) 0.5274*** (4.49) 0.0888*** (2.29) 0.2338**
Kudamm1 x 1910 (5.91) 0.3438*** (4.79) 0.0527*** (2.04) 0.2191**
Kudamm1 x 1919 (2.93) 0.0112* (1.44) 0.1644
Kudamm1 x 1925 (1.83) 0.0072 (1.46) 0.1668
Kudamm1 x 1929/1930 (5.82) 0.8022*** (1.24) 0.0035 (1.55) 0.1750
Kudamm1 x 1936 (8.11) 1.080*** (-0.16) -0.0005 (1.52) 0.1725
Kudamm2 x 1871 (0.36) 0.0402
Kudamm2 x 1875 (0.48) 0.0365 (-0.22) -0.0379
Kudamm2 x 1880 (0.34) 0.0368 (-1.18) -0.3335
Kudamm2 x 1885 (0.39) 0.0417 (3.12) 0.3495***
Kudamm2 x 1890 (0.81) 0.1324 (0.55) 0.0505 (3.06) 0.3390***
Kudamm2 x 1895 (0.99) 0.0822 (1.43) 0.0872* (2.71) 0.2820***
Kudamm2 x 1900 (-0.47) -0.0403 (1.86) 0.0914** (5.7) 0.5170***
Tab. 1 Empirical Results (Continued)
Kudamm2 x 1910 (1.8) 0.1269* (3.99) 0.1062*** (2.09) 0.1842**
Kudamm2 x 1919 (5.68) 0.0716*** (2.24) 0.1917**
Kudamm2 x 1925 (6.16) 0.0716*** (2.16) 0.1866**
Kudamm2 x 1929/1930 (8.58) 0.7239*** (5.88) 0.0606*** (1.73) 0.1478*
Kudamm2 x 1936 (27.62) 3.916*** (6.4) 0.0606*** (1.7) 0.1438*
Observations 1109 2254 1932
Sample Kudamm Area 3 Kudamm Area 3 Kudamm Area 3
R squared 0.5212 0.7766 0.9465
Notes: Endogenous variables in Models (1), (2) and (3) are log of standard land values (SLV), log of population potentiality (PP) and log of rail population potentiality (RPP). Ku-damm1 and Kudamm2 are dummy variables denoting business blocks within Ku-damm Area 1 and KuKu-damm Area 2 respectively. 1871 – 1936 similarly represent year dummies. Sample is restricted to business blocks within Kudamm Area 3 in all models. All models include a full set of year dummies. T-statistics (in parenthesis) are heteros-cedasticity robust. * denotes significance at the 10% level; ** denotes significance at the 5% level; *** denotes significance at the 1% level.
These results suggest that public infrastructure not only accounts for a big pro-portion of the whole area’s gains, but also considerably contributes to the core region’s emergence and growth. It is evident that the remarkable increase in
relative land values around the very core from 1910 on follows a period when the area demonstrated the highest RPP values not only within its neighborhood, but even compared to the other sub-centers and the CBD (4.1). The
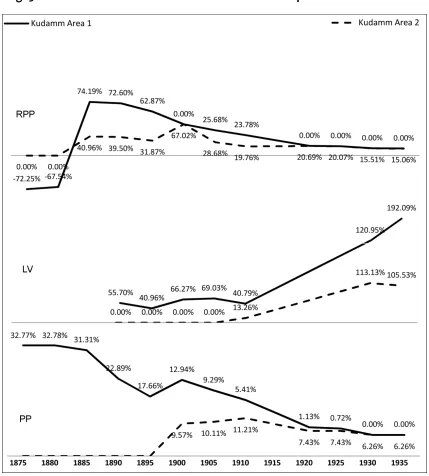
Fig. 5Micro-Level Market Access and Land Value Development
Notes: Authors` own calculations. Relative development of the indicators RPP, LV, and PP for Kudamm Area 3 against Kudamm Area 2 and Kudamm Area 2 against Kudamm Area 1, respectively.
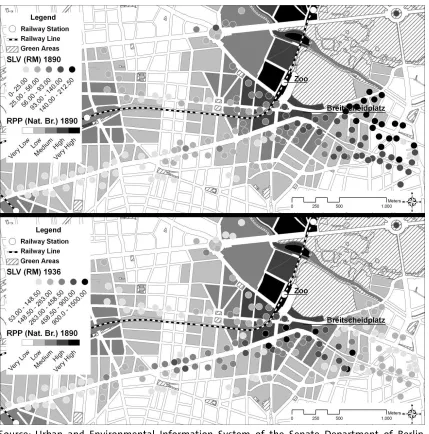
[image:26.595.113.542.100.576.2]pic-ture). Interestingly, in 1936 the highest values had regrouped around the initially better accessible blocks and hence adapted to the previously created pattern.10
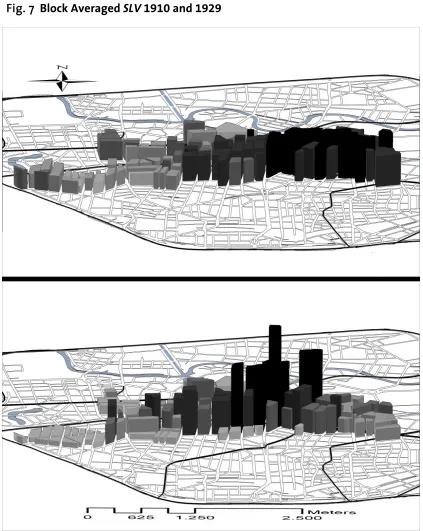
The magnitude of adaption becomes even more evident when looking at Figure 7, which visualizes SLV of the whole Kudamm Area 3 in 3D. The height corresponds to the blocks’ average SLV represented in map units (meter).
Fig. 6 Pattern of Land Valuation 1890 and 1936
Source: Urban and Environmental Information System of the Senate Department of Berlin (2006).
10
[image:27.595.115.544.226.660.2]The formerly small sub-center originated at an exposed position within the boundaries shaped by the initial market access advantage. Apparently, owing to this advantage, a core of economic activity emerged around the Breitscheidplatz, which became the center of forces of agglomeration and consolidated its position as a new urban core in the course of typical processes of cumulative causation.
Fig. 7 Block Averaged SLV 1910 and 1929
[image:28.595.113.536.204.735.2]5
From Theory to Praxis (Conclusion)
Our study explicitly aims at developing an interdisciplinary perspective on the sustainable development of metropolitan areas. While economists and urban planners evidently pursue the same goals they often miss the opportunity to ef-fectively combine their knowledge. While on one hand we develop our empirical strategy vis-à-vis economic theory, we also try to place our contribution into the context of the existing planning literature in order to enrich the interdisciplinary dialogue and to inform planning and development practitioners.
Combining empirical and theoretical findings of both research areas with results from the case study on Berlin, we conclude that the constant effort to create liva-ble and sustainaliva-ble urban environments within rapidly growing cities does not necessarily lead to conflicts regarding the exploitation of economics of agglome-ration through the creation of dense economic clusters. We propose a concept of
Directed Urban Concentration as a complementary to existing concepts of mixed
use and multifunctional land use, which implies a well-directed combination of decentralized mixed-use areas, densely inhabited downtown areas and highly agglomerated clusters of economic activity.
Since a large proportion of consumption and service facilities represent perfect substitutes and thus are not subject to excessive economies of scale, locating them within or adjacent to residential areas may promisingly reduce lengths of non work-related trips. But within a framework of regular job changes and in-creasing numbers of two-earner households this strategy might be less successful in reducing the overall length of work-related trip patterns since households are less likely to choose places of residence with respect to decentralized job loca-tions. Therefore, we suggest the efficient concentration of employment in eco-nomic cores that are highly accessible by means of public transport as a pragmat-ic approach towards sustainable urban growth.
concep-tual ideas to empirical findings in order to verify whether theoretical implications apply to real world settings. Indeed, results strongly indicate that urban economic activity is causally related to accessibility. Therefore, applying these findings to an interdisciplinary urban planning context, we propose the following agenda for a directed urban concentration and a discharge of overburdened CBDs:
First, a suitable area should be identified, exposing special characteristics regard-ing its design and prestige, like a representative plaza. It must be neither located within existing high-price areas nor too remote, providing several development opportunities. Ideally, the site would also be chosen with respect to the main di-rection of an ongoing process of urban expansion. Second, it should rapidly be-come excellently connected to existing railway networks creating accessibility and expectations about the positive prospects of location. An initial accessibility advantage should be provided at the location that is intended to represent the new core area within the economic cluster, e.g. the abovementioned plaza. Cu-mulative causation and externalities may be expected to spread from that initial-ly developed new core. Third, the development should be promoted by commoninitial-ly applied development kits such as subsidies and directed land use regulations, aiming at the intended focus the area is to represent. A representative anchor structure characterized by an iconic architecture may also be employed to im-prove the prestige of the location and to attract tourists and spending.11
Leaving much room for further research, our initial contribution aims at opening an interdisciplinary discussion on Directed Urban Concentration, which implies a wide range of planning applications combined with a fostered development of public mass transportation.
By suggesting the considered creation of highly accessible multiple urban job ag-glomerations this concept may further enrich the vivid discussions regarding the
11
Literature
ACEMOGLU, D., JOHNSON, S., & ROSINSON, J. A. (2001). The Colonial Origins of Compara-tive Development: An Empirical Investigation. American Economic Review, 91(5), 1369.
AHLFELDT, G. M. (2007). If Alonso Was Right: Accessibility as Determinant for Attractive-ness of Urban Location. Hamburg Contemporary Economic Discussions, 12.
AHLFELDT, G. M. (2008). The Train Has Left the Station: Real Estate Price Effects of Main-line Realignment in Berlin. Hamburg Contemporary Economic Discussions, 18. AHLFELDT, G. M., & MAENNIG, W. (2008). Stadionarchitektur Und Stadtentwicklung Aus
Stadtökonomischer Perspektive. In G. KLEIN, LÖW, M. MÄUSER, M. (Ed.), Stadt-architekturen - Bewegungskulturen. Bielefeld (in press): Transcript.
ALONSO, W. (1964). Location and Land Use: Toward a General Theory of Land Rent. Cam-bridge, Massachusetts: Harvard University Press.
ANAS, A. (1992). On the Birth and Growth of Cities: Laissez-Faire and Planning Compared. Regional Science & Urban Economics, 22(2), 243-258.
ANAS, A., ARNOTT, R., & SMALL, K. A. (1998). Urban Spatial Structure. Journal of Economic Literature, 36(3), 1426.
ANAS, A., & KIM, I. (1996). General Equilibrium Models of Polycentric Urban Land Use with Endogenous Congestion and Job Agglomeration. Journal of Urban Econom-ics, 40(2), 232-256.
ARTHUR, B. (1994). Increasing Returns and Path Dependence in the Economy. Ann Arbor: University of Michigan Press.
AUST, B. (Cartographer). (1986). Die Städtebauliche Entwicklung Berlins.
BALDWIN, R. E. (2001). Core-Periphery Model with Forward-Looking Expectations. Re-gional Science & Urban Economics, 31(1), 21.
BALDWIN, R. E., & KRUGMAN, P. (1989). Persistent Trade Effects of Large Exchange Rate Shocks. Quarterly Journal of Economics, 104(4), 635-654.
BAUM-SNOW, N., & KAHN, M. E. (2005). Effects of Urban Rail Transit Expansions: Evi-dence from Sixteen Cities, 1970-2000. Brookings-Wharton Papers on Urban Af-fairs(6), 147-206.
BLOOM, D. E., & SACHS, J. D. (1998). Geography, Demography and Economic Growth in Africa. Brookings Papers on Economic Activity, 1998(2), 207-295.
BOARNET, M. G. (1994). The Monocentric Model and Employment Location. Journal of Urban Economics, 36(1), 79-97.
BOHM, E. (1980). Kurfürstendamm. Entstehung Und Erste Entwicklung. In W. RIBBE (Ed.), Von Der Residenz Zur City. 275 Jahre Charlottenburg. Berlin: Colloquium Verlag. BOWES, D. R., & IHLANFELDT, K. R. (2001). Identifying the Impacts of Rail Transit Stations
on Residential Property Values. Journal of Urban Economics, 50(1), 1-25.
BRAKMAN, S., GARRETSEN, H., & SCHRAMM, M. (2004). The Spatial Distribution of Wag-es: Estimating the Helpman-Hanson Model for Germany. Journal of Regional Science, 44(3), 437-466.
BURCHELL, R., & MUKHERJI, S. (2003). Conventional Development Versus Managed Growth: The Costs of Sprawl. American Journal of Public Health, 93(9), 1534-1540. BURGESS, E. (1925). The Growth of City, an Introduction to a Research Projekt. In R. PARK
(Ed.), The City. Chicago: IL University of Chicago Press.
CHAMPION, A. G. (2001). A Changing Demographic Regime and Evolving Polycentric Ur-ban Regions: Consequences for the Size, Composition, and Distribution of City Populations. Urban Studies, 38(4), 657-677.
CHESHIRE, P. (1995). A New Phase of Urban Development in Western Europe? The Evi-dence for the 1980s. Urban Studies, 32(7), 1045.
COUPLAND, A. (1997). An Introduction to Mixed Use Development. In A. COUPLAND (Ed.), Reclaiming the City; Mixed Use Development. London: Spon.
CRAFTS, N. (2005). Market Potential in British Regions, 1871-1931. Regional Studies, 39(9), 1159-1166.
CUTLER, D. M., & GLAESER, E. L. (1997). Are Ghettos Good or Bad? Quarterly Journal of Economics, 112(3), 827-872.
DAVID, P. A. (1985). Clio and the Economics of Qwerty. American Economic Review, 75(2), 332.
DAVIS, D. R., & WEINSTEIN, D. E. (2002). Bones, Bombs, and Break Points: The Geography of Economic Activity. American Economic Review, 92(5), 1269-1289.
DAVOUDI, S. (2003). Polycentricity in European Spatial Planning: From an Analytical Tool to a Normative Agenda. European Planning Studies, 11(8), 979-999.
DE ROO, G., & MILLER, D. (2000). Compact Cities and Sustainable Urban Development. Al-dershot: Ashgate Publishing.
ERBE, M. (1987). Berlin Im Kaiserreich. In W. RIBBE (Ed.), Geschichte Berlins. Berlin: Verlag C. H. Beck.
FRIEDMAN, J., & MILLER, J. (1965). The Urban Field. Journal of the American Institute of Planners, 31(4), 312-319.
FUJITA, M., KRUGMAN, P., & VENABLES, A. J. (1999). The Spatial Economy: Cities, Regions, and International Trade. Cambridge and London: MIT Press.
GATZLAFF, D. H., & SMITH, M. T. (1993). The Impact of the Miami Metrorail on the Value of Residences near Station Locations. Land Economics, 69(1), 54-66.
GIBBONS, S., & MACHIN, S. (2005). Valuing Rail Access Using Transport Innovations. Jour-nal of Urban Economics, 57(1), 148-169.
GIULIANO, G., & SMALL, K. A. (1993). Is the Journey to Work Explained by Urban Struc-ture? Urban Studies, 30(9), 1485.
GORDON, P., KUMAR, A., & RICHARDSON, H. W. (1989). Congestion, Changing Metropoli-tan Structure, and City Size in the United States. International Regional Science Review, 12(1), 45-56.
GRASS, R. G. (1992). The Estimation of Residential Property Values around Transit Station Sites in Washington, D C. Journal of Economics and Finance, 16(2), 139-146.
HALVORSEN, R., & PALMQUIST, R. (1980). The Interpretation of Dummy Variables in Semi-logarithmic Equations. American Economic Review, 70(3), 474-475.
HAMILTON, B. W., & ROELL, A. (1982). Wasteful Commuting. Journal of Political Economy, 90(5), 1035-1053.
HANSON, G. (2005). Market Potential, Increasing Returns and Geographic Concentration. Journal of International Economics, 67(1), 1-24.
HARRIS, C., & ULLMAN, E. (1945). The Nature of Cities. Annals of the American Academy of Political and Social Science, 242(1), 7-17.
HARRIS, C. D. (1954). The Market as a Factor in the Localization of Industry in the United States. Annals of the Association of American Geographers, 44(4), 315-348.
HAUGHTON, G. (1997). Developing Sustainble Urban Development Models. Cities, 14(4), 189-195.
HEIKKILA, E., GORDON, P., KIM, J. I., PEISER, R. B., RICHARDSON, H. W., & DALE-JOHNSON, D. (1989). What Happened to the Cbd-Distance Gradient?: Land Values in a Poli-centric City. Environment and Planning, 21(2), 221–232.
HELSLEY, R. W., & STRANGE, W. C. (1991). Agglomeration Economies and Urban Capital Markets. Journal of Urban Economics, 29(1), 96.
HOFMEISTER, B. (1990). Berlin (West). Eine Geographische Strukturanalyse Der Zwölf West-lichen Bezirke. Darmstadt: Wissenschaftliche Buchgesellschaft.
JENKS, M., & BURGESS, R. (2000). The Compact City; Sustainable Urban Form for Develop-ing Countries. London: Spon.
JENKS, M., BURTON, E., & WILLIAMS, K. (1996). The Compact City. London: Spon. KALWEIT, F. (1928). Die Baustellenwerte in Berlin. Berlin: Ermo Verlagsgesellschaft. KALWEIT, F. (1936). Die Baustellenwerte in Berlin. Berlin: Carl Heymanns Verlag.
KEEBLE, D., OWENS, P. L., & THOMPSON, C. (1982). Regional Accessibility and Economic Potential in the European Community. Regional Studies, 16(6), 419-431.
KENNEDY, P. E. (1981). Estimation with Correctly Interpreted Dummy Variables in Semi-logarithmic Equations. American Economic Review, 71(4), 801-801.
KLOOSTERMAN, R. C., & MUSTERD, S. (2001). The Polycentric Urban Region: Towards a Research Agenda. Urban Studies, 38(4), 623-633.
KOIDE, H. (1987). Spatial Provision of Local Public Goods with Spillover Effects. Regional Science & Urban Economics, 18, 283-305.
KRAUSE, R. (1958). Die Berliner City. Frühere Entwicklung/ Gegenwärtige Situation/ Mögli-che Perspektiven. Berlin: Dissertation der Freien Universität Berlin.
KRUGMAN, P. (1991). Increasing Returns and Economic Geography. Journal of Political Economy, 99(3), 483-499.
LEGATES, R., & STOUT, F. (1996). The City Reader. London: Routledge.
LEYDEN, F. (1933). Groß-Berlin. Geographie Der Weltstadt. Breslau: Ferdinand Hirt. LIPMANN, W. (1933). Der Standort Des Einzelhandels. Berlin: Dissertation.
LOUIS, H. (1936). Die Geographische Gliederung Von Groß-Berlin Stuttgart: Engelhorns Nachf.
LUCAS, R. E., JR., & ROSSI-HANSBERG, E. (2002). On the Internal Structure of Cities. Eco-nometrica, 70(4), 1445-1476.
LYNCH, K. (1961). The Pattern of Metropolis. Daedalus, Winter, 79-98.
LYNCH, K., & RODWIN, L. (1958). A Theory of Urban Form. Journal of the American Insti-tute of Planners, 24(Fall), 201-214.
MCMILLEN, D. P., & MCDONALD, J. (2004). Reaction of House Prices to a New Rapid Tran-sit Line: Chicago's Midway Line, 1983–1999. Real Estate Economics, 32(3), 463-486.
MILLS, E. S. (1972). Studies in the Structure of the Urban Economy. Baltimore: Johns Hopkins Press.
MION, G. (2004). Spatial Externalities and Empirical Analysis: The Case of Italy. Journal of Urban Economics, 56(1), 97-118.
MÜLLER, G. (Cartographer). (1881-1910). Karte Zur Berechnung Des Grund- Und Boden-werthes in Berlin
MÜLLER, G. (Cartographer). (1890-1910). Karte Zur Berechnung Des Grund- Und Boden-werthes in Berlin
MUTH, R. F. (1969). Cities and Housing: The Spatial Pattern of Urban Residential Land Use. Chicago: University of Chicago Press.
NAESS, P., & LYSSAND SANDBERG, S. (1996). Workplace Location, Modal Split, and Energy Use for Commuting Trips. Urban Studies, 33(3), 557-580.
NEWMAN, P. (1996). Reducing Automobile Dependence. Environment and Urbanization, 8(1), 67-92.
NEWMAN, P., & KENWORTHY, J. R. (1989). Gasoline Consumption and Cities. A Compari-son of U.S. Cities with a Global Survey. Journal of the American Planning Associa-tion, 55(1), 24-37.
NIEBUHR, A. (2006). Market Access and Regional Disparities: New Economic Geography in Europe. Annals of Regional Science, 40(2), 313-334.
NOWLAN, D. M., & STEWART, G. (1991). Downtown Population Growth and Commuting Trips. Journal of the American Planning Association, 57(2), 165-182.
OVERMAN, H. G., REDDING, S., & VENABLES, A. J. (2003). The Economic Geography of Trade, Production and Income: A Survey of Empirics. In J. HARRIGAN & E. K. CHOI (Eds.), Handbook of International Trade. Basil: Blackwell.
POUYANNE, G. (2005). Land Use Mix and Daily Mobility - the Case of Bordeaux, France, ERSA conference papers ersa05p84: European Regional Science Association.
REDDING, S. J., & STURM, D. M. (2008). The Costs of Remoteness: Evidence from German Division and Reunification. American Economic Review, forthcoming.
REDDING, S. J., STURM, D. M., & WOLF, N. (2007). History and Industry Location: Evidence from German Airports. Centre for Economic Policy Discussion Paper Series, 2007; 6345: International Trade.
REDDING, S. J., & VENABLES, A. J. (2004). Economic Geography and International Inequali-ty. Journal of International Economics, 62(1), 53-82.
SENATSVERWALTUNG FÜR STADTENTWICKLUNG BERLIN (Cartographer). (2007). Reale Nutzung Der Bebauten Flächen
SENATSVERWALTUNG FÜR WIRTSCHAFT ARBEIT UND FRAUEN. (2004). Zentrenatlas Wirt-schaftsstandort Berlin (2. ed.). Berlin: Regioverlag.
SMALL, K. A., & SHUNFENG, S. (1992). `Wasteful' Commuting: A Resolution. Journal of Political Economy, 100(4), 888.
STARRETT, D. A. (1974). Principle of Optimal Location in a Large Homogeneous Area. Jour-nal of Economic Theory, 9(4), 418-448.
STIGLITZ, J. E. (1977). The Theory of Local Public Goods. In M. S. FELDSTEIN & R. P. INMAN (Eds.), The Economics of Public Services (pp. 274-333). London: Macmillan.
STURM, R., & COHEN, D. (2004). Suburban Sprawl and Physical and Mental Health. Public Health, 118(7), 488-496.
TU, W., & SHI, C. (2006). Urban Environmental Management in Shanghai: Achievements, Problems, and Prospects. Environmental Management, 37(3), 307-321.
VON THÜNEN, J. H. (1826). Der Isolierte Staat in Beziehung Auf Landwirtschaft Und Natio-nalökonomie,
Oder Untersuchungen Über Den Einfluss, Den Die Getreidepreise, Der Reichtum Des Bodens Und Die Abgaben Auf Ackerbau Ausüben. Hamburg: Perthes.
VREEKER, R. (2004). Multifunctional Land Use and Externalities, ERSA conference papers ersa04p346: European Regional Science Association.
WALDFOGEL, J. (2008). The Median Voter and the Median Consumer: Local Private Goods and Population Composition. Journal of Urban Economics, 63(2), 567-582.
WILLIAMS, K. (1999). Urban Intensification Policies in England:Problems and Contradic-tions. Land Use Policy, 16(3), 167-178.
WILLIAMS, K., BURTON, E., & JENKS, M. (2000). Defining Sustainable Urban Form. In K. WILLIAMS, BURTON, E., AND JENKS, M. (Ed.), Achieving Sustainable Urban Form. London: E & FN Spoon.
WU, F. (2000). Modelling Intrametropolitan Location of Foreign Investment Firms in a Chinese City. Urban Studies, 37(13), 2441-2464.
Data Appendix
The data collection and preparation involved various processes. The first step consisted of
properly defining the areas of business use for our year of reference in 1936. A detailed
map (AUST, 1986), showing the relevant parts of Berlin and indicating the corresponding land use for each built up block, was consulted. The information was extracted by
digital-ly processing the map and assigning the relevant information to Berlin’s official block structure of 2006. Standard GIS software was able to provide feasible methods in order
to gain reliable results. Consulting historical sources about the economic structure of the
city (HOFMEISTER, 1990; LEYDEN, 1933; LIPMANN, 1933; LOUIS, 1936) allowed for feasi-bly defining three areas, which represent the core regions of economic activity within the
research area (figure A1). Due to its spatial and historical significance, the Kaiser-Wilhelm-Gedächtniskirche represents the center of the very core region and, extended
about 700 m the east to Wittenbergplatz (location of the KaDeWe) and 700 m to the
west, forms Area 1. The second region is also comprised of the highly vivid Harden-bergstrasse towards the Technical University in the north, Olivaer Platz in the west and
Nollendorfplatz in the east. The third area is represented by a wider range of what is still considered as belonging to the center and also includes the shopping area along
Wil-mersdorfer Strasse (Fig. A1).
The corresponding land values had to be collected from two different sources. MÜLLER (1881-1910) provided detailed maps indicating values on block and house level for a wide
area of the city’s contemporary boundaries. The collected values are restricted to former-ly identified business blocks, therefore other land uses and values were excluded, except
those that switched to commercial use during the course of our observation. In order to
determine a representative land value for each area used for business related purposes, the arithmetic average of all values being located within that area was assigned.
KALWEIT (1928, 1936) chooses a different form to present the data. Based on a complete street index of Berlin, he assigned the minimum and maximum values to each street and
therefore provides slightly less detailed data compared to Müller. Since business blocks
are assumed to represent a higher value than residential blocks (3.) it can be argued that the indicated maximum values most likely correspond to the respective business blocks.
streets. Consequently, taking the arithmetic average of the maximum values of all
[image:37.595.115.543.158.388.2]streets involved generated the value of a subject area.
Fig. A1 Definition of Kudamm Areas and Kriged SLV 1929
Source: Urban and Environmental Information System of the Senate Department of Berlin (2006).
This graphic shows, by means of kriging interpolation, commercial land valuation for
1929 as well as the outlines of the three defined Kudamm core areas of economic
activi-ty. We chose this year since it represents the overall peak for our research area in terms of economic development. Interpolated land values support the feasibility of core regions