Design of Real-time Electricity Prices and Wireless
Communication Smart Meter
Hongling Xie, Ping Huang, Yanqing Li, Liang Zhao, Feilong Wang Hebei Provincial Key Laboratory of Power Transmission Equipment Security Defense,
North China Electric Power University, Baoding, China Email: [email protected]
Received 2013
ABSTRACT
Under the background of smart grid’s real-time electricity prices theory, a real-time electricity prices and wireless communication smart meter was designed. The metering chip collects power consumption information. The real-time clock chip records current time. The communication between smart meter and system master station is achieved by the wireless communication module. The “freescale” micro controller unit displays power consumption information on screen. And the meter feedbacks the power consumption information to the system master station with time-scale and real-time electricity prices. It results that the information exchange between users and suppers can be realized by the smart meter. It fully reflects the demanding for communication of smart grid.
Keywords: Real-time Electricity Prices; Wireless Communication; Smart Meter; Freescale
1. Introduction
The idealized load requirements play a significant role in energy saving and low-carbon economy. The smart elec-tricity’s guiding ideology is using the informatization means, price leverage and interactive strategies to mobi-lize the power users to participate in demand-side’s re-sponse and idealize the load requirements [1,2]. An im-portant process in the China's smart grid development is real time pricing release [3-6]. So the smart grid requires advanced metering system to achieve real-time interac-tive communications [7-9]. Against this background and according to the literature [10], this paper design a smart meter based on the wireless two-way communication to achieve real-time electricity prices.
The smart meter is defined in “Functional specification for smart Watt-hour meter” as “An energy meter can display, storage and output data, be made up of measur-ing unit and data processmeasur-ing unit, not only can measure active and reactive electric energy, but also has two or more functions like time-sharing and measure the re-quired amount (average power within a specified time)”. In this paper, the design of smart meters has the follow-ing features:
a) Calculates the active and reactive electric energy, analysis capabilities of the fundamental active power, fundamental reactive power, harmonic active power and harmonic reactive power, input via the keyboard and displayed on the display.
b) Information will store in the MCU (micro controller unit) to record the user's power utility information at any time.
c) Perform wireless communication with the system master station to upload users’ power consumption in-formation, and receive real time price information and command issued by system master station[11].
d) Interrupted by the real-time clock chip, summarize the user's power consumption information and cost each month
2. Hardware Design
2.1. Hardware Structure
This paper will take 0.38 KV low voltage three-phase four-wire grid system as example. The system hardware structure is shown in Figure 1.
can query the current electricity prices, costs and other information through the keyboard, and displayed on the screen.
2.2. Configuration Diagram of Each Module
1) Energy metering module
Energy metering chip select ATT7022B. It is a high precision, strong function, multi-functional, an-ti-tampering energy metering chip. It’s applicable to Three- phase four-wire system and is communicating with MCU through the SPI interface. It’s able to measure each phase’s information including active power, reactive power and apparent power in fundamental, harmonics and full-wave. While it can measuring frequency, current and voltage RMS, power factor and phase angle. It reaches the three-phase multifunction energy meter’s standard.
The ATT7022B integrates 16-bit AD converter and the current channel valid values’ linearity error is less than 0.5% when it's in the range of 2 mV to 1 V. Meanwhile the voltage channel valid values’ linearity error is less than 0.5%when it’s in the range of 10 mV to 1 V. Each ADC’s AC signal is inputted by pin VxP and VxN (x
represents 1, 2 ... 7). At the same time VxP and VxN must
be superimposed 2.4 V DC bias voltages. The bias volt-age REFO is provided by an external reference voltvolt-age. The energy metering chip and MCU hardware connec-tion diagram is shown in Figure 2.
Primary system’s voltage and current transform by the transformer and be sampled by the three-phase metering chip then input differentially. The 1.2 K resistor and 0.01 uF capacitors constitute an anti-aliasing filter in VxP and VxN’s input circuit. Its structure and parameters must be symmetry and take good temperature performance com-ponents to ensure obtain good temperature characteristics. Measurement chip power in +5 V and SCK pin provides
synchronous clock signal. The /CS pin transports chip select signals, which are passed in MOSI and MISO lines.
2) Real-time Clock Module
The real-time clock chip is power in + 5 V, and high- precision 32.768 kHz crystal oscillator is internal, corre-sponds to the I2C-BUS’s high-speed mode (400 kHz). The chip’s year, month, day, week, hour, minute, second are respectively expressed as BCD code, and Transmit fixed-cycle interrupt instruction to the MCU.
[image:2.595.311.536.336.507.2]In this paper, MCU collect power utility information and received real time price from system master station, then stored in the MCU’s Flash EEPROM with the re-al-time clock chip’s read-out time. Thus, the information stored in the memory with a time scale and the users query conveniently through the keyboard. Then the clock chip interrupts the MCU’s IRQ pin per month (assuming on the 1st). After interrupt MCU aggregate the power consumption and electricity prices and sent them to the host through the wireless.
Figure 1. The structure diagram of system hardware.
CTA
1.2K R3
0.01uf C1
1.2K R4 10 R1 10 R2
0.01uf C2
REFO
V1P V1N
V2P V2N
1 2 3 4 5 6 7 8
the same as A phase
1 2 3 4 5 6 7 8
B voltage and current
C voltage and current
N voltage A phase
V4P V4N V3P V3N
V6P V6N V5P V5N
V7P V7N
1 2 3 4
ATT7022B MCS12DG128 MCU SPI BUS
DOUT DIN SCLK /CS
MISO MOSI SCk /SS
PTA 1.2K
R5
0.01uf C3
0.01uf C4 R61.2K 10K R7
10K R8
REFO REFO
A voltage
[image:2.595.84.513.533.718.2]3) The wireless communication module
Wireless communication module function as an inter-mediary for smart meters to exchange data with the mas-ter system. MCU and the wireless communication mod-ule are connected as shown in Figure 4.
The MCU and wireless module are isolated by the op-tocoupler isolation device, to avoid interference by serial communication. The wireless module’s model is XL05- 232AP2, and it is an UART interface, half-duplex wire-less transmission module. It works in the 433 MHz pub-lic band, in line with European ETSI standards (EN300-220-1 and EN301-439-3) and meets the wireless control requirements. We don’t need to apply frequency usage license. The module’s serial rate is 1200 bps, data format is 8 N1, transmission distance is 6000 m and it is power in + 5 V. It is suitable for a small amount of data, low-rate, long-distance communication, to meet the smart meters and the master system’s wireless commu-nication requirement. In the master system configured the same type of wireless modules, you can form a many-to-one communication mode.
4) Keyboard and screen
The keyboard is composed by a 3 × 3 keys matrix and is connected to the MCU by 6 data line. The screen is the YB12864-Z LCD display module, integrated a ST7920 controller and its operating voltage is +5 V. The LCD controller integrated the character base. Characters can be written directly in the program and the lengthy code conversed from matrix Printer software do not need any more. The screen mainly completes the task of display energy information and real-time tariff.
Keyboard and display hardware is shown in Figure 5. 5) Power Management Module
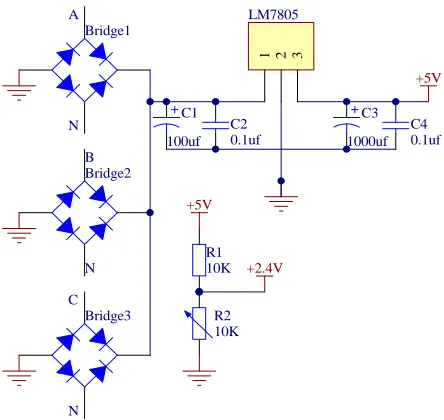
The design of the power circuit is particularly important to the smart meters performance. The VCC (Volt Current Condenser)’s operating voltage must be stable at +5 V
5% (All devices operating voltage are + 5 V). Figure 6 is a three-phase supply schematic diagram. The VCC
Real Time Clock SCL SDA /INTA PortH7/SCl PortJ6/SDA /IRQ I2C BUS MCS12DG128 MCU
Figure 3. The hardware design of real-time clock.
wireless communication RXD GND TXD TXD GND RXD RS-232 MCS12DG128 MCU Opto-couplersisolation
Figure 4. The hardware design of wireless communication.
...
PortT0 PortT7 DB0 DB7 ... ... PortS0 PortS1 PortS2 PortS3 E RS RW PSB MCU MCS12DG128 YB12864-Z display module PortM0 PortM1 PortM2 PortM3 PortM4 PortM5 D1 D2 D3 D4 D5 D6 [image:3.595.312.537.85.223.2]3*3 matrix keyboard
Figure 5. The hardware design of keyboard and display.
0.1uf C2 100uf C1 0.1uf C4 1000uf C3
1 2 3
[image:3.595.312.534.250.460.2]LM7805 +5V Bridge2 Bridge1 Bridge3 A N B N C N 10K R1 10K R2 +5V +2.4V
Figure 6. The hardware design of power management.
supply REFO reference potential in the way of resistive voltage division. By adjusting the variable resistor R2 we
can get + 2.4 V power.
3. Software Design
3.1. The Main Program
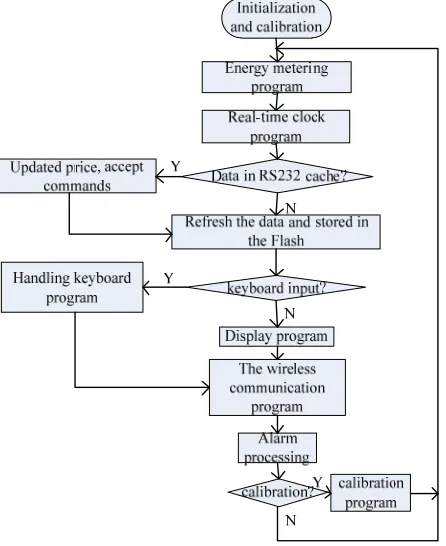
Figure 7 is the main program flow.
Initialization include the MCU pin state initialization, AD, RS-232, I2C bus, SPI bus initialization, the real-time clock’s initial value settings, energy metering chip ini-tialization and display chip iniini-tialization and so on. Pro-cedures and working principles are described below.
3.2. Procedures Design
1) Energy metering program design
commu-nication and CS change low from high. After 32 clock pulses, SCLK and CS change from low to high, a register read or write operation is done. The ATT7022B takes the data sent by microcontroller from the DIN line on the falling edge of the clock signal, and sends data to micro-controller from the DOUT line on the clock signal’s ris-ing edge.
The ATT7022B can read all measured values from the measurement parameter register and do three times data updates per second. These parameters are each phase’s and split phase’s power, fundamental’s, harmonics’ and full-wave’s active power, reactive power, apparent power, power factor, phase angle, voltage angle, the loss of pressure detection, frequency and temperature, etc. Be-cause the measured quantities are so many, we must or-ganize and storage the data metered, processed and re-corded reasonable to check easily[12].
2) Real-time clock program design
MCU communicates with real-time clock through I2C bus by the SDA and SCL. By combining the SDA and SCL signals, the MCU determine if start or top commu- nication, data transmission, signals reception and re- sponse to the master system. At the non-communication time, the SCL and SDA signals are maintained in HIGH state. The start and end of the communication is con-trolled by the SDA signal’s rise or fall while the SCL is in the High state.
[image:4.595.61.284.447.720.2]MCU acquires time by reading the real-time clock chip’s internal registers, and set the clock chip generate a
Figure 7. The main program flow.
fixed cycle interrupt at the same time. On the 1st of the month a falling edge transition occurs to the MCU’s /IRQ pin. The MCU receives interrupt instruction, then sent the power consumption information aggregation and cost statistics to the System Master.
3) Design of wireless communication procedures Wireless receive mode is set to receiver through the serial port interrupt. When the system master sent data through the wireless module (including commands and real-time price), the register R1 is set to enter the
inter-rupt response and the SBUF register receive data in pre-defined format. Then MCU will read the real-time clock module’s time, store received information and time in-formation in the MCU’s Flash E2PROM. The MCU needs to send the acquired information to the System Master via wireless after executing the program so that the Master can always monitor the energy meter’s status and users’ power consumption information. The data received by smart meters or the System Master will au-tomatically re-send to the transmission side. The sender will compare the received data and the previously trans-mitted data. Only exactly the same the data is considered successfully sent, otherwise it will re-send the data.
4) Keyboard and display program design
Action of the 9 keys on the keyboard will cause the PortM0 to PortM5’s potential changes and MCU will respond accordingly
MCU control YB12864-Z LCD display module through 8 data lines and 4 control lines. Under normal circumstances, the LCD module’s backlight is turned off. Its backlight will turn on when keys are operated, and the screen shows relevant information.
5) Alarm processing
The Alarm includes side voltage power failure alarm and the frequency alarm. Metering chip’s internal voltage detection circuit will judge whether the A, B, C three- phase are power failure according to the set threshold voltage. It will be represented by Bit0/1/2 of state flag register (Sflag). When a phase loss of power, the corre-sponding flag bit become 1. Take B phase for example, if the B phase loss of power, the Sflag’s Bit0/1/2 will change into 010(B) and send the abnormal information to the System Master through the wireless module. The frequency alarm begin to work if the metering chip de-tects the frequency fluctuation is over 50HZ 5%.
4. Conclusions
same time, it can store power consumption information with the time scale and the spot price. Also it can com-municate with the System Master in two-way wireless way. It implements the information exchange between smart meters (the client) and the System Master (sup-ply-side), fully reflects the smart grid’s interaction.
REFERENCES
[1] C. Q. Kang, Chen and Xia Qing, “Prospects of Low-carbon Eelectricity Power System Technology,” Vol. 33, No. 2, 2009, pp. 1-7.
[2] S. Y. Chen, S. F. Song, L. X. Li and J. Shen, “Survey on Smart Grid Technology,” Power System Technology, Vol. 33, No. 8, 2009, pp. 1-7.
[3] J. R. Li, Z. G. Hu, H. Ji and L. Zhao, “Research and Ap-plication of Demand Side Management in Beijing Re-gion,” Power System Technology, Vol. 23, No. 2, 1999, pp. 19-21.
[4] Y. X. Zhang, Q. W. Wang and H. H. Liang, “A Study of Load Management Methodology for Large Consumers,”
Power System Technology, Vol. 28, No. 12, 2004, pp. 39-41.
[5] X. J. Zeng, K. K. Li and W. L. Chan, “Design of Auto-matic Network for Demand Side Management of Low Voltage Consumers,” Power System Technology, Vol. 6, No. 11, 2002, pp. 41-45.
[6] M. Zhou, G. Y. Li and Y. X. Ni, “A Preliminary Rsearch Onimplementation Mechanism of Demand Side Man-agement under Electricity Market,” Power System Tech-nology, Vol. 29, No. 5, 2005, pp. 6-11.
[7] L. Chen, F. C. LV, Q. Xie, X. N. Lan and S. J. Sun, “Re-search of Real-time Energy Measurement and Bidirec-tional Communication Smart Meter,” Proceedings of the CSEE, Vol. S1, 2011, pp. 94-99.
[8] K. Zhang, “The Research of Smart Meter Two-Way Communication Based on Advanced Metering Infra-structure,” Taiyuan: Taiyuan University of Technology, 2011.
[9] X. Y. Wang, “Design and Research on Multifunction Smart Meters,” Wuhan: Wuhan University of Technology, 2011.
[10] S. G. Yin, Y. Zhang and K. M. Bai, “A Smart Power Utilization System Based on Real-Time Electricity Pric-es,” Power System Technology, Vol. 19, 2009, pp. 11-16.
[11] N. H. Zhu, X. M. Bai and F. Gao, “Function Require-ments and Structure Properties Analysis of Bi-directional Smart Meter,” Power System Technology, Vol. 11, 2011, pp. 1-6.