Exploring the relationship between perceived usefulness and
perceived ease of use towards intention to use Decision Support
System (DSS)
Eta Wahab, Alina Shamsuddin, Nor Hazana Abdullah, Saw Soon Lee ,Zaurin Ali
Faculty of Technology Management and Business ,Universiti Tun Hussein Onn Malaysia, 86400 Parit Raja BatuPahat Jhor ,Malaysia ,
[email protected],[email protected],[email protected],[email protected]
Abstract
This study was conducted to examine the nature of relationship between the perceived usefulness and perceived ease of use towards intention to use Decision Support Systems (DSS) using samples from employees in one manufacturing company in Malaysia. A total set of 60 sets of questionnaire were sent to the organization and 50 usable questionnaire representing a response rate of 83 percentage were used for statistical analysis. The Technology Acceptance Model (TAM) based on Venkatesh and Davis (2000) was adopted in this study. Results indicated that both perceived usefulness and perceived ease of use were significant in explaining intention to use DSS. The intention to use also reported direct relationship with DSS usage. Implications and suggestions for further research are also discussed.
Introduction
Information technology (IT) had been considered as an important component in developing countries such as Malaysia especially in supporting the dependable information and actual data needed in business and industry (Eze & Mohamad, 2000). The successful of IT depends on the technology itself and the level of expertise of an individual in using such technology. Davis (1989) recognized that indicators of the successfulness of computer utilization could enhance productivity and user satisfaction.
With the impact of globalization and the rules of free trade agreement, the manufacturing firms including small and medium enterprises (SMEs) are under pressure to adopt advanced technologies to be more competitive. With an eye on this challenge, one of the crucial objectives of the Tenth Malaysia Plan (2011) is to further recognized the potential growth of the manufacturing sector in Malaysia. Hence there is a need for aggressive strategy to develop manufacturing sector. However, these strategies need to be supported by the technology. For example, to be more competitive, a particular firm need to consider using new technology instead of repeating using the previous technology.
One of the tools that can be used to support the decision making of an organization is the Decision Support System (DSS). DSS are designed to increase productivity, reduce cost, save time, increase the quality of decisions and achieve competitive edge. In fact, DSS can also be used to manage the overall performance in effective and efficient manner. Bell et al. (2001) reported a situation where decision-makers who used a DSS were able to obtain detailed insights into the decision problem and then understood their own preferences better, even though the solution eventually adopted was different from that determined with help of the DSS. Therefore, it can be justified that DSS is able to help a firm to perform better. DSS can assist the company to choose the best decision to be made (Nokhbatol et al., 2010).
This paper examine the acceptance of DSS from employees perspective proposing the relationship between Perceived Usefulness (PU), Perceived Ease of Use (PEOU) and one’s intention and behavior in using decision making system. The purpose of this study is threefold. The first is to gain an understanding on the relationship between Perceived Usefulness and intention to use. Secondly to identify the relationship between Perceived Ease of Use and intention to use. The third purpose of the study is to identify the relationship between intention to use and DSS usage. This study hopes to add to the existing knowledge and current research concerning DSS acceptance. In addition, the framework of DSS is useful as a guideline to the professionals to enhance the decision making process by the system applied. The outcomes of this study can help the company to find out the problems of DSS and improve it to be more supportive. Finally, this study can be used for future research in manufacturing sector.
Literature Review
An example scenario of technology change will be the implementation of Decision Support System (DSS) to replace the old human-consideration method in organization. DSS is a system that could assist company in their decision making processes on daily works. However, the acceptance of DSS faced general problems such as data availability and the ease of use of graphical user interfaces. Cognitive obstacles, such as an aversion among senior executives to DSS technology, may also have played a significant role. Mathieson et.al, (2001) indicates that Perceived Usefulness (PU) and Perceived Ease of Use (PEOU) will have a significant relationship with one’s intention and behavior in using decision making system
The primary fundamental model for this research is the technology acceptance model (TAM). TAM was first proposed and tested by Davis et al. (1989). A key purpose of TAM is to provide a basis for tracing the impact of external factors on internal beliefs, attitudes and intentions. TAM, which has been widely used in information system (IS) research, was an adaptation of the theory of reasoned action (TRA) in an information systems environment. According to the Theory of Reasoned Action (Fishbein & Ajzen, 1975), a person’s action is a function of that person’s behavioral intention. In other words, behavioral intention to use any information system is expected to direct to actual usage. Attitude formation, the context and the expected outcome arising from the action might shape the behavioral intention.
According to the TAM, perceived usefulness is the degree to which a person believes that using a particular system would enhance his or her job performance. Davis et al. (1992), refers perceived usefulness as consumers’ perceptions regarding the outcome of the experience. On the other hand, Davis (1989) defined PEOU as the degree to which a person believes that using a particular information system or information technology would be free of effort
.
Related Research of TAM
Technology Acceptance Model is used to explain a particular information system or technology. A number of researchers have proposed extended models for revising Technology Acceptance Model. Taylor and Todd (1995) proposed the integrated model of TAM and TPB and it was named as Combined TAM-TPB. Venkatesh and Davis (2000) proposed TAM2 as a new version of Technology Acceptance Model. Venkatesh et al. (2003) proposed the Unified Theory of Acceptance and Use of Technology. Lin
et al. (2007) proposed the TRAM which is the integration of technology readiness and Technology
Acceptance Model. Chang (2008) proposed a combined model of Task-technology fit and Technology Acceptance Model.
Related studies on PU and PEOU
There are several studies had highlighted the importance of Perceived Usefulness and Perceived Ease of Use relating with a person’s behavior prior to the work of Davis (1985). Schultz and Slevin (1975) had found that perceived usefulness provided a reliable prediction for self-predicted use of a decision model. The evidence of perceived usefulness and perceived ease of use were both important behavioral determinants had been also provided by Swanson’s research (1982).
There is empirical evidence that has accumulated over a decade that suggest PEOU is significantly linked to intention to use, both directly and indirectly via its impact on PU (Davis et.al, 1989; Venkatesh & Davis, 2000). In general, a system or technology that is perceived to be easy to use or learn would be anticipated to be more useful to the user and this statement was first supported by Davis et.al (1989).
TAM posits that employees’ actual usage can be explained by their intention to use, which is influenced by two determinants which are perceived usefulness and perceived ease of use (Davis, 1989). Davis (1989) also found that employees’ actual usage can be predicted well by their usage intention. Venkatesh and Davis (1996) stated that customer’s intention to use and has a significant impact on successful use of the ATM system.
Methodology
The study was conducted in one of the manufacturing company in Pulau Pinang, Malaysia. A cover letter explaining the purpose of the study were send to the company. 60 set of questionnaire were distributed to employees in the company. 50 valid questionnaires had been identified, after ruling out those with insufficient data, which reflected a usable response rate of 83.3%.
Based on discussion in preceding sections, a total of 3 hypotheses statement were constructed. The formulated hypotheses for this study are listed as follow:
H1: There is a significant relationship between perceived usefulness (PU) and intention to use H2: There is a significant relationship between perceived ease of use (PEOU) and intention to use H3: There is a significant relationship between intention to use and DSS usage.
The items in the questionnaire were adapted from measures from previous study. Thirty employees from one manufacturing company were selected to participate in the pilot test of the survey. All question item were measured on a 5 point Likert type scale from strongly disagree (1) to strongly agree (5). The realibility coefficient ranged from 0.764 to 0.918 for all the instruments used in this research.
Data Analysis And Interpretation
The data were analyzed using SPSS and subsequent data analyses were undertaken using statistical approach i.e. spearman’s rho.
Demography Analysis
Demography analysis of respondents includes gender, age, ethnic, education level, and the years in the industry. There are 30 female respondents while only 20 male respondents put of total who are involved in this research analysis. In terms of age, most respondents are aged between 21 to 30 years. They account for 48 percent from the whole sample. This is followed by people aging 31 years and 40 or 15 number of respondents. There are only 3 percent of respondents aging above 41 years old which is only 9 people in this category. There are only 2 person who aged below 20 in this set of sample.
In this sample of research, majority of respondents are Chinese (96 percent) followed by Malay and Indian categories with only 2 percent respectively. In terms of education, majority of the respondents are bachelor’s degree holder. They constitute of 60 percent in terms of percentage. Second largest group of respondents are diploma holder where there are 17 people in this group. 4 percent of respondents had secondary school education level. There are only one respondent who is a master’s degree holder.
Based on Table 1 it can also be seen that there 40 percent of the respondents have worked for 1 to 5 years in the company. This is followed by workers who have worked for 6 to 10 years. This category represent for 34 percent of the respondent. 16 percent of the respondent had more than 10 years in the company. While only 1 percent of respondent have worked for less than 1 year in the company.
Hypothesis 1
Result in Table 2 shows that the calculated p values is smaller than the significant level (α) i.e. the p value 0.00 < significant level 0.01. The null hypothesis H01 is rejected. Thus, it can be concluded that there is a significant relationship between perceived usefulness (PU) and intention to use DSS.
Hypothesis 2
Table 3 reveals that the p value is smaller than the significant level (α) i.e. the p value 0.00 < significant level 0.01. The null hypothesis H02 is rejected.
Hypothesis 3
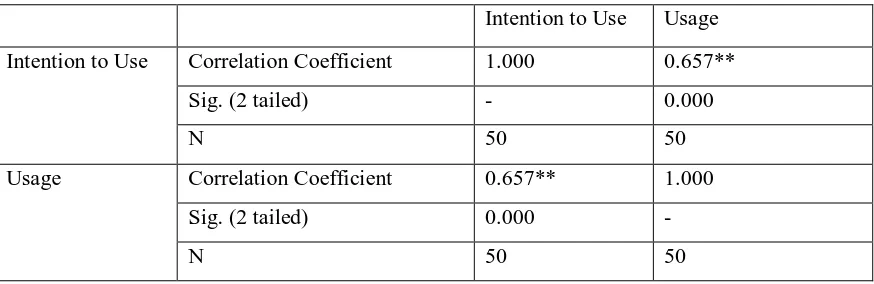
Result in Table 4 shows that the calculated p values is smaller than the significant level (α) i.e. the p value 0.00 < significant level 0.01. The null hypothesis H01 is rejected. Thus, it can be concluded that there is a significant relationship between intention to use DSS and DSS usage.
Discussion And Conclusion
The result of this study also confirmed the relationship between intention to use DSS and DSS actual usage. This is also consistent with Davis (1989) and Venkatesh and Davis (1996) which acknowledged the relationship between intention to use and usage. This reflects the importance of users’ intention to use towards the successful use of DSS usage
Recommendation
In this research, researcher identifies the relationship among PU, PEOU, Intention to use and DSS usage in manufacturing sector only. Future researcher can expand the scope of this research by expanding the sectors to be investigate .This is because DSS is also been widely used in other industry such as the medical industry and the construction industry. Future research can also be done by identifying the barrier in implementing the DSS among different sectors.
References
Bell, M.L., Hobbs, B.F., Elliott, E.M., Ellis, H. and Robinson, Z. (2001). An evaluation of multicriteria decision-making methods in integrated assessment of climate policy. Lecture Notes in Economics and Mathematical Systems, 487, 228-237.
Chan , S.C. & Lu M. T. (2004) Understanding internet banking adoption and se behavior : A Hong Kong perspective. Journal of Global Information Management , 12(3), 21-43.
Chang, H. H. (2008). Intelligent agent's technology characteristics applied to online auctions' task: A combined model of TTF and TAM. Technovation, 28(9),564-577.
Davis F.D. (1989), Perceived usefulness, perceived ease of use, and user acceptance of information technology, MIS Quarterly 13, 319–339.
Davis, F. D., Bagozzi, R. P., & Warshaw, P. R. (1989). User acceptance of computer technology: a comparison of two theoretical models. Management Science, 35(8), 982–1003.
Davis F.D., Bagozzi RP, Warshaw PR (1992). Extrinsic and intrinsic motivation to use computers in the workplace. J. Appl. Soc. Psychol. 22(14), 1109-1130.
Eze U.C. and Mohamad N.A. (2000). The influence of information technology on organization structure of Malaysian business firms. Jurnal Teknologi, 33, 1–10.
Fishbein, M., & Ajzen, I. (1975). Belief, attitude, intention and behavior: An introduction to theory and research. Reading, MA: Addison-Wesley.
Jackson, C.M., Chow, S. & Leitch (1997). Toward an understanding of the behavioral intentions to use information system. Decision Science, 28, 357-389
Lee, Y., Kozar, K. E., and Larsen, K. (2003). The Technology Acceptance Model: Past, Present, and Future. Communications of the AIS, 12-50
Lin, C.H., Shih, H.Y., and Sher, P.J. (2007). Integrating technology readiness into technology acceptance: The TRAM model. Psychology and Marketing, 24(7), 641-657.
Mathieson, K., Peacock, E., and Chin, W., (2001), “Extending the Technology Acceptance Model: The Influence of Perceived User Resources,” Database For Advances in Information Systems, 32( 3), 86 – 112.
Nokhbatol, F., Menhaj, H., and Shafiee, M. (2010). Fuzzy decision support system for crisis management with a new structure for decision making. Expert Systems with Applications Journal, 37, 3545-3552.
Simon, H.A. (1960). “The New Science of Management Decision.” New York: Harper and Row.
Swanson, E.B. (1982). Measuring User Attitudes in MIS Research Rsearch: A Review. Omega International Journal of Management Science, 10 (2), 157-165.
Taylor, S. and Todd, P.A. (1995). Assessing IT usage: The role of prior experience. MIS Quarterly, 19(2), pp. 561-570.
Venkatesh,V. & Davis, F.D. (1996). A model of the antecedents of perceived wase of use: Development and test. Decision Science, 27, 451-481
Venkatesh, V. & Davis, F. D. (2000). A Theoretical Extension of the Technology Acceptance Model: Four Longitudinal Field Studies. Management Science, 46(2), 186-204.
Venkatesh, V., Morris, M.G., Davis, G.B., and Davis, F.D. (2003). User acceptance of information technology: Toward a unified view. MIS Quarterly, 27(3), 425-478.
Table 1: The demographic characteristic
Gender Frequency Percentage
Female 30 60.0
Male 20 40.0
Total 50 100.0
Age
< 20 years 2 4.0 21-30 years 24 48.0 31-40 years 15 30.0 >41 years 9 18.0
Total 50 100.0
Ethnic
Malay 1 2.0
Chinese 48 96.0
Indian 1 2.0
Total 50 100.0
Level of Education
Secondary school 2 4.0
Diploma 17 34.0
Bachelor's degree 30 60.0 Master's degree 1 2.0
Total 50 100.0
No of years in current organization
< one year 5 10.0
1-5 years 20 40.0
6-10 years 17 34.0
> 10 years 8 16.0
Table 2: Correlation test for Perceived Usefulness (PU) and Intention to Use
PU Intention to Use PU Correlation Coefficient 1.000 0.649**
Sig. (2 tailed) - 0.000
N 50 50
Intention to Use Correlation Coefficient 0.649** 1.000 Sig. (2 tailed) 0.000
-N 50 50
[image:10.612.78.530.128.274.2]**. Correlation is significant at the 0.01 level (2-tailed).
Table 3: Correlation test for Perceived Ease of Use (PEOU) and Intention to Use
PEOU Intention to Use PEOU Correlation Coefficient 1.000 0.689**
Sig. (2 tailed) - 0.000
N 50 50
Intention to Use Correlation Coefficient 0.689** 1.000 Sig. (2 tailed) 0.000
-N 50 50
[image:10.612.89.526.486.628.2]**. Correlation is significant at the 0.01 level (2-tailed).
Table 4: Correlation test for Intention to Use and DSS Usage
Intention to Use Usage Intention to Use Correlation Coefficient 1.000 0.657**
Sig. (2 tailed) - 0.000
N 50 50
Usage Correlation Coefficient 0.657** 1.000 Sig. (2 tailed) 0.000
-N 50 50
Acknowledgement
The authors would like to thank Universti Tun Hussein Onn Malaysia (Exploratory Research Grant Scheme/ERGS Reference no E013) for funding of this research.