An Early Screening System for the Detection of Diabetic
Retinopathy using Image Processing
ABSTRACT
Diabetic Retinopathy (DR) is a leading cause of vision loss. Exudates are one of the significant signs of diabetic retinopathy which is a main cause of blindness that could be prevented with an early screening process In our method, the knowledge of digital image processing is used to diagnose exudates from images of retina. An automatic system to detect and localize the presence of exudates from color fundus images with non-dilated pupils is proposed. First, the image is preprocessed and segmented using CIE Lab color space. The segmented image along with Optic Disc (OD) is chosen. Feature vector based on color and texture are extracted from the selected segment using GLCM . The selected feature vector are then classified as exudates and non-exudates using a K-Nearest Neighbors Classifier. Using a clinical reference model, images with exudates were detected with 97% success rate. The proposed method performs best by segmenting even smaller area of exudates.
Keywords
CIE Lab Color Space, CLAHE, Diabetic Retinopathy (DR), Exudates, GLCM, k-NN.
1.
INTRODUCTION
Diabetic retinopathy is one of the major causes of legal blindness in the working age population around the world. The International Diabetes Federation reports that over 50 million people in India have this disease and it is growing rapidly (IDF 2009a) [2]. In [7], it is estimated that the number of people with diabetes is likely to increase to 366 million by the year 2030 from 171 million at the turn of century. In India, there will be 79 million people with diabetes by 2030 making it the diabetic capital of the world. Even though Diabetic Retinopathy is not a completely curable disease, Photocoagulation using laser can prevent major vision loss. Therefore the timely diagnosis and referral for management of diabetic retinopathy can prevent 98% of severe visual loss. Diabetic Retinopathy is mainly caused by the changes in the blood vessels of the retina that occurs by the increased blood glucose level. Exudates are one of the primary sign of Diabetic Retinopathy [3]. Exudates are yellow-white lesions with relatively distinct margins. Exudates are lipids and proteins that deposits and leaks from the damaged blood vessels within the retina. Detection of Exudates by ophthalmologists is a laborious process as they have to spend a great deal of time in manual analysis and diagnosis. Moreover, manual detection requires using chemical dilation material which takes time and has negative side effects on patients.Hence automaticscreening techniques for exudates
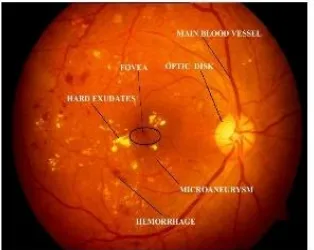
detection have great significance in saving costs, time and labour in addition to avoiding the side effects on patients. Figure 1 depicts a typical retinal image labelled with various feature components of Diabetic Retinopathy. Micro aneurysm are small saccular pouches and appears as small red dots. This may lead to big blood clots called hemorrhages. The bright circular region from where the blood vessels emanate is called optic disk (OD). Macula is the centre portion of the retina and has photoreceptors called cons that are highly sensitive to color and responsible for perceiving fine details. It is situated at the posterior pole temporal to the optic disk. The fovea defines the centre of the macula and is the region of highest visual acuity.
Fig1:Colour Fundus image with various typical components
2.
STATE OF ART
A back propagation multilayer Neural Network for vascular tree segmentation is proposed by Gardener et al [19]. After Histogram Equalization, smoothing and edge detection, the image was divided into 20X20 pixels squares. The Neural Network was then fed with the values of these pixel windows for classifying each pixel into vessels or not.
Akara Sopharak et al [3] reported the result of an automated detection of exudates from low contrast digital images of retinopathy patients with non-dilated pupils by Fuzzy C-Means clustering. Four features such as intensity, standard deviation on intensity, hue and a number of edge pixels were extracted and applied as input to coarse segmentation using FCM clustering method. The detected result were validated with expert ophthalmologists hand drawn ground truths. Sensitivity, Specificity, positive predictive value (PPV) , positive likelihood ratio (PLR) and accuracy were used to evaluate the overall performance of the system.
Doaa Youssef et al [5] proposed a method to detect the exudates using segmentation process. Firstly, the optic disc and blood vessels are eliminated. The Optic Disc is eliminated using Hough Transform. The Blood vessels are detected by applying Edge Detection algorithm. Then the exudates are
B. Ramasubramanian
Assistant Professor Department of ECE Syed Ammal Engineering College Ramanathapuram, TamilNadu, India.
[image:1.595.343.500.375.500.2]segmented using Morphological Reconstruction method. Wynne Hsy et al [6] uses K-Means Clustering and Difference map for detecting the exudates and blood vessels.
Sinthanayothin et al [9] reported the result of an automated detection of Diabetic Retinopathy by Recursive Region Growing techniques on a 10X10 window using selected threshold values. In the pre-processing steps, adaptive, local, contrast enhancement is applied. The author reported a sensitivity of 88.5% and specificity of 99.7% for the detection of exudates against a small dataset comprising 21 abnormal and 9 normal retinal images.
Phillips et al [10] identified the exudates by using Global and local thresholding. The input images were pre-processed to eliminate photographic non-uniformities and the contrast of the exudates was then enhanced. The lesion based sensitivity of this technique was reported between 61% and 100% based on 14 images. A drawback of this method was that other bright lesions (such as cotton wool spots) could be identified mistakenly.
Walter et al [8] identified exudates from green channel of the retinal images according to their gray level variation. The exudates contour were determined using mathematical morphology techniques. This method used three parameters: size of the local window and two threshold value. Exudates regions were initially found using first threshold value. The second threshold represents the minimum value, by which a candidate pixel must differ from its surrounding background to be classified as exudates. The author achieved a sensitivity of 92.8% and predictivity of 92.4% against a set of 15 abnormal retinal images. However the author ignored some types of errors on the border of the segmented exudates in their reported performances and did not discriminate exudates from cotton wool spots.
3.
PROPOSED METHOD
3.1
Image Acquisition:
To evaluate the performance of this method, the digital retinal images were acquired using Topcon TRC-50 EX non-mydriatic camera with a 50˚ field of view at Aravind Eye hospital, Coimbatore. Also, the proposed algorithm were tested and evaluated on DRIVE and MESSIDOR databases. The image set contains both normal and abnormal (pathological) cases.
3.2
Pre-processing:
Color fundus images often show important lighting variation, poor contrast and noise. Preprocessing is used to eliminate these imperfection and to generate image that provides more information for classification process. The pre-processing consists of following steps: 1) RGB to HSI conversion 2) Median Filtering 3) Contrast Limited Adaptive Histogram Equalization (CLAHE).
3.2.1
RGB to HSV Conversion:
The input retinal images in RGB Colour space are converted to HSV color space. The noise in the images are due to the uneven distribution of the intensity(V) component.
3.2.2
3X3 Median Filtering:
In order to uniformly distribute the intensity throughout the image, the intensity component of HSV colour space is extracted and filtered out through a 3X3 median filter.
Fig 2: Input Image in HSV color space
3.2.3
Contrast Limited Adaptive Histogram
Equalization (CLAHE):
The contrast limited adaptive histogram equalization is applied on the filtered intensity component of the image [12]. The histogram equalized intensity component is combined with HScomponent and transformed back to the original RGB colour space.
3.3
Image Segmentation using L*a*b color
space:
In this approach, we present a novel image segmentation based on color features from the images. Firstly, the image is converted from RGB color space to L*a*b color space. Then, the regions are grouped into a set of five clusters using nearest neighbor rule. By this process, we reduce the computational cost avoiding feature calculation for every pixel in the image. The process is described by the following steps:
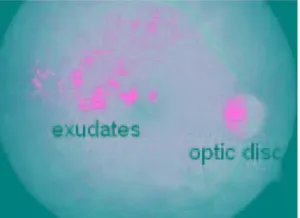
Step 1: Read the image. Figure 3 shows the example input retinal image with exudates.
Fig 3: Input color fundus Image(after preprocessing)
Fig 4: Input Image in L*a*b color space.
Step 3: Segment the colors in a*b* space using Nearest Neighbor rule. Using this method the object is segmented into five clusters using the Euclidean distance metric.
Step 4: Label every pixel in the image obtained from the above steps using the cluster index.
Step 5: Create images that segment the images by colour. Step 6: Since the Optic Disc and Exudates are homogenous in their colour property, cluster possessing Optic Disc is localized for further processing.
3.4
Feature Extraction:
The set of features which provides more meaningful information for classification are extracted from the selected cluster using GLCM [14]. The features extracted from the selected clusters are contrast, correlation, cluster prominence, cluster shade, Dissimilarity, Entropy, Energy, Homogeneity, Sum of Squares [1].
The mean and the standard deviation are given by:
μ
x=
(1)
μ
y =(2)
σ
x =(3)
σ
y =(4)
Entropy
=
(5)
Homogeneity =
(6)
Contrast =
(7)
3.5
Feature Selection using Particle Swarm
Optimization (PSO):
Particle Swarm Optimization is a stochastic optimization technique developed to simulate the social behavior of organisms. The initial swarm is usually created in such a way that the population of the particles is distributed randomly over the search space. At each iteration, the particle is updated by following two best values, called pbest and gbest. Each particle keeps track of its coordinates in the problem space,which are associated with the best solution the particle has achieved so far. This fitness value is stored, and called pbest. When a particle takes the whole population as its
topological neighbour, the best value is a global best value and is called gbest [19].
3.6 Classification using K-NN Classifier:
The feature vectors obtained above are classified into normal or abnormal using K Nearest Neighbor (KNN) Classifier. It is one of the simplest but widely used machine learning algorithm. An Object is classified based on the distance from its neighbor. In our process, a set of 100 images were selected ,out of which 60 are normal and 40 are abnormal. For supervised classifiers, two sets are required; one for training and the other for testing. The training set contains 30 normal and 20 abnormal images. Feature vector that are determined using the above procedure are given as input for KNN classifier. The testing set contains 50 images to test the performance of the classifier.
4.
RESULTS AND DISCUSSION
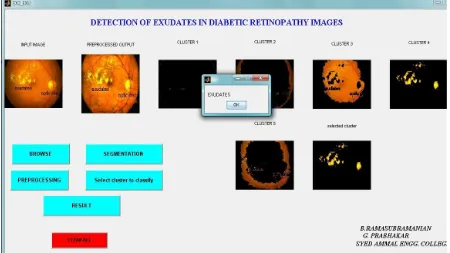
In this approach, we have proposed a method to automatically extract exudates from Diabetic Retinopathy images. The pre-processed color retinal image is segmented into five cluster by converting the RGB image into L*a*b color space. The cluster containing Optic Disc is selected and features are extracted.
[image:3.595.82.232.73.182.2]
Fig 5.a: Input color fundus Image.
Figure 5.a shows the input color fundus image obtained from the eyes of Diabetic patient. The input image is preprocessed and converted to L*a*b color space. From the L*a*b color space, a and b components are separated since the color information is present only in the a and b component. Then the image is segmented into five clusters according to the nearest neighbor rule. Of these five clusters, cluster containing OD is selected for further processing. Figure 5.b shows the selected cluster along with Optic Disc.
[image:3.595.318.528.329.479.2]
Parameter Our Proposed Method
Our Existing Method
Success Rate
97%
95%
Time toExecute(Approx.)
40 sec 2 min
[image:4.595.69.519.84.337.2]
Table 1. Comparison of our Proposed Method with Existing.
5.
CONCLUSION:
The input retinal images were downloaded from STARE and DRIVE database. Exudates are the earlier signs of diabetic retinopathy. The low contrast digital image is enhanced using Contrast Limited Adaptive Histogram Equalization (CLAHE). The noise are removed from the images using median filtering. The Contrast enhanced color image is segmented using by converting the RGB color image into L*a*b color space. To Classify these segmented image into exudates and non-Exudates, a set of features based on texture and color are extracted using Gray Level Co-Occurrence Matrix (GLCM). The set of features are optimized using Particle Swarm Optimization (PSO) method. Then the images are classified into exudates and non-exudates using K-Nearest Neighbor (KNN) Classifiers. The method is evaluated on 70 abnormal and 30 normal images. Out of these 100 images, 97 images were detected successfully and thus a success rate of97% was obtained.
6.
REFERENCES
[1] B.Ramasubramanian, G. Mahendran, An efficient Integrated approach for the detection of exudates and Diabetic Maculopathy in color fundus Images. In Advanced Computing: an International Journal.. .
[2] International Diabetic Federation (IDF), 2009a, Latest diabetes figures paint grim global picture.
[3] Akara Sopharak, Bunyarit Uyyanonvara, Sarah Barman, “Automatic Exudate Detection from Non-dilated Diabetic Retinopathy retinal images using Fuzzy C-Means Clustering” Journal of Sensors, vol.9, No. 3, pp 2148- 2161, March 2009.
[4] Saiprasad Ravishankar, Arpit Jain, Anurag Mittal, “Automated feature extraction for early detection of Diabetic Retinopathy in fundus images”. IEEE Conference on Computer vision and pattern Recognition, pp. 210-217, August 2009.
[5] Doaa Youssef, Nahed Solouma, Amr El-dib, Mai Mabrouk, “New Feature-Based Detection of Blood Vessels and Exudates in Color Fundus Images“ IEEE conference on Image Processing Theory, Tools and Applications,2010,vol.16,pp.294-299.
[6] Wynne Hsu, P M D S Pallawala, Mong Li Lee, Kah-Guan Au Eong. The Role of Domain Knowledge in the Detection of Retinal Hard Exudates. IEEE Conference on Computer Vision and Pattern Recognition (CVPR) ,Kauai Marriott, Hawaii, 2001.
[7] Sarah Wild, Gojka R, Andres G, Richard S and Hilary K, “Global Prevalence of Diabetes”, Diabetes care, vol. 27, no. 5, pp. 1047-1053,2004.
[8] T. Walter, J.Klein, P.Massin and A.Erginary, “A Contribution of image processing to the diagnosis of Diabetic Retinopathy detection of exudates in color fundus images of the human retina”, IEEE Trans. On Med. images, vol. 21, no. 10, pp. 1236-1243, 2002. [9] C. Sinthanayothin, “Image analysis for automatic
[10]Fleming. AD, Philips. S, Goatman. KA, Williams. GJ, Olson. JA, sharp. PF, “Automated detection of exudates for Diabetic Retinopathy Screening”, Journal of Phys. Med. Bio., vol. 52, no. 24, pp. 7385-7396, 2007. [11]Guoliang Fang, Nan Yang, Huchuan Lu and Kaisong Li,
“Automatic Segmentation of Hard Exudates in fundus images based on Boosted Soft Segmentation”, International Conference on Intelligent Control and Information Processing, pp. 633-638, Sept 2010
[12]Pizer. S.M. “The Medical Image Display and analysis group at the university of North Carolina:Reminiscences and philosophy ” IEEE Trans On Medical Imaging, vol. 22, no. 1, pp. 2-10, April 2003.
[13]Plissiti.M.E., Nikar.C, Charchanti.A, “Automated detection of cell nuclei in pap smear images using morphological reconstruction and clustering” IEEE Trans. On Information Technology in Biomedicine, vol.15,no. 2, pp. 233-241, March 2011.
[14]Seongijin park, Bohyoung Kim, Jeongjin Loe“ GGO nodule volume preserving Non-rigid Lung Registration using GLCM texture analysis”, IEEE Trans. On Biomedical Engg., vol. 58, no. 10, pp. 2885-2894, sept 2011.
[15]Kandaswamy.U, Adjerch.D.A, Lee.M.C, “Efficient Texture analysis of SAR imagery”, IEEE Trans. On Geoscience and Remote Sensing, vol. 43, no. 9,pp. 2075-2083, August 2005
[16] Tobin.K.N, Chaum.E, Govindasamy.V.P, “Detection of anatomic structures in human retinal imagery” IEEE Transactions on medical imaging, vol. 26, no. 12,pp. 1729-1739, December 2007.
[17] Gwenole Quellec, Stephen R. Russell, and Michael D. Abramoff, Senior Member, IEEE “ Optimal Filter Framework for Automated, Instantaneous Detection of Lesions in Retinal Images” IEEE Trans. on medical imaging, vol. 30, no. 2,pp. 523-533, Feb 2011. [18] Akara Sopharak, Bunyarit Uyyanonvara, sarah Barman,
“Comparative analysis of automatic exudates detection algorithms”, Proceedings of the world congress on Engg., Vol I, Dec 2011.