PPAS: Programmable Power Analysis Method
for Analyzing and Optimizing Power
Consumption in Smartphone
Rashida Hasan
Dept. of Computer Science & Engineering
University of Dhaka Bangladesh
Feroz Jahangir Rana
Dept. of Computer Science & Engineering
University of Dhaka Bangladesh
Jainal Uddin
Dept. of Computer Science & Engineering
University of Dhaka Bangladesh
ABSTRACT
New and innovative applications for mobile consumer-electronic devices, especially for Smartphones are developing rapidly, advances in battery technology have not kept pace with rapidly growing energy demands. Since, the batteries are limited in size and therefore capacity, power consumption is a critical concern for battery driven Smartphone and this implies that managing energy well is paramount in such device. The core need for good energy management requires a better understanding of where and how the energy is used: how much of the system’s energy is consumed by which parts of the system and under what circumstances. This paper focuses on understanding the power consumption of major hardware components and their usage on different scenarios. We present a detail analysis of the power consumption of iPhone and develop a method PPAS-programmable power analysis method to analyze power consumption in different scenarios. This work identifies the most promising areas to focus on for further improvements of power management as well as implement some effective techniques to optimize power consumption.
Keywords
Smartphone, power consumption, iPhone, iOS
1.
INTRODUCTION
A Smartphone or smart phone is a mobile phone built on a mobile operating system, with more advanced computing capability and connectivity than a feature phone [1]. These devices promise to offer a large spectrum of applications including communication, planning, entertainment, web browsing, Wi-Fi, multimedia applications such as streaming video players, games, image and video capturing tools, location-aware mobile applications, location-based tracking applications and more. The Smartphone usage can be characterized into four key dimensions including user interactions; application usage, network traffic and energy drain [2].
The complexity and capabilities of these devices continues to grow at an amazing pace, but battery capacity is severely restricted due to constrain on size and weight of the device. Therefore, the power consumption has emerged as a key issue of the energy management of portables. Smartphone manufacturers have now much attention on the optimization of power consumption. Due to the lack of proper understanding of power usage in Smartphone, a lot of applications have not developed in perfect ways; therefore power is draining rapidly when the applications are running. This implies that energy efficiency of these devices is very
important to their usability and needs to optimize the usage of power.
Effective and efficient energy management requires good understanding of where and how the energy is used, how much energy is consumed by which parts of the system and under what circumstances.
This paper attempts to answer these questions and provide a good analysis of the uses of power by different functionalities. We collect power consumption data using software which is a better solution for latest devices. Because it is very difficult to take physical power measurements at the component level on a piece of real hardware due to the integration of hardware components into a single chips or board. Some effective and optimized techniques are also discussed with comparison data which will help all the Smartphone application developers to develop applications with optimized ways to save powers. The rest of the paper is organized as follows. Section 2 presents the related work regarding power consumption in Smartphones. Section 3 provides a brief overview of Smartphone architecture and the operating systems used in Smartphones. In section 4, we present the data collection methodology. Section 5 presents the experimental results with effective techniques to optimize power consumption. Finally, we conclude our work on section 6.
2.
RELATED WORK
Recently Smartphones have received significant attention from researchers. The advancement and growth of Smartphone depends on the proper usage of power and performance. Many researchers mentioned their own ways to save energy in Smartphones.
Caroll presented a detailed analysis of the power consumption of an old Smartphone device named Openmoko [3]. Power consumption is analyzed by taking physical power measurements at the component level on a piece of real hardware. Sense resistors are inserted on the power supply rails of the major hardware components which were possible because the selected device has been designed with placeholders for sense resistors. But now it is very difficult to take physical power measurement at the component level on a piece of real hardware because most of the components of hardware are integrated into a single chip or board.
did not provide energy consumption monitoring in a developers perspective. Both of these researches are done on Android Smartphone.
3.
SMARTPHONE ARCHITECTURE
[image:2.595.66.274.193.390.2]This section describes the Smartphone architecture and their OS platform. The configuration of the hardware platform currently used in a Smartphone is shown schematically in figure 1.
Fig 1: Smartphone hardware platform[6]
The platform is composed of an application processor, a modem (baseband), a wire-less unit, a power supply, an audio LSI, synchronous dynamic random access memory (SDRAM) and flash memory.
The application processor is composed of a CPU, a graphics processing unit (GPU) and controllers for its memory, peripheral devices and display. These are the key components for attaining the high performance and functionality needed for a Smartphone. The demand for increased performance has driven the evolution of ARM CPU which is 32-bit RISC processor featuring highly optimized architecture, with few transistors and extremely low power consumption.
A graphic processing unit (GPU) is a specialized electronic circuit designed to rapidly manipulate and alter memory to accelerate the creation of images in a frame buffer intended for output to a display. Modern GPUs are very efficient at manipulating computer graphics and their highly parallel structure makes them more effective than general-purpose CPUs.
Smartphone operating systems combine the features of a personal computer operating system with other features including a touch screen, cellular, Bluetooth, Wi-Fi, GPS mobile navigation, camera, video camera, speech recognition, voice recorder, music player, near field communication and more. The most common Smartphone operating systems are iOS, Android, Blackberry, Symbian and Windows phone.
4.
PPAS: DATA COLLECTION
METHODOLOGY
[image:2.595.317.541.263.449.2]Presently, it is very difficult to take physical power measurement at the component level on a piece of real hardware because most of the components of hardware are integrated into a single chip or board. So we cannot use the power calculation equation P=Vt easily. This research presents PPAS (Programmable Power Analysis Method in Smartphone) to analyze the energy consumption of the application on Smartphone. iOS is considered for developing PPAS method and all data collection and experimental results are made based on the output of the applications of iPhone. PPAS technique for data collection is applicable to other platforms like android, Windows phone etc. Table 1 shows the iPhone 4s and iPhone 5 specification [7], [8].
Table 1. iPhone 4s and iPhone 5 specification
Design Apple iPhone 4s Apple iPhone 5 Hardware
System chip Apple A5 Apple A6 Processor Dual core,
800MHz, ARM Cortex-A9
Dual core, 1300 MHz, Apple Swift
Graphics processor
PowerVR SGX543 MP2
PowerVR SGX543 MP2 System
memory
512 MB RAM/DDR2 (800
MHz)
1 GB RAM/DDR2
Built-in storage
16 GB 16 GB
Display
Physical size 3.5 inches 4 inches Resolution 640 x 940 pixels 640 x 1136 pixels Pixel density 326 ppi 326p ppi
To profiling the energy consumption in iPhone, PPAS method first establishes the baseline power state of the device which is a state when no applications are running, even no task in background. To get more accurate power consumption data, it considers one important feature of iOS that is airplane mode which disables the wireless features of iPhone including cellular (voice and data), Wi-Fi, Bluetooth, GPS and location services. During data collection, PPAS also take into account the power consumption of display based on some functionality. Then it runs specific task for specific components for long time to get data. The real power consumption data is obtained by comparing the new data with old data.
While taking sample, the phone is kept busy only with that operation as we focus on power consumption or discharge rate. For example, when collecting sample for browsing using GPRS (2G), Wi-Fi, BT, GPS, Auto sync are kept off. In addition, it keeps minimum number of tasks running and killed most of the task of the device before taking sample data. Figure 2 shows the algorithmic description of PPAS.
Algorithm: PPAS
[dr[B] is the discharge rate in minutes at brightness B]
1. Establish base line power state of the device 2. IF operation does not need network service
3. Collect baseline power consumption data with some fixed interval periodically
4. Run specific task for specific component for long time
5. Consider brightness in calculation IF backlight is on
Collect data with 100% and 15% fixed brightness
𝑑𝑟 𝐵 =𝑑𝑟100 − 𝑑𝑟15
100 − 15 ∗ 𝐵 − 15 + 𝑑𝑟15
6. Again collect power consumption data with a fix interval periodically
7. Compare this data with baseline data to get actual power consumption data
Fig 2: Algorithmic description of PPAS
The major functionalities that was taken into account for data collection includes browsing, video playback, audio playback, Bluetooth, talk time, voice call, navigation, OpenGL drawing, camera, standby and airplane mode.
4.1
Browsing
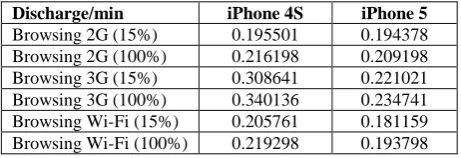
[image:3.595.71.281.70.268.2]A web browser is a software application for retrieving, presenting and traversing information resources on the World Wide Web. PPAS calculates the power consumption for a web browsing workload using both GPRS and Wi-Fi. It sets some fixed popular links which is called repeatedly to make the application busy with only browsing. It considers backlight with brightness 15% and 100% during collecting power consumption data of browsing because one has to use backlight during browsing. Table 2 shows the collected average data for browsing on iPhone 4S and iPhone 5.
Table 2. Power consumed for browsing on iPhone 4S and iPhone 5
Discharge/min iPhone 4S iPhone 5
Browsing 2G (15%) 0.195501 0.194378 Browsing 2G (100%) 0.216198 0.209198 Browsing 3G (15%) 0.308641 0.221021 Browsing 3G (100%) 0.340136 0.234741 Browsing Wi-Fi (15%) 0.205761 0.181159 Browsing Wi-Fi (100%) 0.219298 0.193798
4.2
Video Playback
Power consumption of video playback is very high comparing to other features. PPAS considers backlight with brightness 15% and 100% during collecting power consumption data of playing video. For experimental set up a long duration video is played and take sample with fixed interval. Hardware and software decoders are used to play video which has a significant impact on power discharge rate. Software decoding is flexible and support many file types than hardware decoding. Since software decoder performs its video processing task on CPU so it uses more power than hardware decoder. FFmpeg library is used for software decoder to measure power consumption. Table 3 shows the collected average data for video playback using hardware decoder and table 4 shows the power consumption data for video playback using software decoder.
4.3
Audio Playback
The measurements for audio playback are taken with backlight off because typically someone listens to music while carrying the phone in their pocket. The samples are collected by playing a long duration audio music. While taking samples, all other applications are stopped from running in background. The power consumption data for audio playback is shown in table 5.
Table 3. Power consumption of video playback using hardware decoder
Discharge/min iPhone 4S iPhone 5
Video Playback (15%) 0.202125 0.199601 Video Playback (100%) 0.234741 0.229885 Airplane ON (15%) 0.181159 0.178826 Airplane ON (100%) 0.204498 0.198412
Table 4. Power consumption of video playback using software decoder
Discharge/min iPhone 4S iPhone 5
Video Playback (15%) 0.262647 0.260824 Video Playback (100%) 0.305250 0.303582 Airplane ON (15%) 0.233764 0.210970 Airplane ON (100%) 0.259201 0.256016
Table 5. Power consumed for audio playback on iPhone 4S and iPhone 5
Discharge/min iPhone 4S iPhone 5
Audio Playback 0.046296 0.045045 Airplane ON 0.045167 0.043630
Table 6. Power consumed for Bluetooth on iPhone 4S and iPhone 5
Discharge/min iPhone 4S iPhone 5
Bluetooth 0.081699 0.079744 Bluetooth 0.091074 0.087260
Table 7. Power consumed for talktime on iPhone 4S and iPhone 5
Discharge/min iPhone 4S iPhone 5
Talktime 2G 0.126263 0.135501 Talktime 3G 0.219298 0.209643
4.4
Bluetooth
iPhone Bluetooth have some restriction like it can’t transfer file from iPhone device to other types of Smartphones. So an external accessory is used to transfer data between them with a fixed data rate of 55 kbps. The measurements are taken with backlight off and stop all other application running in the background. The power consumption average data for Bluetooth is presented in table 6.
4.5
Talktime
[image:3.595.52.283.501.580.2]to the public telephone network. The power consumption average data for talktime is shown in table 7.
Table 8. Power consumption of video voice call
Discharge/min iPhone
4S
iPhone 5
Skype Video Call 3G (15%) 0.375000 0.311111 Skype Video Call 3G (100%) 0.533333 0.375000 Skype Video Call Wi-Fi (15%) 0.20000 0.257143 Skype Video Call Wi-Fi (100%) 0.366667 0.300000
4.6
Voice Call (Skype)
The measurement of power consumption of video voice call is taken using Wi-Fi and GPRS network while considering backlight turn on. But in audio voice call, backlight is skipped since it is not necessary. The collected average data for video voice call and audio voice call is shown in table 8 and table 9.
Table 9. Power consumption of audio voice call
Discharge/min iPhone 4S iPhone 5
Skype Audio Call 3G 0.135501 0.126198 Skype Audio Call Wi-Fi 0.104872 0.098730
Table 10. Power consumption of Navigation
Discharge/min iPhone 4S iPhone 5
Navigation (15%) 0.375000 0.311111 Navigation (100%) 0.403213 0.375000
Table 11. Power consumption of OpenGL drawing
Discharge/min iPhone 4S iPhone 5
OpenGL (15%) 0.231481 0.210970 OpenGL (100%) 0.252321 0.245098 Airplane mode ON (15%) 0.213675 0.200803 Airplane mode ON (100%) 0.234741 0.2283105
Table 12. Power consumption of camera
Discharge/min iPhone 4S iPhone 5
Camera (15%) 0.303012 0.292079
Camera (15%) 0.370371 0.346500
Airplane ON 0.283224 0.264131
Table 13. Power consumption of standby
Discharge/min iPhone 4S iPhone 5
Cellular 2G 0.006768 0.005453 Cellular 3G 0.009259 0.008333
4.7
Navigation
iPhone has a GPS unit that allows the sending and receiving of signals to and from satellites to determine exact location, which is integral for some apps to work, for example, map-based apps like Google Maps or to check-in on Facebook. Some of these apps may continue to send and receive signals during running in the background which takes a lot of our battery to continuously do that even if we aren’t aware of it. Therefore, all those apps are stopped if we really don’t need them. The backlight with brightness 15% and 100% is taken into account when dealing with maps or locations. Table 10
presents the collected average data of power consumption for navigation.
4.8
OpenGl Drawing
To measure the power consumption of OpenGL, an application is made that uses OpenGL framework to draw some objects on display. The app has run for long time to collect power consumption data and stopped all other applications during running in the background. Table 11 shows the collected average data of power consumption for OpenGL drawing.
4.9
Camera
Table 12 shows the power consumption when using camera. The backlight is considered during collecting power consumption data of camera and stopped all the applications running in the background
4.10
Standby
To measure the power consumption of standby, all other applications are stopped running in the background and keep airplane mode OFF because Smartphone is used in this state. For verification, we compare our collected data with the provided technical specification of the device. Table 13 presents the collected average data for standby on iPhone 4s and iPhone 5.
4.11
Airplane Mode
To measure the power consumption in airplane mode, all other application are stopped running in the background. The setting of iOS is checked to verify that the airplane mode is ON. Table 14 shows the average power consumption data for airplane mode ON.
Table 14. Power consumption data for Airplane mode
Discharge/min iPhone 4S iPhone 5
Airplane ON 0.005376 0.004761
5.
RESULTS
In this section, some effective techniques are discussed for optimizing power consumption in iPhone. These techniques are also applicable to other platforms such as android, Windows phone etc. The results are also presented for the purpose of demonstrating the efficiency and effectiveness of proposed techniques. The superiority of proposed optimized techniques has been demonstrated by comparing it with normal way of power consumption. To develop PPAS, we use Macbook Pro: core i5 PC and xCode 4.5 as IDE (Integrated development Environment) and Xcode instrumental tools are used for performance analysis and memory issues.
5.1
Wi-Fi with GPS System
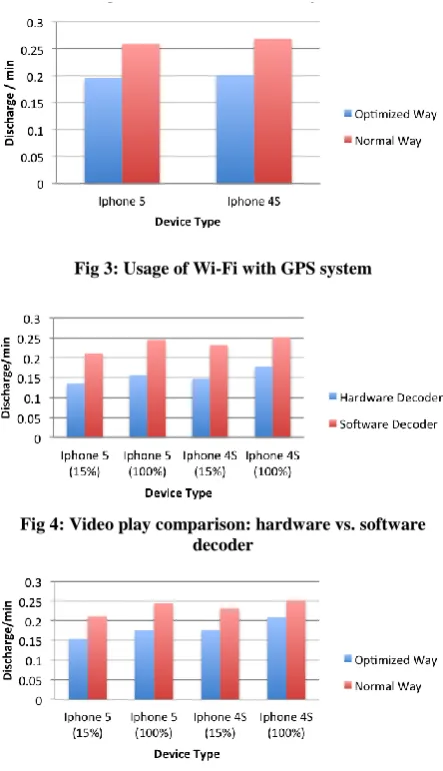
Therefore, if we go outside of the range of areas, GPS notify the Smartphone to turn OFF Wi-Fi automatically so that unnecessary use of Wi-Fi will not drain the power of battery. To compare proposed approach with normal usage approach, we installed app and run for a long time with switching among different zones. The comparison of these two approaches is shown in figure 3. It is obvious from the figure that our optimized way using Wi-Fi takes less power than the normal way and demonstrates the efficiency of our approach.
[image:5.595.55.277.176.562.2]Fig 3: Usage of Wi-Fi with GPS system
Fig 4: Video play comparison: hardware vs. software decoder
Fig 5: OpenGL drawing with caching mechanism
5.2
Video Play Comparison: Hardware vs.
Software Decoder
From the power consumption calculation, it is found that hardware decoding lead to glitches in the video and cannot support many file types compared to software decoding. But software decoding requires much power. So to optimize power consumption for video play, PPAS approach uses hardware decoding for video play. Figure 4 shows the comparison. It demonstrates that hardware decoder consumes significant amount of less power than software decoder.
Fig 6: Backlight control with orientation
5.3
OpenGL Drawing with Caching
Mechanism
[image:5.595.55.276.184.288.2]To display OpenGL drawing with less power and high performance, OpenGL ES texture cache is used to get quick access to the raw pixels within an OpenGL ES texture. We take advantage of this to grab the pixels for an OpenGL ES rendering by using a frame buffer object with an attached texture which has been supplied from the texture cache. Therefore, it minimizes the unnecessary access to read the high resolution frame from main memory and saves power and makes the performance better. To compare power consumption, two applications are developed: one using cache mechanism and another without cache. Figure 5 shows the efficiency of proposed approach. The power discharge rate is low when we use caching mechanism to draw OpenGL views.
Fig 7: Backlight control with gyroscope
5.4
Backlight Control with orientation or
Gyroscope
From data collection, it is found that backlight consumes a significant amount of power comparing to other components. Therefore, backlight can control perfectly by auto turn OFF and save power.
[image:5.595.316.541.408.519.2]5.5
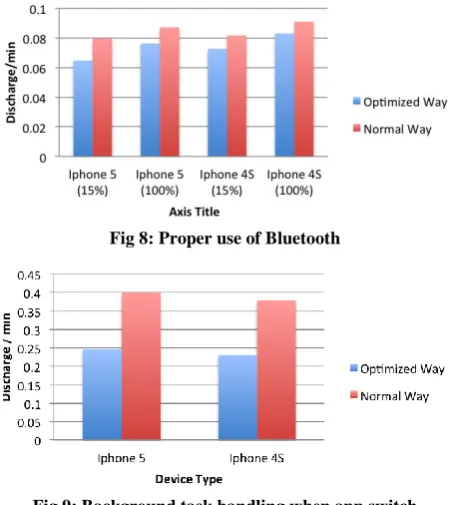
Proper Use of Bluetooth
[image:6.595.54.281.189.442.2]Analyzing power consumption data of Bluetooth with some scenarios, it is found that discovery time and trying to pair time of Bluetooth with other devices plays an impact on power consumption. Most of the times we forget to switch OFF our Bluetooth option when it’s not necessary. In proposed approach, it sets some time to turn OFF Bluetooth when it’s not in pair state. The comparison of optimized approach with normal approach is shown in figure 8.
Fig 8: Proper use of Bluetooth
Fig 9: Background task handling when app switch frequently
Fig 10: Background task handling when app switch rare
5.6
Background Task Handling
Often we don’t consider background task but it cumulatively may drain the battery very quickly. PPAS avoids this power consumption by manually stop those task which are not necessary to run in background. To compare the output, we develop an app with the above mentioned technique and run the application for long time to collect data. While comparing, two cases has been considered: one is when app switch frequently and another is when app switch rare. Figure 9 and figure 10 show the robustness and effectiveness of our proposed optimized way.
6.
CONCLUSION
This paper presents the design of PPAS method which can be used to analyze and optimize the energy consumption of Smartphone. We performed a details analysis of energy consumption of iPhone considering all major hardware components. We also focused on the major factors related to the drain of Smartphone battery life. Some effective techniques are also discussed which will help to lengthen the battery life of Smartphone. Experiments on different scenarios show that the proposed optimized techniques improve performance and saves battery with compared to the normal approach. This work will give both the Smartphone users and developers a good knowledge of the power usage in different scenarios. There are number of directions where researchers can contribute. This research can be applied for analysis power consumption of upcoming functionalities and latest technologies like LTE However, the power consumption analysis is done from application layer only, kernel or OS layer is not considered. We hope to improve our method so that it can do power consumption analysis both in application layer and OS layer.
7.
ACKNOWLEDGEMENTS
Department of Computer Science and Engineering, University of Dhaka had given sufficient support and helps to complete this research by providing us lab facilities and research journals.
8.
REFERENCES
[1] W. Browsing. http://en.wikipedia.org/wiki/web_browser. (accessed 10 Jan 2014)
[2] Falaki, H; Mahajan, R; Kandula, S; Lymberopoulos, D; Givondan, R; & Estrin, D. 2010. Diversity in smartphone usage. In proceedings of the 8th International conference on Mobile System, Applications and Services. 179-194. [3] Carroll, A., Heiser, G., 2010. An analysis of power
consumption in a Smartphone. In proceedings of the 2010 USENIX Conference on USENIX Annual Technical Conference.
[4] Crk, I., Albinali, F., Gniady, C., & Hartman, J. 2009. Understanding energy consumption of sensor enabled applications on mobile phones. In Engineering in Medicine and Biology Society, 2009. EMBC 2009. Annual International Conference of the IEEE. pp. 6885-6888.
[5] Ding, F., Xia, F., Zhang, W., Zhao, X., & Ma, C. 2011. Monitoring energy consumption of Smartphone. In Internet of Things (iThings/CPSCom), 2011 International Conference on and 4th International Conference on Cyber, Physical and Social Computing. 610-613. IEEE. [6] Ogawa, T., Ito. K., & Matsushima, K. 2013. Hardware
Platform Supporting Smartphones. Fujitsu Sci. Tech. J. 49(2). 231-237.
[7] https://www.apple.com/iphone-5s/specs. (accessed 8 Dec 2014)
![Fig 1: Smartphone hardware platform [6]](https://thumb-us.123doks.com/thumbv2/123dok_us/8050831.773878/2.595.66.274.193.390/fig-smartphone-hardware-platform.webp)