molecular beacon technology. NASBA is normally applied to amplify single-stranded target RNA, producing RNA amplicons. In this work we show that with modifications like primer design, sample extraction method, and template denaturation, the NASBA technique can be made suitable for DNA target amplification resulting in RNA amplicons. A major advantage of our assay is the one-tube, isothermal nature of the method, which allows high-throughput applications for nucleic acid detection. The homogeneous real-time detection allows a closed-tube format of the assay, avoiding any postamplification handling of amplified material and therefore minimizing the risk of contamination of subsequent reactions. The assay has a detection range of 103to 109
HBV DNA copies/ml of plasma or serum (6 logs), with good reproducibility and precision. Compared with other HBV DNA assays, our assay provides good sensitivity, a wide dynamic range, and high-throughput applica-bility, making it a viable alternative to those based on other amplification or detection methods.
Infection with hepatitis B virus (HBV) can cause a spectrum of liver diseases, such as fulminant or chronic hepatitis, cirrho-sis, and hepatocellular carcinoma. About 300 million people throughout the world suffer from chronic HBV infection, and 2 billion people have markers indicating past infection with HBV (15, 25).
HBV is the smallest DNA virus known, and its genome shows a highly compact organization. A unique aspect in the HBV replication cycle is that a pregenomic mRNA serves as a template for the synthesis of the first viral DNA strand by the reverse transcriptase (RT) polymerase of HBV (35). The RNase H activity of the HBV DNA polymerase removes the mRNA during this process, and synthesis of the complemen-tary second DNA strand is then started, generating a partially double-stranded DNA molecule for packaging in virions. When the virus enters the host, this molecule is extended into a fully double-stranded DNA molecule, thus starting a new replication cycle (10, 27, 28).
HBV DNA can be detected in the blood in more than 90% of infected hosts who are positive for hepatitis B surface anti-gen (HBsAg) and hepatitis B e antianti-gen (HBeAg). The use of detection and quantification of HBV DNA has become the preferred method for measuring the quantity of infectious par-ticles and provides important diagnostic and prognostic infor-mation, mainly as a marker of virus replication (5, 14, 20, 29, 30). Numerous assays are available for detection of HBV DNA, such as the branched DNA (bDNA) assay (6, 13), DNA
hy-bridization assays (9, 24), and quantitative PCR (1, 12, 22). Some of these assays have only limited sensitivity, however, and detection by PCR may be considered to be laborious and susceptible to contamination. Since HBV DNA loads are highly variable and require a broad dynamic detection range (18, 19), these assays are not always well suited for large-scale use in clinical laboratories.
We present a one-tube, real-time detection and quantifica-tion method for HBV DNA using nucleic acid sequence-based amplification (NASBA) and detection with molecular beacon technology. The NASBA technique is normally applied to am-plify single-stranded target RNA, producing RNA amplicons (7, 31). The amplification in the NASBA reaction involves the action of three enzymes: avian myeloblastosis virus (AMV) RT, T7 RNA polymerase, and RNase H. Two specific oligo-nucleotide primers, one of which contains a bacteriophage T7 RNA polymerase promoter site, are added to amplify nucleic acids more than 1012-fold in 90 to 120 min. The primer with the
T7 tail binds to the single-stranded RNA and is being extended by the RT. After degradation of the template by RNase H, the second primer can bind to the cDNA and is extended to form a double-stranded product, with a double-stranded T7 pro-moter sequence. From this double-stranded product, single-stranded RNA can be transcribed which can then enter a new cycle of amplification.
We show that after modifications such as primer design, sample extraction method, and template denaturation, the NASBA technique can be used for DNA target amplification resulting in RNA amplicons.
Our closed one-tube assay is able to quantify HBV DNA in a wide dynamic range with good sensitivity, reproducibility, and precision. The assay requires relatively simple laboratory tools and has a format well suited for high-throughput process-* Corresponding author. Mailing address: Department of Human
Retrovirology, Meibergdreef 59, Academic Medical Center, 1105 BA Amsterdam, The Netherlands. Phone: 31 (0)205667669. Fax: 31 (0)205669081. E-mail: [email protected].
† Present address: Notox, Hertogenbosch, The Netherlands.
3656
on May 15, 2020 by guest
ing of samples (7, 31). Due to omission of postamplification handling of amplified nucleic acids, the risk of contamination of negative samples with amplicons is greatly reduced.
MATERIALS AND METHODS
Patients.A group of 68 patients who had seroconverted for hepatitis B core antibody (anti-HBc) was identified in a population of intravenous drug users and male homosexual individuals. These patients yielded anti-HBc-positive samples obtained at various time-points.
We also used a Boston Biomedica Inc. (West Bridgewater, Mass.) HBV-positive serum panel, with HBV loads ranging from 102to 107copies/ml.
Serological and biochemical markers of HBV infection.Serum HBsAg, and anti-HBc were measured using commercially available enzyme immunoassays (Hepanostika HBsAg/anti-HBc; Organon Teknika bv., Boxtel, The Netherlands) as indicated by the manufacturer.
Extraction methods. Nucleic acids were extracted from 100 l of serum, plasma, or other liquid medium by applying the well-known silica-guanidinium-thiocyanate (GuSCN) protocol Y (4), using L6 as the lysis buffer.
Alternatively, samples were extracted using one of three modified silica-gua-nidiniumthiocyanate methods.
The first method is referred to as Y⫹(2) and involves the addition of 1 ml of lysis buffer L7A and 30l of size-fractionated silica particles before following the classic Y protocol. L7A is prepared from buffer L6 (5.25 M GuSCN, 50 mM Tris HCl [pH 6.4], 20 mM EDTA, 1.3% [wt/vol] Triton X-100) by the addition of
␣-casein to a final concentration of 1 mg/ml.
In the second method, we applied protocol H (3), which involves predigestion of the sample with 50l of freshly prepared buffer L8 (445l of H2O, 50l of 5 M NaCl, 50l of 20% [wt/vol] sodium dodecyl sulfate, 50l of 1 M Tris HCl–0.1 M EDTA [pH 8.0], 5l of denatured salmon sperm DNA [2 mg/ml], 400l of proteinase K) at 56°C for 30 min, followed by the classic Y protocol. The last method, protocol H⫹, is a modification of protocol H in which lysis buffer L6 is replaced by L7A.
Each sample was always eluted in 50l of TE buffer (10 mM Tris, 1 mM EDTA [pH 8.0]).
Primers and probes.It is anticipated on theoretical grounds that an AT-rich double-stranded DNA sequence with a low-melting-temperature profile would more efficiently enter the amplification phase than sequences with a high-melt-ing-temperature profile (B. van Gemen, personal communication).
Therefore, we selected a primer pair to amplify a single-stranded region of the HBV genome, which has a relatively low melting profile, as shown in Fig. 1.
Nucleic acid extracted from sera or plasma of HBV-infected individuals and from plasmid models was amplified with NASBA using a primer set for HBV DNA amplification spanning the HBVpolgene nucleotides 613 to 817 (Table 1). The probe used in this experiment (Pom gen8) is labeled with 6-fluorescine (6-FAM) (fluorescent label) at its 5⬘end and with {[4-(dimethylamino)phenyl] azo}benzoic acid (DABCYL) (quencher) at its 3⬘end. Furthermore, the molec-ular beacon probe contains two inosine nucleotides, and both primers are de-generated.
HBV DNA real-time NASBA.NASBA reactions were started by mixing 5l of extracted nucleic acid and 10l of NASBA mix in microtubes. The final con-centrations were as follows: 40 mM Tris HCl (pH 8.5), 12 mM MgCl2, 70 mM KCl, 5 mM dithiothreitol, 1 mM deoxynucleoside triphosphate (each), 2 mM rATP, 2 mM rUTP, 2 mM rCTP, 1.5 mM rGTP, 0.5 mM ITP, 0.75 mM EDTA, 15% (vol/vol) dimethyl sulfoxide, 0.2M primer P1, 0.2M primer P2, 0.2M molecular beacon probe, and 0.375 M sorbitol. Subsequently, the reaction mix-tures were incubated at 95°C instead of the standard 65°C (see Results) for 5 min for denaturation, followed by incubation at 41°C for 5 min. Then, the enzyme mix (2.1 mg of bovine serum albumin, 0.01 U of RNase H, 37 U of T7 RNA polymerase, 7.5 U of AMV RT) was pipetted into the lids of the microtubes. The tubes were centrifuged briefly (10 s) at 800 rpm in a centrifuge (model 5804; Eppendorf, Hamburg, Germany) to collect the enzyme mix. After gentle mixing by tapping, the tubes were incubated at 41°C in a fluorometer (Cytofluor 4000; Perkin-Elmer, Wellesley, Mass.) for 120 min, with continuous measurement of the fluorescent signal. The 20-l reaction mixtures were excited at 485 nm, and fluorescence was measured at 530 nm. Readings were normalized to the back-ground of a reaction mixture containing water instead of template.
[image:2.587.119.471.72.252.2]The amount of HBV DNA present in samples was calculated using a standard curve generated from HBV plasmid standards that indicated the relation be-tween time-to-positivity (TTP) and input amount. The plasmid contained a
FIG. 1. Melting-temperature profiles of five different HBV strains. The amplicon generated by the HBV DNA real-time NASBA was located between nucleotides 613 and 817 (see arrow), which is situated in a part of the HBV genome that has a relatively low melting temperature. A low template melting temperature theoretically facilitates the annealing of primers and probes in a NASBA or PCR. The box at the right shows serotype, GenBank accession number, and genotype information for the isolates.
TABLE 1. Sequences of the primers and molecular beacon probe used in the HBV DNA real-time NASBA
Name Function Sequencea
Pom P1.8 Primer P1 5⬘-AAT TCT AAT ACG ACT CAC TAT AGG GAG AAG GAG AGG AAA YTG CAC YTG TAT TCC CAT CCC A-3⬘
Pom P2.6 Primer P2 5⬘-AAA TGT ATA CCC ARA GAC AAA AGA AAA-3⬘
Pom gen8 Probe 5⬘-CGA TCC GAC TCA IGA TGI TGT ACA GAC TTG GCC CCC GGA TCG-3⬘
aItalic type indicates the T7 RNA promoter sequence (including the first three G residues of the RNA that is being made) that is part of the P1 primer. The
nucleotide Y stands for C or T, and the nucleotide R stands for A or G. The nucleotide I stands for inosine.
on May 15, 2020 by guest
http://jcm.asm.org/
[image:2.587.42.544.661.711.2]a linear mixed model, with input concentration modeled as a fixed-effects term and between-run variation modeled as a random-effects term. Results from the NASBA assay were compared with the DNA concentrations expected from the HBV plasmid serial dilutions by Bland-Altman analysis, which performs a re-gression of the difference between outcome and expected concentration onto their average value.
Data were analyzed using the SAS System (version 6.12; SAS Institute, Inc., Cary, N.C.) and SPLUS 2000 software (professional release 2; MathSoft, Inc., Cambridge, Mass.).
CsCl gradient centrifugation of HBV-positive 2.2.15 cell line culture medium.
The 2.2.15 cell line, a well-known HBV-transfected HepG2 cell line, was main-tained under conditions described previously (33). After passage through a 40-m-pore-size filter, HBV-positive 2.2.15 cell line culture medium with a high HBV titer (109copies/ml) was subjected to CsCl gradient analysis (16, 36). One milliliter of sample was loaded on top of 9 ml of a 20% (wt/wt) CsCl (Boehringer Mannheim, Mannheim, Germany) in phosphate-buffered saline solution. Sam-ples were then spun for 72 h at 30,000 rpm and 20°C, using a Beckman SW41Ti swing-out rotor and a Beckman Optima L-70 K ultracentrifuge (Beckman Coulter, Inc., Fullerton, Calif.).
Subsequently, samples were divided into fractions of approximately 250l by removing supernatant with an auto densi-flow II C device (Haake Buchler Instruments, Inc., Saddle Brook, N.J.), starting from the top. Prior to dialysis in 5 liters of phosphate-buffered saline overnight at 4°C, the density of each fraction was determined by refractometry, using a refractometer (Carl Zeiss, Jena, Ger-many). All fractions were then tested for HBsAg by enzyme immunoassay (see above) and HBV DNA with real-time NASBA (see above).
RESULTS
Optimization for real-time monitoring and quantification. The standard NASBA protocol for amplification of RNA en-compasses a 65°C RNA denaturation step prior to the addition of enzymes. For the HBV DNA real-time NASBA, we exam-ined the effect of denaturing at a higher temperature than usual (95 versus 65°C) before the addition of enzyme mix and amplification, because a NASBA reaction needs single-stranded nucleic acid as the target. Since NASBA detection of HBV DNA was clearly improved by incubation at 95°C (Fig. 2), this procedure was incorporated into the HBV DNA real-time NASBA format.
Comparison of isolation protocols.We investigated the bene-ficial effect on some DNA-processing enzymes of adding␣-casein in the extraction procedure (2). This beneficial effect could, in the case of the HBV DNA real-time NASBA, lead to a lower detec-tion limit. The addidetec-tion of␣-casein to the lysis buffer is referred to as protocols Y⫹and H⫹, respectively, when used in protocol Y or
H (see Materials and Methods for details).
The HBV DNA present in virions is a partially
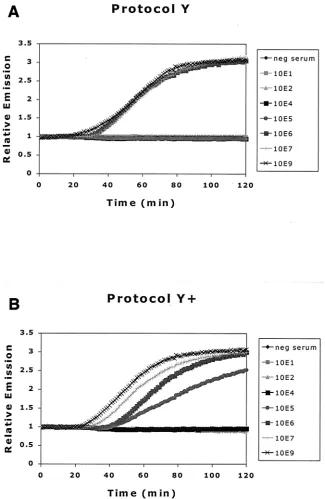
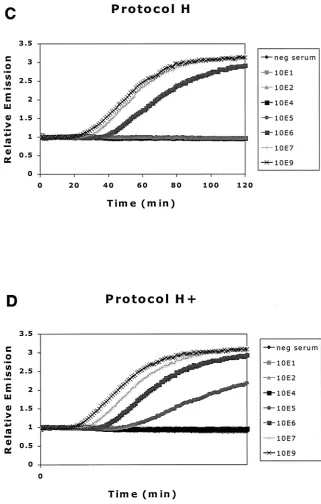
double-Figure 3 shows the results of HBV DNA real-time NASBA after extraction of samples in the serum dilution series. Real-time monitoring of NASBA reactions yields fluorescence plots, with the typical initial exponential rates followed by a plateau phase. The initial exponential rate is consistent with an ampli-fication phase of the NASBA reaction in which the products of amplification function as templates.
In contrast with previous reports (3), we found no enhanced detection of HBV DNA with an extraction method incorpo-rating a proteinase K digestion step, as in protocols H and H⫹
(see protocol Y versus H and Y⫹versus H⫹). However, the
addition of␣-casein to the lysis buffer improved detection by HBV DNA real-time NASBA 10-fold (see protocol Y versus Y⫹and H versus H⫹), in agreement with previous results (2).
Because we found little or no difference between results after protocols Y⫹ and H⫹, further experiments were performed
using the more convenient and rapid Y⫹protocol. With each
extraction, an HBV-negative serum sample and an HBV-pos-itive sample (108copies/ml) were included as controls to
en-sure extraction quality.
Quantitative performance of HBV DNA real-time NASBA. In order to start all reactions simultaneously, enzyme mix was added to the samples by pipetting into the lids of the micro-tubes and subsequently spun down. HBV DNA copy numbers were calculated relative to an HBV DNA plasmid 10-fold dilution series, which was included in every run. The input of this plasmid ranged from 101to 107copies per reaction
mix-ture, and H2O was used as the no-template control.
Data were processed in an Excel 97/98 spreadsheet to cor-rect for background as measured in the no-template control sample and to determine the intercept of the slope with thex axis. Calibration curves were generated and fitted with at least four points of the dilution series of plasmid DNA using the same spreadsheet (Fig. 4). Only if the calculatedR2wasⱖ0.92
was it a valid experiment. The HBV DNA loads of the samples were then extrapolated using these calibration curves. The cutoff of each individual assay was set to be equal to the value of the last positive sample in the dilution series.
Precision.Figure 5 shows the levels of HBV DNA obtained by analysis of high-titer DNA plasmid stock after dilution in water to concentrations in the range from 101to 107copies per
reaction mixture. Table 2 shows the mean HBV DNA load as measured by the NASBA assay as well as the range, standard deviation, and coefficient of variation (CV) at seven
on May 15, 2020 by guest
ized HBV input levels for various numbers of replicates. At 10 copies per reaction mixture, the HBV DNA copy number was overestimated by the NASBA assay (mean response, 17.6 cop-ies per reaction mixture [P ⫽ 0.035]), while at 10,000,000 copies per reaction mixture, the HBV DNA copy number was underestimated (mean response, 5,211,947 copies per reaction mixture [P⫽0.04]). CV ranged from 5.7 to 10.7%, with highest CV found at lower input levels and lowest CV found at higher
input levels. The standard deviation showed a slight tendency to increase with the mean response.
Linearity and reproducibility. Figure 5 shows the levels of HBV DNA obtained by analysis of high-titer HBV DNA plas-mid stock after dilution in water (from 10 to 10,000,000 copies/ reaction mixture) in 29 different assays in various numbers of replicates (Table 3). CV ranged from 5.7 to 10.7%. At 10 copies per reaction mixture, there was a tendency to a slight FIG. 2. Effect of denaturation on HBV DNA real-time NASBA. Reaction mixtures with samples were heated at 65°C (A) or 95°C (B) prior to addition of the enzyme mix. We used two plasma samples, each with a known HBV DNA load of 109copies/ml (quantified by bDNA), and a
Boston Biomedica Inc. panel of serum samples, also with known loads (see Materials and Methods). The denaturing step at 95°C improved the sensitivity of the assay, with more samples being detected at that temperature than at 65°C.
on May 15, 2020 by guest
http://jcm.asm.org/
overestimation of the HBV DNA copy number, while at 107
[image:5.587.130.455.71.570.2]copies per reaction mixture, there was a tendency to a slight underestimation of the HBV DNA copy number.
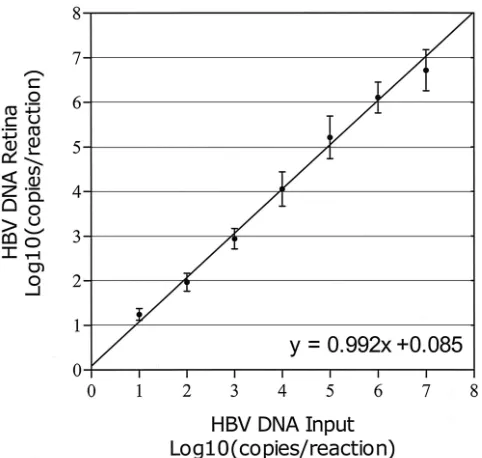
Figure 6 shows the mean response curve as calculated from 29 different runs, with assay variability modeled as a random term in a linear mixed model. From the estimates in Table 2, it can be inferred that the intercept of the mean response curve is not significantly different from 0 and that its slope is not significantly different from 1. However, assay variability is sub-stantial; the standard deviation of the intercept due to
varia-tion between different runs is 0.127 (95% confidence interval [CFI], 0.058 to 0.276) and the standard deviation of the slope due to variation among different runs is 0.037 (95% CFI, 0.023 to 0.061). Correlation among intercept and slope is⫺1, so if the intercept of a standard response curve is larger than aver-age, its slope will tend to be smaller. Table 3 shows the results of the Bland-Altman regression analysis. Both intercept and slope are not significantly different from zero, which shows that there is no general tendency of overestimation or underesti-mation.
FIG. 3. Comparison of effect of different extraction methods on detection of HBV DNA by NASBA. (A) Protocol Y, standard silica-guanidiniumthiocyanate extraction method; (B) protocol Y⫹, addition of␣-casein to lysis buffer; (C) protocol H, proteinase K digestion prior to
extraction; (D) protocol H⫹, both proteinase K digestion prior to extraction and addition of␣-casein to lysis buffer.
on May 15, 2020 by guest
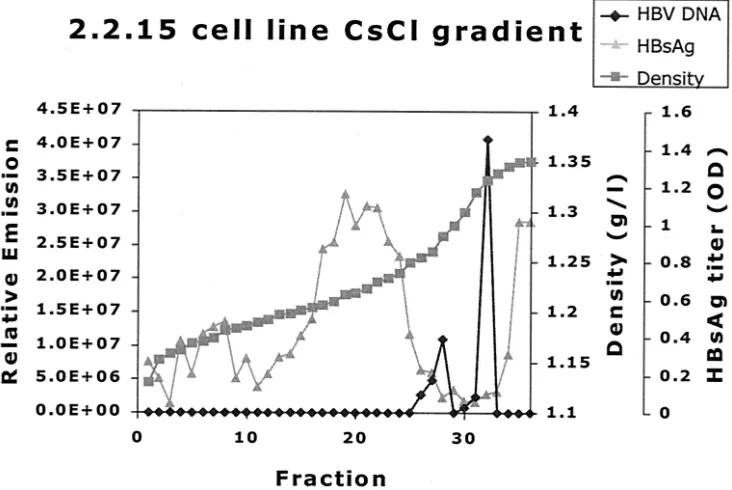
Analysis of HBV-positive cell line culture medium on CsCl density gradients.The culture medium of 2.2.15 was analyzed by CsCl density gradient analysis to investigate the distribution of HBV DNA as found by the real-time HBV DNA NASBA in different particles. The resulting gradient was fractionated into 38 different portions. Two HBV DNA peaks were found (Fig. 7). One HBV DNA peak was found at 1.28 g/ml, which cor-relates well with the density of Dane particles (11, 16, 32, 36). The other peak was found at a higher density (1.33 g/ml) and probably correlates with the noninfectious nude, DNA-con-taining core particles known to abound in cell line culture medium (33, 38).
Taken together, these data show that the HBV DNA real-time NASBA is capable of detecting the HBV DNA present in the various DNA-containing HBV particle types.
DISCUSSION
This paper presents an HBV DNA detection and quantifi-cation system that utilizes nucleic acid amplifiquantifi-cation with NASBA technology and detection in real time with molecular beacon probes. As previously described for the amplification of single-stranded RNA, the NASBA technology is based on the concurrent activity of AMV RT, RNase H, and T7 RNA poly-FIG. 3—Continued.
on May 15, 2020 by guest
http://jcm.asm.org/
[image:6.587.131.452.72.576.2]merase, together with two primers to produce amplification (7). The process occurs at one temperature (41°C) without the need of adding intermediate reagents and results in the expo-nential accumulation of single-stranded RNA products.
Recently the isothermal amplification of double-stranded DNA by NASBA has also been described (B. van Gemen, A. F. Schukkink, and D. A. M. W. van Strijp, 11 November 1998, PCT World Intellectual Property Organization, patent
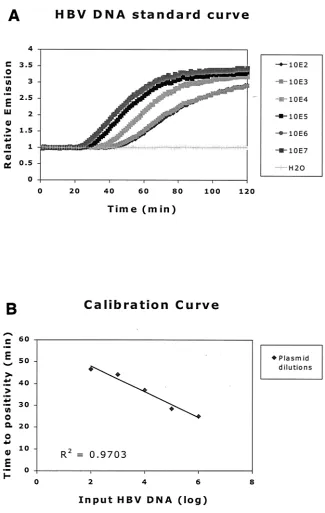
appli-cation WO 99/25868), but the mechanism is only partially elu-cidated. For some target sequences, the efficiency of the dou-ble-stranded DNA amplification by NASBA can be enhanced by a single denaturation step that makes single-stranded DNA before the amplification process starts. However, it is unclear how this newly synthesized DNA strand denatures from the template strand to allow extension of the second primer P2 to render a double-stranded T7 RNA polymerase promoter se-FIG. 4. (A) DNA standard curve generated from HBV DNA plasmid 10-fold dilution series. Curves are normalized for background (H2O). The
inverse relationship between TTP and copy number is clearly demonstrated. (B) A calibration curve, generated from the standard curves in panel A. The known copy numbers are plotted against the measured TTP. Using this calibration curve, the load in a given sample can be extrapolated from the linear TTP curve of the standards used in that experiment.
on May 15, 2020 by guest
[image:7.587.130.455.66.579.2]quence, which is part of primer P1. From that point on, the reaction continues with synthesis of the RNA used for entry of the amplification phase of the NASBA process.
The RNA amplicons generated in the NASBA process are detected by sequence-specific 6-FAM-labeled molecular bea-con probes (23). Molecular beabea-con probes are used in the NASBA reactions to generate a fluorescent signal for direct amplicon detection during the amplification process. Due to the continuous measurement of fluorescence in the HBV DNA real-time NASBA, the time-point at which a reaction reaches the threshold of detection and thus becomes positive, is easily determined. There is an inverse correlation between the time needed for a reaction to become positive, the so-called TTP, and the initial copy number of HBV DNA used as input in the reaction. The higher the HBV input, the less time that the reaction needs to amplify to a detectable level.
The advantages of the HBV DNA real-time NASBA de-scribed in this work include its one-tube, isothermal nature, which allows high-throughput applications for nucleic acid
de-tection and quantification as well as real-time dede-tection. These features also virtually eliminate the risk for contamination of other reactions, a fact that has hampered widespread use of amplification technologies so far. In a 96-well format run (80 specimens plus standards), the complete assay including ex-traction of HBV DNA from plasma or serum samples can be completed in 5 h (or 3 h without extractions). The assay can be incorporated into the normal work routine of clinical labora-tories and fully automated.
Results obtained by serial dilution of the HBV DNA stan-dard indicated that our assay has a broad dynamic range from 101 to 107HBV DNA copies/reaction mixture (6 logs), with
good reproducibility and precision. This is the equivalent of 103 to 109 HBV RNA copies/ml of serum or plasma, as
ex-plained in Materials and Methods. When HBV DNA was extracted from the serum or plasma samples by an appropriate method, such as the guanidine method with addition of ␣-ca-sein, the assay was more sensitive than when standard guani-dine-based extraction procedures were used.
Several groups have reported the development of assays for the detection of HBV DNA with or without DNA amplifica-tion (1, 8, 17, 21, 26, 34, 37). The assays without amplificaamplifica-tion had lower detection sensitivities (from about 106to 109copies/
[image:8.587.44.285.71.300.2]ml) and high quantitative accuracy, whereas the assays with amplification had higher sensitivities but lower quantitative FIG. 5. Precision of HBV DNA real-time NASBA assay at input
[image:8.587.301.541.102.149.2]levels in the range from 10 to 10,000,000 copies/reaction mixture. Samples were analyzed in numbers of replicates according to Table 2. Mean values and standard deviations are shown together with the line of equality.
FIG. 6. Mean response curve of 29 standard assays following linear regression analysis, with assay variability modeled as a random-effects term. The correlation between intercept and slope is⫺1, so if the intercept of a standard response curve is larger than average, its slope will tend to be smaller.
TABLE 2. Precision of HBV DNA real-time NASBA assaysa Input level of
HBV DNA Calculated HBVDNA load Range SD CV (%)
1 (n⫽4) 1.245 1.049–1.339 0.133 10.7 2 (n⫽13) 1.966 1.697–2.296 0.201 10.2 3 (n⫽16) 2.940 2.428–3.392 0.228 7.76 4 (n⫽24) 4.056 3.286–4.997 0.384 9.46 5 (n⫽25) 5.215 3.820–5.953 0.476 9.13 6 (n⫽30) 6.105 5.217–7.168 0.347 5.68 7 (n⫽14) 6.717 5.748–7.296 0.463 6.90
aAll values are log
[image:8.587.308.536.523.679.2]10-transformed copies per reaction, except forn, the num-ber of replicates used for the analysis, and the interassay CV.
TABLE 3. Linearity and reproducibility of HBV DNA real-time NASBA assays as confirmed by linear regression and Bland-Altman
comparisons of 29 standard response curvesa
Analysis (95% CFI)Intercept (95% CFI)Slope Regressionline
Linear 0.085 (⫺0.104–0.275) 0.992 (0.947–1.036) y⫽x Bland-Altman ⫺0.015 (⫺0.205–0.175) 0.012 (⫺0.032–0.057) y⫽0
aBland-Altman analysis performs a regression of log
10(real-time NASBA/ input) onto 0.5⫻log10(real-time NASBA⫻input). The standard deviation of the intercept due to random assay variability is 0.127 (95% CFI, 0.058 to 0.276), and the standard deviation of the slope due to random assay variability is 0.037 (95% CFI, 0.023 to 0.061). Estimates are according to the SPLUS 2000 Linear Mixed Effects Models.
on May 15, 2020 by guest
http://jcm.asm.org/
[image:8.587.42.282.618.711.2]accuracy. Whether or not amplification was used, all assays had detection ranges of about 3 logs. As shown from the clinical performance of our assay, HBV DNA amounts in patients with various disease conditions were widely distributed over more than 5 logs.
Clinical studies have suggested that HBV DNA amounts differ markedly in hepatitis B patients and carriers and that the detection range of some assays was too narrow to monitor the amount of HBV DNA (18, 19).
The results reported here and elsewhere indicate that diag-nosis and monitoring of HBV infection require a test with not only adequate sensitivity but also a very wide detection range. The real-time quantitative test for the detection of HBV that we have developed is easy to perform and saves time, due to a reduction of handling steps. The risk of carryover contamina-tion is minimized by performing the entire method in un-opened microtubes. Furthermore, the test has adequate sensi-tivity, reproducibility, and precision and a broad dynamic range for monitoring the condition and prognosis of HBV carriers and patients, including those undergoing interferon or nucle-oside analog therapy.
ACKNOWLEDGMENTS
This work was funded by Amsterdam Support Diagnostics. We thank Margreet Bakker, Joke Brouwer, and Esther de Rooij of the Department of Human Retrovirology, Amsterdam, The Nether-lands, for sample handling and database administration; Nico Snijders of the Central Laboratory for Blood Transfusion, Amsterdam, The Netherlands, for providing HBV-positive plasma; Hans Bogaards from the National AIDS Therapy Evaluation Center (NATEC), Academic
Medical Center, Amsterdam, The Netherlands, for statistical analyses; and Lucy Philips for editorial review of the manuscript.
REFERENCES
1.Abe, A., K. Inoue, T. Tanaka, J. Kato, N. Kajiyama, R. Kawaguchi, S. Tanaka, M. Yoshiba, and M. Kohara.1999. Quantitation of hepatitis B virus genomic DNA by real-time detection PCR. J. Clin. Microbiol.37:2899–2903. 2.Boom, R., C. Sol, M. Beld, J. Weel, J. Goudsmit, and P. Wertheim-van Dillen.1999. Improved silica-guanidiniumthiocyanate DNA isolation proce-dure based on selective binding of bovine alpha-casein to silica particles. J. Clin. Microbiol.37:615–619.
3.Boom, R., C. J. Sol, R. P. M. Heijtink, Wertheim-van Dillen, and J. van der Noordaa.1991. Rapid purification of hepatitis B virus DNA from serum. J. Clin. Microbiol.29:1804–1811.
4.Boom, R., C. J. Sol, M. M. Salimans, C. L. Jansen, P. M. E. Wertheim-van Dillen, and J. van der Noordaa.1990. Rapid and simple method for purifi-cation of nucleic acids. J. Clin. Microbiol.28:495–503.
5.Brechot, C., M. Hadchouel, J. Scotto, F. Degos, P. Charnay, C. Trepo, and P. Tiollais.1981. Detection of hepatitis B virus DNA in liver and serum: a direct appraisal of the chronic carrier state. Lancetii:765–768.
6.Chen, C. H., J. T. Wang, C. Z. Lee, J. C. Sheu, T. H. Wang, and D. S. Chen.
1995. Quantitative detection of hepatitis B virus DNA in human sera by branched-DNA signal amplification. J. Virol. Methods53:131–137. 7.Compton, J.1991. Nucleic acid sequence-based amplification. Nature350:
91–92.
8.Fagan, E. A., P. Guarner, S. D. Perera, R. Trowbridge, N. Rolando, F. Davison, and R. Williams.1985. Quantitation of hepatitis B virus DNA (HBV DNA) in serum using the spot hybridization technique and scintilla-tion counting. J. Virol. Methods12:251–262.
9.Feinman, S. V., B. Berris, A. Guha, R. Sooknanan, D. W. Bradley, W. W. Bond, and J. E. Maynard.1984. DNA: DNA hybridization method for the diagnosis of hepatitis B infection. J. Virol. Methods8:199–206.
10.Ganem, D.1996. Hepadnaviridae and their replication, p. 2703–2737.In
B. N. Fields, D. M. Knipe, and P. M. Howley (ed.), Fields virology, 3rd ed., vol. 3. Lippincott-Raven Publishers, Philadelphia, Pa.
11.Gerin, J. L., E. C. Ford, and R. H. Purcell.1975. Biochemical characteriza-tion of Australia antigen. Evidence for defective particles of hepatitis B virus. Am. J. Pathol.81:651–668.
[image:9.587.110.476.75.320.2]12.Gerken, G., J. Gomes, P. Lampertico, M. Colombo, T. Rothaar, M. Trippler, FIG. 7. CsCl gradient analysis of HBV-positive cell line culture medium. One milliliter of purified HBV-positive cell line (2.2.15) medium was centrifuged across a CsCl gradient(see Materials and Methods). The resulting gradient was fractionated, and density, HBsAg titer, and HBV DNA level were determined. HBV DNA density was determined by refractometry. The HBsAg titer was determined for a 1:40-diluted sample. Two HBV DNA peaks are found, one at the density expected to contain the HBV Dane particle population (1.28 g/ml) and one at 1.33 g/ml, where nude core particles representing the majority of HBV DNA-containing particles are expected (33). The peak of HBsAg at lower densities (around 1.20 g/ml) represents empty HBV envelope particles, which are plentiful in both cell line material and cell line medium. The HBV DNA detected by the real-time HBV DNA NASBA was found only in association with a particle.
on May 15, 2020 by guest
and G. Colucci.1998. Clinical evaluation and applications of the Amplicor HBV Monitor test, a quantitative HBV DNA PCR assay. J. Virol. Methods
74:155–165.
13.Habersetzer, F., F. Zoulim, J. F. Jusot, X. Zhang, M. A. Trabaud, P. Chev-allier, M. ChevChev-allier, S. N. Ahmed, M. Sepetjan, L. Comanor, J. Minor, and C. Trepo.1998. Clinical evaluation of the branched DNA assay for hepatitis B virus DNA detection in patients with chronic hepatitis B lacking hepatitis B e antigen and treated with interferon-alpha. J. Viral Hepat.5:407–414. 14.Hadziyannis, S. J., H. M. Lieberman, G. G. Karvountzis, and D. A. Shafritz.
1983. Analysis of liver disease, nuclear HBcAg, viral replication, and hepa-titis B virus DNA in liver and serum of HBeAg vs. anti-HBe positive carriers of hepatitis B virus. Hepatology3:656–662.
15.Hollinger, F. B.1996. Hepatitis B virus, p. 2739–2807.InB. N. Fields, D. M. Knipe, and P. M. Howley (ed.), Fields virology, 3rd ed., vol. 3. Lippincott-Raven Publishers, Philadelphia, Pa.
16.Hruska, J. F., and W. S. Robinson.1977. The proteins of hepatitis B Dane particle cores. J. Med. Virol.1:119–131.
17.Jalava, T., M. Ranki, M. Bengtstrom, P. Pohjanpelto, and A. Kallio.1992. A rapid and quantitative solution hybridization method for detection of HBV DNA in serum. J. Virol. Methods36:171–180.
18.Jardi, R., M. Buti, F. Rodriguez-Frias, M. Cortina, R. Esteban, J. Guardia, and C. Pascual.1996. The value of quantitative detection of HBV-DNA amplified by PCR in the study of hepatitis B infection. J. Hepatol.24:680– 685.
19.Khakoo, S. I., P. N. Soni, D. Brown, and G. M. Dusheiko.1996. A clinical evaluation of a new method for HBV DNA quantitation in patients with chronic hepatitis B. J. Med. Virol.50:112–116.
20.Kinoshita, R., K. Miura, H. Uchino, A. Konishi, T. Nakagawa, and Y. Imai.
1981. Chronic hepatitis B: correlation between viral replication and clinical course. J. Infect. Dis.144:303–306.
21.Lai, M. M.1995. Molecular biologic and pathogenetic analysis of hepatitis delta virus. J. Hepatol.22:127–131.
22.Lehtovaara, P., M. Uusi-Oukari, P. Buchert, M. Laaksonen, M. Bengtstrom, and M. Ranki.1993. Quantitative PCR for hepatitis B virus with colorimetric detection. PCR Methods Appl.3:169–175.
23.Leone, G., H. van Schijndel, B. van Gemen, F. R. Kramer, and C. D. Schoen.
1998. Molecular beacon probes combined with amplification by NASBA enable homogeneous, real-time detection of RNA. Nucleic Acids Res26:
2150–2155.
24.Lieberman, H. M., D. R. LaBrecque, M. C. Kew, S. J. Hadziyannis, and D. A. Shafritz.1983. Detection of hepatitis B virus DNA directly in human serum by a simplified molecular hybridization test: comparison to HBeAg/anti-HBe status in HBsAg carriers. Hepatology3:285–291.
25.Mahoney, F. J.1999. Update on diagnosis, management, and prevention of hepatitis B virus infection. Clin. Microbiol. Rev.12:351–366.
26.Morace, G., K. von der Helm, W. Jilg, and F. Deinhardt.1985. Detection of hepatitis B virus DNA in serum by a rapid filtration-hybridization assay. J. Virol. Methods12:235–242.
27.Nassal, M., and H. Schaller.1993. Hepatitis B virus replication. Trends Microbiol.1:221–228.
28.Nassal, M., and H. Schaller.1996. Hepatitis B virus replication—an update. J. Viral Hepat.3:217–226.
29.Pontisso, P., F. Bortolotti, G. Fattovich, M. G. Ruvoletto, G. Realdi, and A. Alberti.1989. Hepatitis B virus DNA forms in the liver of chronically in-fected individuals. Relation to replication profile. J. Hepatol.9:29–35. 30.Pontisso, P., D. Stenico, G. Diodati, G. Marin, M. V. Caldironi, R.
Giac-chino, G. Realdi, and A. Alberti.1987. HBV-DNA sequences are rarely detected in the liver of patients with HBsAg-negative chronic active liver disease and with hepatocellular carcinoma in Italy. Liver7:211–215. 31.Romano, J. W., K. G. Williams, R. N. Shurtliff, C. Ginocchio, and M.
Kaplan.1997. NASBA technology: isothermal RNA amplification in quali-tative and quantiquali-tative diagnostics. Immunol. Investig.26:15–28. 32.Sakamoto, Y., G. Yamada, M. Mizuno, T. Nishihara, S. Kinoyama, T.
Koba-yashi, T. Takahashi, and H. Nagashima.1983. Full and empty particles of hepatitis B virus in hepatocytes from patients with HBsAg-positive chronic active hepatitis. Lab. Investig.48:678–682.
33.Sells, M. A., M. L. Chen, and G. Acs.1987. Production of hepatitis B virus particles in Hep G2 cells transfected with cloned hepatitis B virus DNA. Proc. Natl. Acad. Sci. USA84:1005–1009.
34.Sumazaki, R., M. Motz, H. Wolf, J. Heinig, W. Jilg, and F. Deinhardt.1989. Detection of hepatitis B virus in serum using amplification of viral DNA by means of the polymerase chain reaction. J. Med. Virol.27:304–308. 35.Summers, J., and W. S. Mason.1982. Replication of the genome of a
hepatitis B-like virus by reverse transcription of an RNA intermediate. Cell
29:403–415.
36.Sureau, C., J. L. Romet-Lemonne, J. I. Mullins, and M. Essex.1986. Pro-duction of hepatitis B virus by a differentiated human hepatoma cell line after transfection with cloned circular HBV DNA. Cell47:37–47. 37.Trippler, M., H. Hampl, B. Goergen, U. Spies, P. Knolle, B. Grimm, K. H.
Meyer zum Buschenfelde, and G. Gerken.1996. Ligase chain reaction (LCR) assay for semi-quantitative detection of HBV DNA in mononuclear leuko-cytes of patients with chronic hepatitis B. J. Viral Hepat.3:267–272. 38.Yaginuma, K., Y. Shirakata, M. Kobayashi, and K. Koike.1987. Hepatitis B
virus (HBV) particles are produced in a cell culture system by transient expression of transfected HBV DNA. Proc. Natl. Acad. Sci. USA84:2678– 2682.