1
Exploring Impacts of Process Technology Development and Regional Factors
on Life Cycle Greenhouse Gas Emissions of Corn Stover Ethanol
Jon McKechnie
1,*, Mohammad Pourbafrani
2, Bradley A. Saville
2and Heather L.
MacLean
2,31
Division of Energy and Sustainability, University of Nottingham, University Park,
Nottingham NG7 2RD, UK
2
Department of Chemical Engineering and Applied Chemistry, University of
Toronto, 200 College Street, Toronto, ON, M5S 3E5, Canada
3
Department of Civil Engineering, University of Toronto, 35 St George Street,
Toronto, ON, M5S 1A4, Canada
*Corresponding Author: Jon McKechnie
Email:
[email protected]
Tel: +44 (0) 115 74 84435
2
Abstract
This paper examines impacts of regional factors affecting biomass and process input supply chains and ongoing technology development on the life cycle greenhouse gas (GHG) emissions of ethanol production from corn stover in the U.S. Corn stover supply results in GHG emissions from -6
gCO2eq./MJ ethanol (Macon County, Missouri) to 13 gCO2eq./MJ ethanol (Hardin County, Iowa),
reflecting location-specific soil carbon and N2O emissions responses to stover removal. Biorefinery
emissions based on the 2011 National Renewable Energy Laboratory (NREL) process model are the
single greatest emissions source (18 gCO2eq./MJ ethanol) and are approximately double those
assessed for the 2002 NREL design model, due primarily to the inclusion of GHG-intensive inputs (caustic, ammonia, glucose). Energy demands of on-site enzyme production included in the 2011 design contribute to reducing the electricity co-product and associated emissions credit, which is also dependent on the GHG-intensity of regional electricity supply. Life cycle emissions vary between 1.5
and 22 gCO2eq./MJ ethanol (2011 design) depending on production location (98% to 77%
reduction vs. gasoline). Using system expansion for co-product allocation, ethanol production in studied locations meet the Energy Independence and Security Act emissions requirements for cellulosic biofuels; however, regional factors and on-going technology developments significantly influence these results.
Keywords: Life Cycle Assessment, Corn Stover, Ethanol
Highlights:
We evaluate the impacts of regional parameters and technology development on the life
cycle greenhouse gas emissions of corn stover-derived ethanol
The impacts of corn stover removal on soil carbon stocks and N2O emissions are the
dominant regionally-dependent parameters
Biorefinery emissions based on the 2011 NREL design model are approximately double that
of the preceding 2002 NREL model due to inclusion of greenhouse gas-intensive inputs (caustic, ammonia, glucose)
For all regions and process design models considered, corn-stover derived ethanol would3
1.
Introduction
Sustainability-related concerns surrounding fossil fuel use, and improvements in biomass conversion technologies have increased interest in producing fuels from lignocellulosic feedstock. Considerable focus has been placed on the development of second generation biofuels from non-food biomass (e.g., Luo et al., 2009; Cherubini et al., 2010; Liao et al., 2011). With improvements in biomass pre-treatment, reductions in enzyme loading and prices, and the production of valuable co-products such as pellets and electricity, the financial metrics of lignocellulosic biofuel production have improved (Humbird et al., 2011). Lignocellulosic biomass feedstock options include energy crops, forest and agricultural residues, and the organic fraction of municipal solid waste. These feedstocks do not directly compete with agricultural crops, and in the case of crop residues, are produced from biomass already grown on the same parcel of land.
Corn stover, an agricultural residue, is gaining interest as a feedstock because it is an abundant and inevitable co-product of corn grain production (Bhardwaj et al., 2011). Corn stover and grain are produced in approximately equal amounts. Graham et al. (2007) and Nelson et al. (2002) discuss that corn stover could be used for ethanol production in the U.S., provided it is removed from the field in a sustainable manner, e.g., with minimal soil erosion and preservation of soil carbon. In the U.S. most of the corn stover is left in the fields; Kim et al. (2009) reported that only 5% of the total corn stover is removed, and that it is used as animal feed and bedding. The amount of stover which could be removed without soil organic carbon loss is dependent upon geography and local/regional soil conditions (Luo et al., 2009). Kim et al. (2009) suggest that the stover removal rate ranges from 25% to 50% in the U.S.
4
relevant in jurisdictions that use GHG metrics to accompany biofuel mandates, such as the Low Carbon Fuel Standard in California (California Air Resources Board, 2009), and the GHG reductions stipulated under the US Energy Independence and Security Act (EISA, 2007).
There are a number of LCAs of the corn stover to ethanol process (e.g., Sheehan et al., 2004, Luo et al., 2009, Hsu et al., 2010, Spatari and MacLean, 2010, Kaufman et al., 2010). These studies all reported that replacing gasoline with ethanol produced from corn stover would reduce GHG emissions; however, the percentage reductions (compared to gasoline) reported in the studies vary between 58% and 106%. Key factors impacting the study results include: agricultural activities associated with corn stover production; the design of the conversion process, which impacts electricity and thermal energy demands; the source of electricity; and assumptions regarding enzyme and process chemical inputs to the conversion process. According to EISA 2007, to meet the requirements for categorization as a cellulosic biofuel, ethanol should reduce GHG emissions by 60% compared to gasoline. Spatari and MacLean (2010) studied both National Renewable Energy Laboratory (NREL) (Aden et al, 2002) and Michigan State University conversion process design models, but most other studies relied only on technical process information for conversion of stover to ethanol reported by NREL (Aden et al, 2002). Hsu et al.(2010), Spatari and MacLean (2010) and Kaufman et al. (2010) used US-average data for corn yield, fertilizer application rate and electricity
grid intensity. Sheehan et al. (2004) determined the aforelisted data based on a specific location in
Iowa. These studies did not include the impact of geographical variation on their LCA results, and did not distinguish between different stover harvesting requirements and biorefinery locations. Furthermore, there have been significant changes in the NREL conversion process design since 2002, including a major update published in 2011 (Humbird et al., 2011). Changes in the NREL design model include a process for enzyme production, the introduction of new chemicals (ammonia and caustic) to the process, and significant changes in ethanol yield and electricity generation capacity.
5
process designs, and compare our life cycle results with those of Hsu et al. (2010), a study based on NREL’s 2002 design. To our knowledge this is the first life cycle study comparing the 2002 and 2011 NREL designs. The impacts on life cycle GHG emissions of site-dependent variations in agricultural practices and outcomes, regional variations in the electricity grid and different emissions allocation methods are examined. Resulting life cycle GHG emissions are compared with EISA’s thresholds to assess the implications of ethanol conversion technology development and regional parameters on GHG emissions of corn stover ethanol.
2.
Methodology
2.1. Life cycle assessment
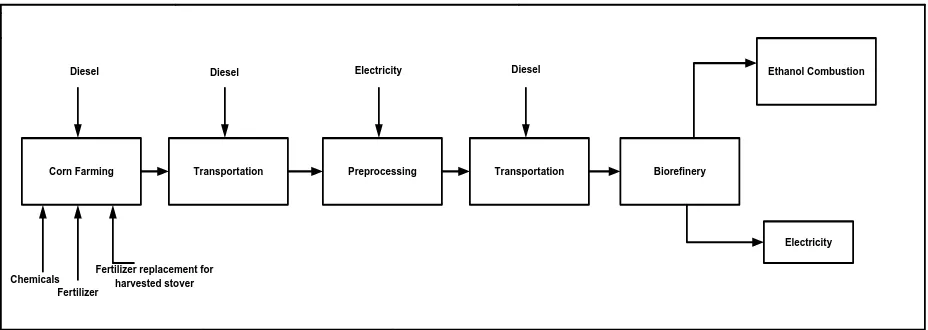
Life cycle inventory analysis models are developed to quantify GHG emissions associated with ethanol production from corn stover. The life cycle system boundary includes activities associated with the corn stover-ethanol production process from field to ethanol use in a light duty vehicle as a blended fuel with gasoline. These include corn farming and stover harvesting, pre-processing of stover, transportation of stover and ethanol production in a biorefinery (Figure 1), transportation of ethanol and final combustion of ethanol. The functional unit is 1MJ of ethanol (E100) produced.
Spreadsheet-based models are developed to quantify life cycle emissions of selected GHGs (CO2,
CH4, and N2O) which are reported as carbon dioxide equivalents (CO2eq.) based on 100-year global
warming potentials (IPCC, 2006).
2.2 Corn stover production
6
in square and round bales. The dry matter content of stover and ratio of stover to grain are 79% and 1:1, respectively (Kim and Dale, 2004).
2.3 Allocation of GHG emissions to stover production
Corn stover is a co-product of corn grain production; therefore, it is necessary to allocate emissions between these two products. There are different co-product treatment approaches utilized in LCA, including allocation and system expansion (ISO 14044, 2006). Two approaches, system expansion and mass allocation, are used in this study to distribute emissions from corn production and harvesting to stover and grain.
System expansion is the most common approach used in previous studies (e.g., Sheehan et al. 2004; Kim et al. 2009; Spatari and MacLean 2010; Hsu et al 2010). In the system expansion approach, only emissions related to the additional activities required to harvest stover are assigned to the stover. The environmental effects of harvesting stover include changes in nitrogen related emissions and soil organic carbon levels, phosphorous loss, additional nutrient requirements in the subsequent growing season, and fuel consumption for stover harvesting. For this approach, the GHG emissions assigned to stover presented in Kim et al. (2009), who used the DAYCENT model and system expansion to calculate the GHG emissions assigned to stover for the eight counties considered in this study, are utilized directly.
7
2.4. Pre-processing
There is a pre-processing facility for corn stover handling and processing prior to its arrival at the biorefinery (Humbird et al. 2011). This pre-processing concept is based on the pioneering implementation of the ‘Uniform-Format’ solid feedstock supply system described by Idaho National Laboratory (INL) (Hess et al., 2009) and used by NREL (Humbird et al., 2011) in their process design for biochemical conversion of lignocellulosic biomass to ethanol. This is an interim stage supply system design, where square and round bale technologies and co-handling technologies are used to model supply chain logistics. The pre-processing has two stages: (1) decomposition, which includes receiving operations such as weighing the biomass material, removal of covering and conveying to grinding stages, and (2) grinding, which includes a hammer mill and dust management equipment as well as associated conveyors. The electricity consumption of these two stages was reported in Hess et al. (2009).
2.5 Biorefinery
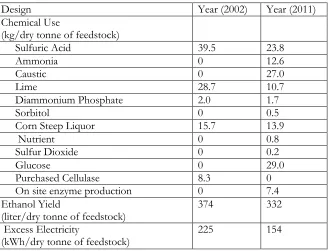
The corn stover-ethanol production process is modeled based on the process presented in the 2011 NREL report (Humbird et al., 2011). This biorefinery produces 230 million litres ethanol per year. Table 4 compares the ethanol yield, electricity production (surplus) and chemical consumption reported in Humbird et al. (2011) with those reported in the 2002 NREL process design (Aden et al., 2002). The main differences in the process designs include: lower ethanol yield and electricity credit in the 2011 design; introduction of new chemicals (ammonia, caustic and glucose) in the 2011 design; and onsite enzyme production in the 2011 design versus offsite enzyme production in the 2002 design. These factors are all expected to impact life cycle GHG emissions.
8
glucose, which is used to induce cellulase production. Then, a larger scale fermentor is used to produce cellulase. The whole cell broth, rich in cellulase, is then fed to the cellulosic ethanol process.
The pre-processed corn stover is fed to the biorefinery. The biomass is then sent to a pre-treatment reactor, which operates at high temperature for a few minutes. Dilute sulfuric acid is introduced in the pre-treatment and conditioning as a catalyst to release hemicellulosic sugars and to break down biomass for enzymatic hydrolysis. Prior to enzymatic hydrolysis, slurry is created from effluent biomass from the pre-treatment, which is then neutralized with ammonia to achieve a pH of ~5 - 6. Cellulase is added to a high-solids continuous enzymatic hydrolysis reactor, creating a partially hydrolyzed slurry. The slurry is then processed in parallel batch reactors to accomplish complete hydrolysis. The slurry is cooled and inoculated with a co-fermenting microorganism, which converts the glucose and xylose into ethanol after about five days of sequential fermentation and hydrolysis.
The ethanol, water and residual solids are separated by distillation followed by centrifugation of the distillation bottoms to “de-water” solids. The ethanol is further distilled and purified to 99.5%. The distillation bottoms (primarily lignin solids) are sent to a boiler, while the liquid is treated in a wastewater treatment plant. The combustor is supplemented with biogas generated by the wastewater treatment plant. Sludge from the digesters is burned and the treated water is recycled and used in the process. Plant wastewater streams are treated with both anaerobic and aerobic digestion. Methane-rich biogas from anaerobic digestion is sent to the same combustor where sludge from the digesters is also burned. Treated water is suitable for recycling and is returned to the process. Electricity and heat are cogenerated from the combustion of distillation solids and biogas. A portion of generated electricity and all of the produced heat are used to meet requirements of the biorefinery processes. It is assumed that the excess electricity generated in the biorefinery displaces grid-average electricity from the state grid in which the county is located. The sources of electricity generation in each state are presented in Table 3.
2.6. Allocation of GHG emissions to ethanol as the primary product of the biorefinery
9
include emissions associated with the feedstock (corn stover) production, stover pre-processing and transport, biorefinery emissions, distribution and use of ethanol, and emissions credits due to the electricity co-product. This approach is consistent with that employed to assess fuels under the EISA (2007).
3. Results and Discussion
3.1. Life cycle GHG emissions for E100 produced from corn stover
Life cycle GHG emissions, those associated with the activities from stover production through ethanol (E100) combustion are discussed in this section for each of the eight counties/locations considered. Emissions results are presented based on the system expansion method for the corn stover production (Fig. 2). Results based on the mass allocation method are presented in Section 3.2.
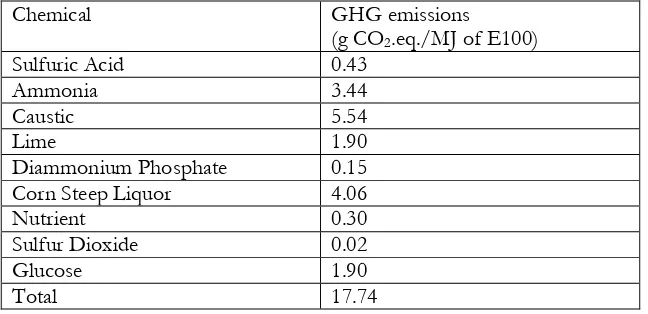
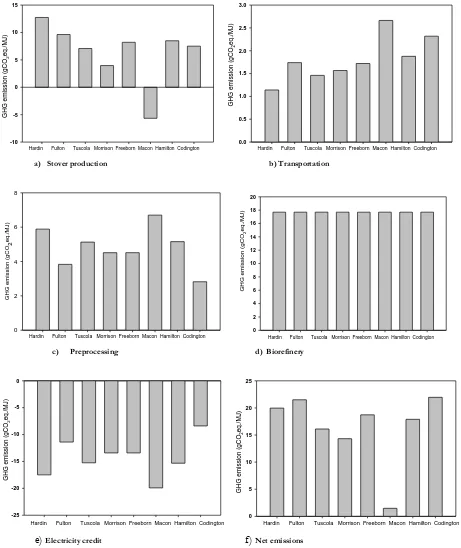
As presented in Figure 2, biorefinery-related GHG emissions are the highest contributor to life cycle
emissions, with 17.7 g CO2 eq./MJ of E100 produced. The emissions associated with the biorefinery
are the same for each of the eight counties/locations because the NREL biorefinery model includes conversion of residues to supply all of the biorefinery’s thermal and electrical energy needs. The GHG emissions for chemicals used in the process are assumed independent of location and are therefore the same for all biorefinery locations. The contribution of the chemicals to GHG emissions of the biorefinery is presented in Table 5. Caustic, ammonia and corn steep liquor are the largest sources of GHG emissions in the biorefinery. The sum of these three chemicals accounts for 74% of biorefinery-related GHG emissions. As mentioned earlier, caustic, ammonia and glucose were introduced in NREL’s 2011 process, whereas these three chemicals were not used in their 2002 design.
The GHG emissions associated with stover harvesting and pre-processing can be significant contributors to the life cycle emissions of E100 (Fig. 2). These two emission sources are dependent on location. The GHG emissions associated with stover harvesting range from 12.7 (Hardin County,
Iowa) to -5.7 (Macon County, Missouri) g CO2 eq./MJ of E100. At all studied locations, stover
removal reduces soil carbon sequestration (relative to not collecting stover) but also has a
10
negative GHG emissions as the associated reduction in N2O emissions exceeds emissions related to
reduced soil carbon stocks; this results from a lower allowable stover removal rate in that county (Table 2)(Kim et al., 2009). Figure 3 presents GHG emissions of stover harvesting per kg of stover.
The GHG emissions of stover harvesting range from 90 (Hardin) to -40 (Macon) g CO2 eq./kg of
stover. By comparison, GREET 2012 (Argonne National Laboratory, 2013) also uses a system
expansion approach, but uses U.S. average data, and reports GHG emissions of 90 g CO2eq/kg of
stover.
Emissions associated with corn stover pre-processing and the electricity co-product credit are dependent on the local grid mix. Electricity is the major form of energy used in pre-processing and it
is provided by the local grid. The GHG emissions from pre-processing range from 2.8 g CO2eq/MJ
of E100 in Codington County, SD, where hydro is the major generation source, to 5.8 g CO2eq/MJ
of E100 in Macon County, MO, where coal is the main generation source (Table 3). Lignin-derived electricity exported to the grid by the biorefinery creates a GHG credit for ethanol. The electricity credit is higher for counties in states that use coal as a major source for electricity generation. Therefore, the biorefinery in Macon County is assigned the largest credit for lignin-derived electricity
(19.9 g CO2eq/MJ of E100), while the biorefinery in Codington County is assigned the lowest credit
(8.4 g CO2eq/MJ of E100) (Fig. 2). Greater emissions associated with pre-processing and greater
credits for the electricity co-product are observed in states/counties with more GHG intensive grids. Since the co-product electricity output is greater than electricity consumption during pre-processing, biorefineries located in states with more GHG intensive electricity grids have lower net GHG emissions, once these two stages (pre-processing and electricity co-product) are considered. For example, the sum of the pre-processing emissions and the electricity credit for Codington
County is 5.6 g CO2eq/MJ of E100, compared to -14.1 g CO2eq/MJ of E100 in Macon County.
Transportation-related emissions (transportation of stover to the biorefinery and transportation of ethanol to point of use) are the smallest contributor to life cycle GHG emissions (1.1 to 2.7 g
CO2eq/MJ of E100) (Fig. 2).
The net life cycle GHG emissions of E100 range from 1.5 (Macon County) to 22 (Codington
11
respectively. While the lowest GHG emissions for E100 production are achieved in Macon County, the ability to site a plant that could achieve these emissions might be hindered by the low corn (and stover) yield in Macon County compared to other counties. Macon County has the lowest corn yield (4790 kg/ha) (Table 1), and stover removal rate (25%) (Table 2). The low corn yield and low stover removal rate would increase the ethanol production cost by limiting the scale of the biorefinery and/or increasing the cost for stover collection/transportation. Therefore, from a financial perspective, Macon County may not be as attractive as other counties for locating a biorefinery.
The net life cycle GHG emissions of E100 for the three counties with the highest corn yields – Hamilton (9740 kg/ha), Hardin (9203 kg/ha) and Freeborn (9069 kg/ha) - are 18, 20 and 19
gCO2eq/MJ of E100. Although Freeborn and Morrison Counties are located in same state (MN),
the life cycle GHG emissions of E100 produced in Morrison are 24% lower than those of E100 produced in Freeborn (Fig. 2). This is due primarily to greater soil carbon losses associated with stover removal in Freeborn County (Table 2), resulting in emissions for stover harvesting of 28
gCO2eq./kg and 58 gCO2eq./kg, respectively (Fig. 3).
3.1.1 Comparison of life cycle GHG results of NREL’s 2011 and 2002 process designs
12
A lower ethanol yield results in more residual biomass available for co-product electricity production, thereby providing a larger co-product GHG credit when displacing grid electricity. However, the electricity co-product credit is less in the 2011 NREL process design due to the additional electricity consumption associated with enzyme production.
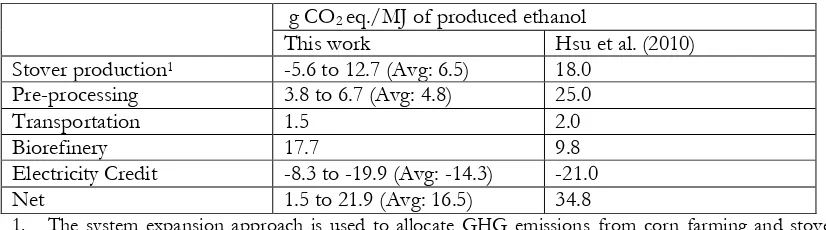
Differences in GHG emissions results between the current study and Hsu et al. (2010) also arise due to use of different data and assumptions in the studies. The GHG emissions assigned to enzyme
production in the current study are 11.5 g CO2 eq./g of produced enzyme, based upon the onsite
enzyme production process proposed by NREL 2011 (Hong et al., 2013) whereas Hsu et al. (2010)
utilized 4.1 g CO2 eq./g of cellulase consumed in the process. Differences also arise due to the
current study’s use of the state grid mix to calculate the electricity credit, while Hsu et al. (2010) used the U.S. average grid mix. The state based grid mix allows evaluation of site-dependent factors that influence overall GHG emissions for a biorefinery.
3.2 Allocation of GHG emissions to corn stover
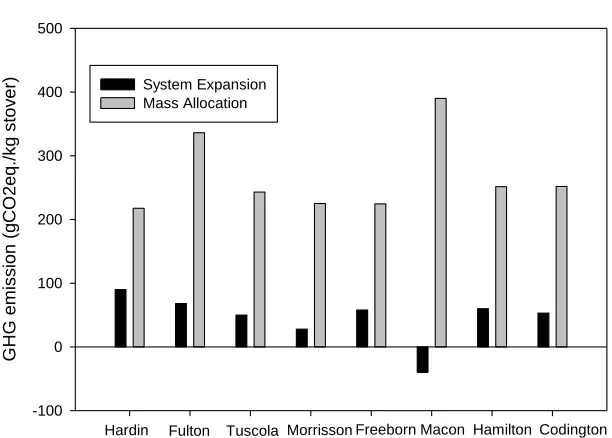
As described in Section 2, under system expansion, only the incremental GHG emissions associated with harvesting stover (fuel and nutrient replacement) are assigned to stover, while under mass allocation, GHG emissions from corn farming and stover harvesting are allocated to stover and corn grain based on their mass. Figure 3 presents the life cycle GHG emissions from stover production
(gCO2eq/kg of stover), considering mass allocation and system expansion. GHG emissions for
stover production under mass allocation range between 218 to 289 gCO2eq/kg of stover, while
under system expansion, they range from -40 to 90 g CO2eq/kg of stover (Fig. 3). In all cases, GHG
emissions from stover production under mass allocation are much higher than they are under system expansion.
The life cycle GHG emissions associated with E100, assuming mass allocation is used to calculate emissions from stover production, are presented in Figure 4. Stover production is the highest
contributor to life cycle emissions, contributing 31 to 41 gCO2eq/MJ of E100, while the net life
cycle GHG emissions range from 38 to 52 gCO2eq/MJ of E100.
13
To meet the EISA GHG emissions threshold for cellulosic biofuels, emissions for corn
stover-derived ethanol must be less than 38 gCO2eq./MJ (assuming gasoline emissions of 95 g CO2eq./MJ
(GREET 2012)). When system expansion is employed to calculate GHG emissions from corn stover production and harvesting, ethanol production in all eight counties considered in the current study can meet the GHG reduction required under EISA for a cellulosic biofuel. In contrast, if mass allocation is used to calculate emissions from corn stover production and harvesting, only a cellulosic ethanol plant in Hardin County would meet the legislated GHG emissions reduction.
Most life cycle studies and the ISO standard for LCA (ISO 14044, 2006) recommend system expansion. Therefore, in this work, more emphasis is placed upon the system expansion results than the mass allocation results. Promising GHG reductions for ethanol produced from corn stover are reported when a system expansion approach is used. The different outcomes observed with the 2002 and 2011 NREL models highlight that future developments in pre-processing and bioconversion technologies may alter the life cycle GHG emissions of ethanol produced from corn stover. Furthermore, regional differences in soil carbon, corn stover production and removal, and the carbon intensity of the local grid can lead to different GHG emissions.
4. Conclusions
14
The GHG emissions from stover production and harvesting are higher when a mass allocation approach is used to assign GHG emissions of corn farming and stover production to stover. However, the standard approach for allocation of emissions to co-products is system expansion; when a system expansion is considered for stover GHG emissions, the ethanol produced from stover will reduce GHG emissions by at least 60% in all counties, and thus meet the EISA requirement.
GHG emissions associated with biorefinery operations are higher for the 2011 NREL process design compared to the 2002 NREL design. This difference in GHG emissions is due to inclusion of GHG intensive materials (caustic, ammonia, glucose) and the lower ethanol yield. In addition, less co-product electricity is exported to the grid under the 2011 design due to increased biorefinery electricity demands resulting largely from on-site enzyme production. However, life cycle GHG emissions in the current study, based on the 2011 NREL process design, are lower than those reported by Hsu et al. (2010), due primarily to less energy-intensive biomass pre-processing.
This study has evaluated impacts of technology development and regional aspects on the life cycle GHG emissions of ethanol production from corn stover. While all ethanol production scenarios were found to exceed the EISA emission reduction threshold of 60% (relative to gasoline), results are found to vary significantly due to both design changes between 2002 and 2011 NREL process models and key region-specific parameters (stover collection emissions; GHG-intensity of grid electricity).
Acknowledgements
15
References
Aden A, Ruth M, Ibsen K, Jechura J, Neeves K, Sheehan J, Wallace B, Montague L, Slayton A, Lukas,J. 2002. Lignocellulosic biomass to ethanol process design and economics utilizing co-current dilute acid prehydrolysis and enzymatic hydrolysis for corn stover. NREL/TP-510-32438.
Adler PR, Grosso SJD and Parton WJ. 2007. Life-cycle assessment of net greenhouse-gas flux for bioenergy cropping systems. Ecol. Appl. 17: 675-691.
Argonne National Laboratory, Greenhouse Gases, Regulated Emissions, and Energy Use in Transportation (GREET). 2013. Computer Model, GREET 2012 rev1 model. Available at:http://www.transportation.anl.gov/modeling_simulation/GREET/index.html
Bhardwaj AK, Zenone T, Jasrotia P, Robertson GP, Chen J and Hamilton SK. 2011. Water and energy footprints of bioenergy crop production on marginal lands. GCB Bioenerg. 3: 208-222.
California Air Resources Board 2009.Proposed Regulation to Implement the Low Carbon Fuel Standard (Volume I). Sacramento, California.
Cherubini F, Ulgiati S. 2010. Crop residues as raw materials for biorefinery systems – A LCA case study. Applied Energy 87:47–57.
Energy Independence and Security Act of 2007. Public Law 110-140. Accessed 16/07/2013.
Available at: http://www.gpo.gov/fdsys/pkg/PLAW-110publ140/html/PLAW-110publ140.htm
Gonzalez-Garcia S, Moreira MT and Feijoo G. 2010. Comparative environmental performance of lignocellulosic ethanol from different feedstocks. Renew. Sustain. Energy Rev. 14: 2077-2085.
16
Hess JR, Kenney KL, Ovard LP, Searcy EM, Wright CT. 2009. Uniform-Format Solid Feedstock Supply System: A Commodity-Scale Design to Produce an Infrastructure-Compatible Bulk Solid from Lignocellulosic Biomass, Section 3: Pioneer Uniform Feedstock Supply System. Report No.
INL/EXT-08-14752. Idaho Falls, ID: Idaho National Laboratory.
http://www.inl.gov/bioenergy/uniform-feedstock.
Hong Y., Nizami A.S., Pourbafrani M., Saville B.A., MacLean H.L. 2013. Impact of cellulase
production on environmental and financial metrics for lignocellulosic ethanol.Bifuels Bioprod. Biorefin. 7, 3, 303-313.
Hsu DD, Inman D, Heath GA, Wolfrum E, Mann M and Aden A. 2010. Life cycle environmental impacts of selected U.S. ethanol production and use pathways in 2022. Environ. Sci. Technol. 13: 5289–5297.
Humbird D, Davis R, Tao L, Kinchin C, Hsu D, Aden A. 2011.Process Design and Economics for Biochemical Conversion of Lignocellulosic Biomass to Ethanol. NREL/TP-5100-47764
ISO 14044 (International Organisation for Standardisation) 2006.Environmental Management—Life Cycle Assessment—Requirement and Guidelines.
IPCC (Intergovernmental Panel on Climate Change) 2006 Guidelines for National Greenhouse Gas Inventories ed S Egglestton et al (Hayama: Institute for Global Environmental Strategies)
Kaufman SA, Meier JP, Sinistore CJ, Reinemann JD. 2010. Applying life-cycle assessment to low carbon fuel standards-How allocation choices influence carbon intensity for renewable transportation fuels Energ. Policy.38:5229-5241.
17
Kim S, Dale BE. 2005. Life cycle assessment of various cropping systems utilized for producing biofuels: bioethanol and biodiesel. Biomass Bioenerg. 29:426–439.
Kim S, Dale BE and Jenkins R. 2009. Life cycle assessment of corn grain and corn stover in the United States. Int. J. Life Cycle Assess. 14:160-174.
Liao W, Heijungs R, Huppes G. 2011. Is bioethanol a sustainable energy source? An energy-, exergy-, and emergy-based thermodynamic system analysis. Renew. Energ. 36:3479-3487.
Luo L, van der Voet E, Huppes G, Udo de Haes HA. 2009. Allocation issues in LCA methodology: a case study of corn stover-based fuel ethanol. Int. J. Life Cycle Assess. 14:529–539.
National Agricultural Statistics Service (NASS) 2007. U.S. Department of Agriculture. Available at http://www.nass.usda.gov.
Nelson RG. 2002. Resource assessment and removal analysis for corn stover and wheat straw in the Eastern and Midwestern United States—rainfall and wind erosion methodology. Biomass Bioenerg. 22:349–363.
Spatari S and MacLean HL. 2010. Characterizing Model Uncertainties in the Life Cycle of Lignocellulose-Based Ethanol Fuels. Environ. Sci. Technol. 44:8773–8780.
Sheehan J, Aden A, Paustian K, Killian K, Brenner J, Walsh M and Nelson R. 2004. Energy and environmental aspects of using corn stover for fuel ethanol. J. Indust. Ecol. 7:117-146.
Spatari S, Zhang YM and MacLean HL. 2005. Life cycle assessment of switchgrass- and corn stover-derived ethanol-fueled automobiles. Environ. Sci. Technol. 39: 9750-9758.
18
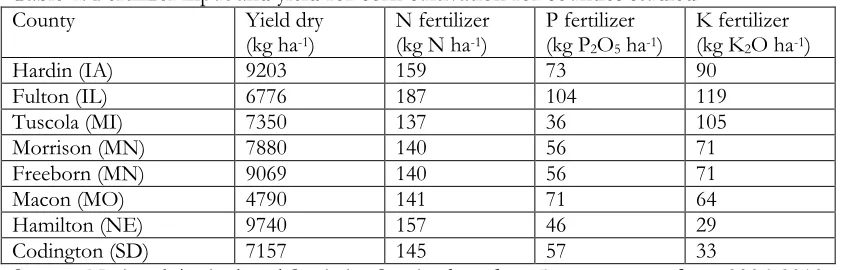
Table 1. Fertilizer input and yield for corn cultivation for counties studied
County Yield dry (kg ha-1)
N fertilizer (kg N ha-1)
P fertilizer (kg P2O5 ha-1)
K fertilizer (kg K2O ha-1)
Hardin (IA) 9203 159 73 90
Fulton (IL) 6776 187 104 119
Tuscola (MI) 7350 137 36 105
Morrison (MN) 7880 140 56 71
Freeborn (MN) 9069 140 56 71
Macon (MO) 4790 141 71 64
Hamilton (NE) 9740 157 46 29
Codington (SD) 7157 145 57 33
19
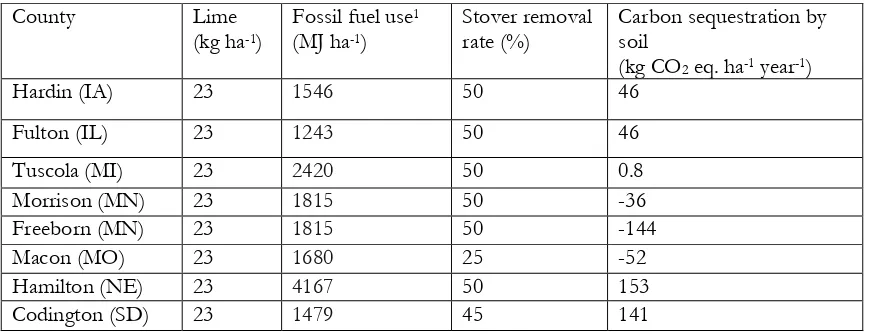
Table 2. Inputs of lime and fossil fuel, stover removal rate and carbon sequestration in corn cultivation for counties studied (Source: Kim et al. 2009)
1. Fossil fuel use includes fuel use for both corn production and stover collection.
County Lime (kg ha-1)
Fossil fuel use1
(MJ ha-1)
Stover removal
rate (%) Carbon sequestration by soil (kg CO2 eq. ha-1 year-1)
Hardin (IA) 23 1546 50 46
Fulton (IL) 23 1243 50 46
Tuscola (MI) 23 2420 50 0.8
Morrison (MN) 23 1815 50 -36
Freeborn (MN) 23 1815 50 -144
Macon (MO) 23 1680 25 -52
Hamilton (NE) 23 4167 50 153
20
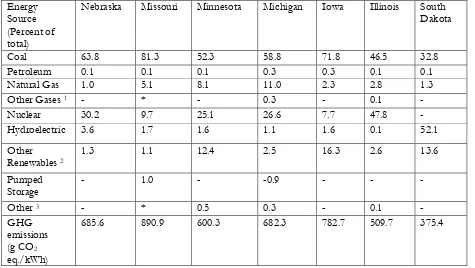
Table 3. Energy sources of state electricity in 2010 (Source: US State Electricity Profile 2010)
1 Other gases include; blast furnace gas, propane gas, and other manufactured and waste gases derived from fossil fuels. 2 Other renewables include; biogenic municipal solid waste, wood, black liquor, other wood waste, landfill gas, sludge
waste, agriculture by-products, other biomass, geothermal, solar thermal, photovoltaic energy, and wind.
3 Other includes; non-biogenic municipal solid waste, batteries, chemicals, hydrogen, pitch, purchased steam, sulfur,
tire-derived fuels and miscellaneous technologies.
* Value is less than half of the smallest unit of measure (e.g., for values with no decimals, the smallest unit is 1 and values under 0.5 are shown as *)
- data not available
Energy Source (Percent of total)
Nebraska Missouri Minnesota Michigan Iowa Illinois South Dakota
Coal 63.8 81.3 52.3 58.8 71.8 46.5 32.8
Petroleum 0.1 0.1 0.1 0.3 0.3 0.1 0.1
Natural Gas 1.0 5.1 8.1 11.0 2.3 2.8 1.3
Other Gases 1 - * - 0.3 - 0.1 -
Nuclear 30.2 9.7 25.1 26.6 7.7 47.8 -
Hydroelectric 3.6 1.7 1.6 1.1 1.6 0.1 52.1 Other
Renewables 2
1.3 1.1 12.4 2.5 16.3 2.6 13.6
Pumped
Storage - 1.0 - -0.9 - - -
Other 3 - * 0.5 0.3 - 0.1 -
GHG emissions (g CO2
eq./kWh)
21
Table 4. Comparison of National Renewable Energy Laboratory (NREL) 2002 (Aden et al. 2002) and 2011 (Humbird et al. 2011) lignocellulosic ethanol design processes.
Design Year (2002) Year (2011)
Chemical Use
(kg/dry tonne of feedstock)
Sulfuric Acid 39.5 23.8
Ammonia 0 12.6
Caustic 0 27.0
Lime 28.7 10.7
Diammonium Phosphate 2.0 1.7
Sorbitol 0 0.5
Corn Steep Liquor 15.7 13.9
Nutrient 0 0.8
Sulfur Dioxide 0 0.2
Glucose 0 29.0
Purchased Cellulase 8.3 0 On site enzyme production 0 7.4 Ethanol Yield
(liter/dry tonne of feedstock) 374 332 Excess Electricity
22
Table 5. GHG emissions of chemicals used in the process of NREL 2011
Chemical GHG emissions
(g CO2.eq./MJ of E100)
Sulfuric Acid 0.43
Ammonia 3.44
Caustic 5.54
Lime 1.90
Diammonium Phosphate 0.15 Corn Steep Liquor 4.06
Nutrient 0.30
Sulfur Dioxide 0.02
Glucose 1.90
23
Table 6. Comparison of greenhouse gas emissions results for E100 from current study with those of Hsu et al. (2010).
g CO2 eq./MJ of produced ethanol
This work Hsu et al. (2010) Stover production1 -5.6 to 12.7 (Avg: 6.5) 18.0
Pre-processing 3.8 to 6.7 (Avg: 4.8) 25.0
Transportation 1.5 2.0
Biorefinery 17.7 9.8
Electricity Credit -8.3 to -19.9 (Avg: -14.3) -21.0 Net 1.5 to 21.9 (Avg: 16.5) 34.8
24
Figure legends:
Figure 1. System boundaries for life cycle assessment of E100 from corn stover
Figure 2. GHG emissions of E100 produced from corn stover based on system expansion approach (a) GHG emissions of stover production, (b) GHG emissions of transportation, which includes transportation of stover and also ethanol produced, (c) GHG emissions of pre-processing, (d) GHG emissions of biorefinery, (e) electricity credit, (f) Net GHG emissions. Note: the combustion of ethanol is considered as a carbon neutral process and the emissions assigned to ethanol combustion are zero.
Figure 3. Figure 3. GHG emissions associated with corn stover production in the counties studied utilizing system expansion and mass allocation. The system expansion results are taken from Kim et al., 2009.
25
Corn Farming Transportation Preprocessing Transportation Biorefinery
Ethanol Combustion
Electricity
Chemicals Fertilizer
Fertilizer replacement for harvested stover
[image:25.612.75.539.94.259.2]Diesel Diesel Electricity Diesel
26
a) Stover production b) Transportation
c) Preprocessing d) Biorefinery
[image:26.612.73.534.87.635.2]e) Electricity credit f) Net emissions
Figure 2. GHG emissions of E100 produced from corn stover based on system expansion approach (a) GHG emissions of stover production, (b) GHG emissions of transportation, which includes
GHG em is si on (g C O2 eq ./ M J) -10 -5 0 5 10 15
Hardin Fulton Tuscola Morrison Freeborn Macon Hamilton Codington
0.0 0.5 1.0 1.5 2.0 2.5 3.0 GHG em is si on (g C O2 eq ./ M J)
Hardin Fulton Tuscola Morrison Freeborn Macon Hamilton Codington
G H G em is s ion ( g C O2 eq ./ M J ) 0 2 4 6 8
Hardin Fulton Tuscola Morrison Freeborn Macon Hamilton Codington
0 2 4 6 8 10 12 14 16 18 20 GHG em is si on (g C O2 eq ./ M J)
Hardin Fulton Tuscola Morrison Freeborn Macon Hamilton Codington
-25 -20 -15 -10 -5 0 GHG em is si on (g C O2 eq ./ M J)
Hardin Fulton Tuscola Morrison Freeborn Macon Hamilton Codington
0 5 10 15 20 25 GHG em is si on (g C O2 eq ./ M J)
27
28
G
HG
e
m
ission
(g
CO
2
e
q./
kg
st
o
v
e
r)
-100 0 100 200 300 400 500
System Expansion Mass Allocation
[image:28.612.74.380.87.306.2]Hardin Fulton Tuscola Morrisson Freeborn Macon Hamilton Codington
29 0 10 20 30 40 50 GHG em iss ion ( g CO 2 eq./ M J)
Hardin Fulton Tuscola Morrison Freeborn Macon Hamilton Codington 0.0 0.5 1.0 1.5 2.0 2.5 3.0
Hardin Fulton Tuscola Morrison Freeborn Macon Hamilton Codington
GH G em is s ion (g C O2 eq ./ M J )
a) Stover production b) Transportation
0 2 4 6 8
Hardin Fulton Tuscola Morrison Freeborn Macon Hamilton Codington
G HG e m ission (g CO 2 e q./ M J) 0 2 4 6 8 10 12 14 16 18 20
Hardin Fulton Tuscola Morrison Freeborn Macon Hamilton Codington
GH G em is s ion (g C O2 eq ./ M J )
d) Preprocessing d) Biorefinery
-25 -20 -15 -10 -5 0 GH G em is s ion (g C O2 eq ./ M J )
Hardin Fulton Tuscola Morrison Freeborn Macon Hamilton Codington 0 10 20 30 40 50 60
Hardin Fulton Tuscola Morrison Freeborn Macon Hamilton Codington
30