DETERMINATION OF ELETRIPTAN IN RABBIT PLASMA BY
LC-MS/MS AND ITS APPLICATION TO PHARMACOKINETIC STUDY
Praveen Kumar Dasari1, Usha Kiranmayi Mangamuri2, Vijayalakshmi Muvva2,
Sudhakar Podha*1
1
Department of Biotechnology, Acharya Nagarjuna University, Guntur, A.P, India-522510.
2
Department of Botany and Microbiology, Acharya Nagarjuna University Nagarjunanagar, Guntur-522510, Andhra Pradesh India.
ABSTRACT
The proposed method is selective, simple, sensitive and specific Liquid chromatography–tandem mass spectrometry method for the quantification of Eletriptan (EP) in rabbit plasma using Naratriptan (NP) as internal standard (IS). Chromatographic separation was performed on Luna®, C18, 50 × 4.6mm, 2.7µm, Phenomenex column and mobile phase composed of 10mM ammonium acetate, (pH-6.5) and acetonitrile (35:65, v/v), with 0.8 mL/min flow-rate. Drug and IS were extracted by protein precipitation extraction. EP and NP were detected with proton adducts at m/z 383.284.3 and 336.297.8 in multiple reaction monitoring (MRM) positive mode respectively. The method was validated over a linear concentration range of 0.05-210ng/mL with correlation coefficient (r2) ≥ 0.998. This method demonstrated intra and inter-day precision within 2.12 to 7.07% and 1.50 to 5.73% and % Accuracy within 99.29 to 102.00 and 100.00 to 102.21% for EP. The drug was found to be stable under various processing and storage conditions. The developed method was employed in preclinical pharmacokinetic evaluation of eletriptan in rabbit plasma.
KEYWORDS: Eletriptan; rabbit plasma; LC-MS/MS.
1. INTRODUCTION
Eletriptan is a second generation serotonin receptor agonist manufactured and marketed by Pfizer Inc used to treat migrane [1]. It is chemically designated as (R)-3-[(1-Methyl-2-pyrrolidinyl) methyl]-5-[2-(phenylsulfonyl) ethyl]-1H-indole monohydrobromide. The
Volume 6, Issue 1, 1152-1164. Research Article ISSN 2277– 7105
*Corresponding Author
Sudhakar Podha
Department of
Biotechnology, Acharya
Nagarjuna University,
Guntur, A.P, India-522510. Article Received on 19 Nov. 2016,
Revised on 09 Dec. 2016, Accepted on 29 Dec. 2016
empirical formula is C22H26N2O2S.HBr with molecular weight of 463.40. Eletriptan
hydrobromide is a white to light pale colored powder that is readily soluble in water. EP is a serotonin agonist, specifically it is a selective 5-hydroxytryptamine 1B/1D (5-HT1B) receptor
agonist binds with high affinity to the 5-HT [1B, 1D,1F] receptors has a modest affinity to the
5-HT [1A,1E,2B,7] receptors and little to no affinity at the 5-HT [2A,2C,3,4,5A,6] receptors. EP is
well absorbed after oral administration with peak plasma levels occurring approximately 1.5 hours after dosing to healthy subjects. The mean absolute bioavailability of eletriptan is approximately 50%.[2-5]
The oral pharmacokinetics is slightly more than dose proportional over the clinical dose range. But 40 mg and 80 mg doses have the dose proportionality. The AUC and Cmax of EP
increased by approximately 20 to 30% following oral administration with a high fat meal. The volume of distribution of eletriptan following IV administration is 138L. Plasma protein binding is moderate and approximately 85%.[6] The N-demethylated metabolite of EP is the only known active metabolite. This metabolite causes vasoconstriction similer to EP in animal models. Though the half-life of the metabolite is estimated to be about 13 hours, the plasma concentration of the N- demethylated metabolite is 10-20% of parent drug and is unlikely to contribute significantly to the overall effect of the parent compound. The terminal elimination half-life of EP is approximately 4hours. Following oral administration during a migrane attack, there was a reduction of approximately 30% in AUC and Tmax was increased
to 2-8 hours.[7-9]
2. MATERIALS AND METHODS
2.1. Chemicals and Reagents
Eletriptan hydrobromide (EP) and Naratriptan hydrochloride (NP) was obtained as gift sample from Matrix Laboratories, India. Acetonitrile (HPLC grade), methanol (HPLC grade) and ammonium acetate were purchased from Merck laboratories, India. Milli-Q water purification system (Millipore, USA) was used for obtaining high quality HPLC grade water. Rabbit plasma was obtained from Raj biotech India, Gujarat.
2.2.Instrumentation
HPLC system (1200 Series Agilent Technologies, Germany) connected with triple quadrupole Mass spectrometer instrument (API 3000, Toronto, Canada). Data processing was performed on Analyst 1.4.1 software package (SCIEX). Ionization was performed by Electro spray positive mode with Unit Resolution. For EP, the [M+H]+ (m/z: 383.2) was monitored as the precursor ion and a fragment of m/z: 84.3 was chosen as the product ion. For internal standard, the [M+H]+ (m/z: 336.2) was monitored as the precursor ion and a fragment of m/z: 97.8 was monitored as the product ion. Mass parameters were optimised as Source temperature 500°C, Ion Spray voltage 5500 volts, Heater gas, Nebulizer gas 35 psi each, Curtain gas 20psi, CAD gas 5psi, (all gass channels were of nitrozen) Source flow rate 500µL/min without split, Entrance potential 10V, Declustering potential 65V for analyte and 75V for internal standard, Collision energy 35V for both analyte and internal standard, Collision cell exit potential 14V for analyte and 16V for internal standard.
2.3. Chromatographic conditions
Luna®, C18, 50 × 4.6 mm, 2.7µm, Phenomenex, USA was selected as analytical column. The isocratic mobile phase consisted of an aqueous phase (10 mM ammonium acetate, pH-6.5) and acetonitrile (35:65, v/v) at a flow rate of 0.8mL/min. The column temperature was set at 40°C. Naratriptan (NP) was found to be appropriate internal standard in terms of chromatography and extractability. The drug and internal standard (NP) were eluted at 0.83 ± 0.2 min and 0.78 ± 0.2 min respectively with 2 min total run time.
2.4. Preparation of Standards and Quality Control (QC) Samples
of EP was added to screened drug-free plasma to obtain calibration standards (0.05, 0.10, 0.20, 0.50, 2.00, 10.00, 20.00, 50.00, 80.00, 160.00 and 210.0ng/mL) and quality control samples (0.05, 0.15, 105.00, 160.00ng/mL) and stored in a -30°C freezer until analysis. Respective aqueous standards were prepared in reconstitution solution (10mM ammonium acetate, pH-6.5: acetonitrile, 35:65, v/v) and stored in refrigerator conditions 2-8°C until analysis.
2.5. Sample preparation
A simple, single-step protein precipitation method was followed for extraction of EP from rabbit plasma. 100µL of plasma sample (respective concentration) was pipetted into a RIA vial, 50µL of NP (500.0ng/mL) and 350µL of acetonitrile (protein precipitating solvent) was added to it and vortex mixed for 2 min. Samples were then centrifuged at 9000 rpm at 4°C for 20 min. From the centrifuged samples 300µL of supernatant was transferred to a sample loading vial and injected into the LC-MS/MS system.
2.6. Selectivity and specificity
The selectivity of the method was determined by six different rabbit blank plasma samples, which were pretreated and analyzed to test the potential interferences of endogenous compounds co-eluting with analyte and IS. Chromatographic peaks of analyte and IS were identified on the basis of their retention times and MRM responses. The peak area of EP at the respective retention time in blank samples should not be more than 20% of the mean peak area of LOQ of EP. Similarly, the peak area of NP at the respective retention time in blank samples should not be more than 5% of the mean peak area of LOQ of NP.
2.7. Recovery
The extraction recovery of EP and NP from rabbit plasma was determined by analyzing quality control samples. Recovery at three concentrations (0.15, 105.00, 160.00 ng/mL) was determined by comparing peak areas obtained from the plasma sample and the standard solution spiked with the blank plasma residue. A recovery of more than 85% was considered adequate to obtain required recovery.
2.8. Limit of Detection (LOD) and Limit of quantification (LOQ)
known concentrations of analytes with blank samples. The limit of quantification (LOQ) is defined as the lowest concentration of analyte that can be determined with acceptable precision and accuracy. The LOQ was found by analyzing a set of mobile phase and plasma standards with a known concentration of EP.
2.9. Matrix effect
Six lots of blank biological matrices were extracted each in triplicates and post spiked with the aqueous standard at the mid QC level, and compared with aqueous standards of same concentration. The overall precision of the matrix factor is expressed as coefficient of variation (CV) and % CV should be <15%.
2.10. Calibration curve, Precission and Accuracy
The calibration curve was constructed using values ranging from 0.05 to 210 ng/mL of EP in rabbit plasma. Calibration curve was obtained by quadratic model with weighted 1/x2 regression analysis. The ratio of EP/NP peak area was plotted against the ratio of EP concentration in ng/mL. Calibration curve standard samples and quality control samples were prepared in replicates (n=6) for analysis. Precision and Accuracy for the back calculated concentrations of the calibration points, should be within ≤15 and ± 15% of their nominal values. However, for LLOQ the Precision and Accuracy should be within ≤ 20 and ± 20%.
2.11. Stability (Freeze - thaw, Auto sampler, Bench top, Long term)
Low quality control and high quality control samples (n=6) were retrieved from deep freezer after three freeze-thaw cycles according to the clinical protocols. Samples were stored at -30
o
C in three cycles of 24, 36 and 48 hrs. In addition, the long-term stability of EP in quality control samples was also evaluated by analysis after 65 days of storage at -30oC.
Autosampler stability was studied following 46 hr storage period in the autosampler tray with control concentrations. Bench top stability was studied for 26 hr period with control concentrations. Stability samples were processed and extracted along with the freshly spiked calibration curve standards. The Precision and Accuracy for the stability samples must be ≤ 15 and ± 15% respectively of their nominal concentrations.
2.12. Analysis of patient samples
dose. All studies were performed after keeping rabbits for overnight fasting. Blood samples of 0.3 ml were collected at the interval 0 (Predose), 0.167, 0.333, 0.5, 0.75, 1, 2, 4, 8, 10, 12, 16, 20, 24 and 30 h (post-dose) in heparinized Eppendorf tubes after administration. These
samples were centrifuged immediately at 3500 rpm and 4◦C temperature for 10 min. Plasma
samples were taken and stored at −30◦C until assay. Pharmacokinetic parameters like peak plasma concentration (Cmax), time to reach peak plasma concentration (tmax), area under the
(concentration–time) curve (AUC) and elimination half-life (t1/2) and were calculated
following non-compartment model of WinNon- Lin 5.1.
2.13. Pharmacokinetics and statistical analysis
Pharmacokinetics parameters from the rabbit plasma samples were calculated by a non-compartmental statistics model using WinNon-Lin 5.1 software (Pharsight, USA). Blood samples were taken for a period of 3 to 5 times the terminal elimination half-life (t1/2) and it
was considered as the area under the concentration time curve (AUC) ratio higher than 80% as per FDA guidelines. Plasma EP concentration-time profiles were visually inspected and Cmax and Tmax values were determined. The AUC0–t was obtained by trapezoidal method.
AUC0–∞ was calculated up to the last measureable concentration and extrapolations were
obtained using the last measureable concentration and the terminal elimination rate constant (Ke) it was estimated from the slope of the terminal exponential phase of the plasma of EP
concentration-time curve (by means of the linear regression method). The terminal elimination half-life (t1/2) was then calculated as 0.693/Ke. Regarding AUC0–t, AUC0–∞ and
Cmax bioequivalence was assessed by means of analysis of variance (ANOVA) and
calculating the standard 90% confidence intervals (90% CIs) of the ratios test/reference (logarithmically transformed data). The bioequivalence was considered when the ratio of averages of log transformed data was within 80-125% for AUC0–t, AUC0–∞ and Cmax [13-15].
3. RESULTS AND DISCUSSION
3.1. Method development and validation
methods were optimized through several trials to achieve best resolution and increase the signal of EP and NP. The MS optimization was performed by direct infusion of solutions of both EP and NP into the ESI source of the mass spectrometer. The critical parameters in the ESI source includes the needle (ESI) voltage, Capillary voltage, source temperature and other parameters such as nebulizer gas, heater gas and desolvation gases were optimized to obtain a better spray shape, resulting in better ionization of the protonated ionic EP and NP molecules (Fig.1).
[image:7.595.121.478.223.340.2]A B
Fig. 1: Chemical Structures of A) Eletriptan Hydrobromide (EP) B) Naratriptan (NP)
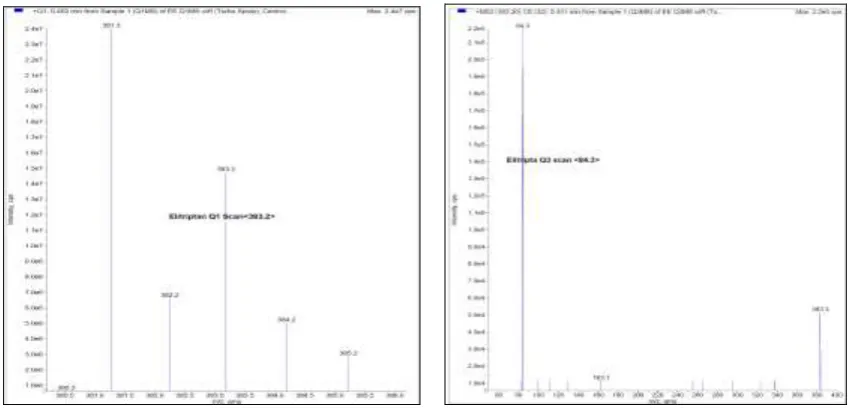
Product ion spectrum for EP and NP yielded high-abundance fragment ions of m/z 84.3 and
m/z 97.8 respectively (Fig. 2 and Fig 3).
[image:7.595.85.511.436.640.2]
Fig. 3: Parent ion mass spectra (Q1) & Product ion (Q3) mass spectrums of NP
After mass spectrometer parameters optimized, chromatographic conditions such as mobile phase optimization, column optimization, and extraction method optimization were performed to obtain a fast and selective LC method. A good separation and elution were achieved using Luna®, C18, 50 × 4.6 mm, 2.7 µm, Phenomenex, USA was selected as analytical column and mobile phase consisted of 10 mM ammonium acetate, pH-6.5: acetonitrile (35:65, v/v) at a flow rate of 0.8 mL/min and injection volume of 20 µL. Protein precipitation extraction method was optimized for best chromatography (Fig. 4).
[image:8.595.111.486.479.734.2]3.2. Selectivity and Specificity
The analysis of EP and NP using MRM (Multiple reaction monitoring) function was highly selective with no interfering compounds.
3.3. Limit of Detection (LOD) and Quantification (LOQ)
The limit of detection was used to determine the instrument detection levels for EP even at low concentrations. 5L of a 0.5pg/mL solution was injected and estimated LOD was 2.5fg with S/N values ≥ 3-5. The limit of quantification for this method was proved as lowest concentration of the calibration curve which was proved as 0.05ng/ml.
3.4. Matrix effect
Six lots of blank biological matrices were extracted each in triplicates and post spiked with the aqueous standard at the LQC, HQC level, and compared with neat standards of same concentration in alternate injections. The overall precision of the matrix factor is 3.08 at LQC level and 1.23 for HQC level for E P . There was no ion-suppression and ion- enhancement effect observed due to IS and analyte at respective retention time.
3.5. Calibration curve standards, Precision and Accuracy
Calibration curves were plotted as the peak area ratio (EP/NP) versus (EP) concentration. Precision and Accuracy of Calibration curve standards, Quality control standards are represented in Table.1 & 2.
Table.1: Calibration Curve details
Spiked plasma concentration
(ng/mL)
Concentration Measured (mean)
(ng/mL)
SD CV (%)
(n = 5) Accuracy %
0.05 0.05 0.0 0.00 100.00
0.10 0.10 0.00 0.00 100.00
0.20 0.20 0.01 1.32 100.0
0.50 0.49 0.00 3.94 97.6
2.00 1.97 0.04 2.15 98.5
10.0 9.97 0.08 0.66 99.6
20.0 19.9 0.24 1.22 99.8
50.0 50.5 0.79 1.66 101.08
80.0 80.3 0.66 0.76 100.45
Table.2: Precision &Accuracy data Spiked plasma concentrati on (ng/mL) Within-run Between-run Concentration measured (n=6) (ng/mL) (mean ± S.D.)
CV (%)
%AccuracyConcentration measured (n=30) (ng/mL)
(mean ± S.D.)
CV (%)
Accuracy %
0.05 0.05±0.00 7.07 100.00 0.05 0.00 5.73 100.00 0.15 0.15±0.00 2.92 102.00 0.15 0.01 3.85 100.00 105.00 104.25±2.96 2.84 99.29 107.00 2.03 1.91 101.90 160.00 162.18±3.44 2.12 101.36 163.53 2.45 1.50 102.21
3.6. Stability (Freeze - thaw, Auto sampler, Bench top, Long term)
Quantification of the EP in plasma subjected to three freeze-thaw cycles (-30°C to room temperature), Autosampler, Room temperature (Bench top), Long term stability details were shown in Table.3.
Table.3: Stability data
Stability Plasma concentration
(ng/mL)
Eletriptan Concentration Measured
(mean±SD) (n=6; ng/mL) CV (%)(n=6) Accuracy
Bench-top stability (26 h)
0.15 0.14±0.00 2.88 94.44 160.00 152.27±1.19 0.78 95.17
Autosampler stability (46 h)
0.15 0.15±0.00 1.70 101.11 160.00 162.63±2.58 1.59 101.64
Freeze-thaw stability (3cycles)
0.15 0.15±0.01 4.50 101.11 160.00 161.22±2.28 1.41 100.76
Long term stability (65 days)
0.15 0.15±0.00 1.74 98.89 160.00 162.77±1.27 0.78 101.73
3.7. Recovery
The recovery of EP was determined at three different concentrations 0.15, 60.0 and 105.0ng/mL. The overall average recovery of EP and NP were found to be 77.46 and 79.62% respectively.
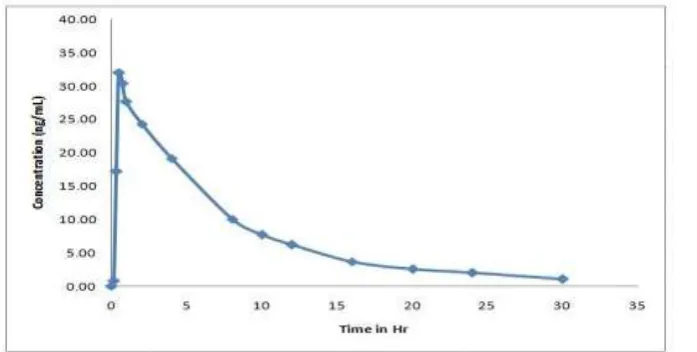
3.8. Application to biological samples
Fig. 5: Mean plasma concentrations vs. time graph of Eletriptan after oral
administration of 277.5 µg/1.8kg in six healthy rabbits.
All the plasma concentrations of EP were within the standard curve region and retained above the 0.05ng/mL (LOQ) for the entire sampling period in Table-4.
Table.4: Mean pharmacokinetic parameters of Eletriptan in rabbit plasma after oral
administration of 277.5 µg/1.8kg in 6 healthy rabbits
Pharmacokinetic Parameter Eletriptan
Cmax (ng/mL) 32.1
AUC0-t (ng x h/mL) 230.3
AUC0-∞ (ng x h/mL) 241.1
Tmax (h) 0.5
Kel (h-1) 0.09539
t ½ (h) 7.3
AUC0—∞: area under the curve extrapolated to infinity; AUC0—t: area under the curve up to the last sampling time; Cmax: the maximum plasma concentration; Tmax: the time to reach
peak concentration; Kel: the apparent elimination rate constant.
4. CONCLUSIONS
[image:11.595.130.479.74.250.2]high-throughput bioanalysis of eletriptan. The validated method was successfully applied in Pharmacokinetic study of rabbit plasma.
5. ACKNOWLEDGEMENTS
Authors wish to thank the support received from IICT (Indian Institute of Chemical Technology) Hyderabad and Acharya Nagarjuna University Guntur India for providing Literature survey & to carry out this Research work.
REFERENCES
1. Cole. P and Rabasseda X. Migraine headache treatment with eletriptan, a second-generation serotonin receptor agonist. Drugs Today (Barc), 2001; 37: 159-71.
2. Diener HC, Dodick DW, Goadsby PJ, Lipton RB, Almas M,Parsons B. Identification of negative predictors of pain-free response to triptans: analysis of the eletriptan database. Cephalalgia, 2008; 28: 35-40.
3. Milton KA, Scott NR, Allen MJ, Abel S, Jenkins VC, James GC, Rance DJ, Eve MD. Pharmacokinetics, pharmacodynamics and safety of the 5-HT (1B/1D) agonist eletriptan following intravenous and oral administration. J Clin Pharmacol, 2002; 42: 528-39. 4. Evans DC, Connor DO, Lake BG, Evers R, Allen C, Hargreaves R. Eletriptan
metabolism by human hepatic CYP450 enzymes and transport by human P-glycoprotein. Drug Metab Dispos, 2003; 31: 861-69.
5. Abraham Sunshine, Serena A. Mulhern, Nancy Olson, Arthur Elkind, Mary Almas, Carolyn Sikes. Comparative sensitivity of stopwatch methodology and conventional pain assessment measures for detecting early response to triptans in migraine: results of a randomized, open-label pilot study, Clin Ther, 2006; 28: 1107-15.
6. Schoenen J, Pascual J, Rasmussen S, Sun W, Sikes C, Hettiarachchi J.Patient preference for eletriptan 80 mg versus subcutaneous sumatriptan 6 mg: results of a crossover study in patients who have recently used subcutaneous sumatriptan. Eur J Neurol, 2005; 12: 108-117.
7. Sternieri E, Coccia CP, Pinetti D, Ferrari A. Pharmacokinetics and interactions of headache medications, part I: introduction, pharmacokinetics, metabolism and acute treatments, Expert Opin Drug Metab Toxicol. 2006; 2: 961-79.
9. Shah AK, Laboy-Goral L, Scott N, Morse T, Apseloff G. Pharmacokinetics and safety of oral eletriptan during different phases of the menstrual cycle in healthy volunteers. J Clin Pharmacol. 2001; 41: 1339-44.
10.Gillogly JA and Lunte CE. pH- mediated acid stacking with reverse pressure for the analysis of cationic pharmaceuticals in capillary electrophoresis, Electrophoresis, 2005; 26: 633-639.
11.Cooper JD, Muirhead DC, Taylor JE. (1999). Determination of eletriptan in plasma and saliva using automated sequential trace enrichment of dialysate and high-performance liquid chromatography. J Pharm Biomed Anal, 1999; 21: 787-96.
12.Jocic B, Zecevic M, Zivanovic L, Protic A, Jadranin M, Vajs V. Study of forced degradation behavior of eletriptan hydrobromide by LC-MS and development of stability-indicating method. J Pharm Biomed Anal, 2009; 50: 622-29.
13.Guidance for industry: bioanalytical method validation, U.S. Department of Health and Human Services, Food and Drug Administration, Center for Drug Evaluation and Research (CDER), Center for Biologics Evaluation and Research (CBER), May 2001. 14.Guidance for industry: Food- effect bio availability and Fed Bio equivalence studies.
U.S.Department of Health and Human services Food and Drug Administration Centre for Drug Evaluation and research (CDER) December 2002.