The present agriculture is substantially dependent on commodity chains and food nets that embodied all
parts of agribusiness1 from input suppliers through
producers, processors and traders to final users. Since the 1980s, the agribusiness sector globally has been
subjected to continuous structural change as a more dynamic and demanding consumer base has thrown down the gauntlet in relation to the expanded expecta-tions (Wilkinson 2003). Businesses at all stages of the agro-industry chains have consolidated dramatically
Economic performance differentiation of the
processing stage within the commodity chain
Diferenciace ekonomické výkonnosti zpracovatelského stupně
v rámci komoditní vertikály
Ivana BLAŽKOVÁ
Faculty of Regional Development and International Studies, Mendel University
of Brno, Brno Czech Republic
Abstract: The article is focused on the evaluation of economic differentiation of subjects on particular processing stages
within the wheat commodity chain in the czech republic with regard to agro-food market development in the last years. The analysis is based on the statement that better economic results of businesses can be achieved not only by successful business strategy or quality management and employees but also by business ability to advance its own interests and to influence market conditions, such as setting higher prices, pressure on lower input prices, better position for negotiati-ons with business partners etc. The Spider Analysis was used for evaluation. The results of analysis have proved worse-ning of economic position of the second stage of processing (bakeries) in comparison with the first stage of processing (mills) within the commodity chain in the last time, especially as a result of increasing market power of retail. it was also confirmed that decisive subjects in milling industry become bigger mills with joining to raw commodity supplier and subsequent processing stages.
Key words: economic differentiation, commodity chain, Spider Analysis, processing stage
Abstrakt: Článek je zaměřen na hodnocení ekonomické diferenciace subjektů na jednotlivých stupních zpracování v
rám-ci komoditní vertikály potravinářské pšenice v České republice s ohledem na vývoj zemědělsko-potravinářského trhu v posledních letech. Analýza je založena na předpokladu, že lepší ekonomické výsledky podniků na trhu jsou dosaženy nejen prostřednictvím úspěšné podnikatelské strategie nebo kvalitního managementu a zaměstnanců, ale také schopností těchto podniků prosazovat své zájmy na trhu a ovlivňovat podmínky na trhu, a to zejména stanovováním vyšších cen, tlakem na ceny surovin při nákupu od dodavatelů, lepší vyjednávací pozicí s obchodními partnery aj. Pro hodnocení byla použita metoda Spider analýzy. Výsledky analýzy prokázaly zhoršování ekonomické pozice druhé fáze zpracování (pekáren) ve srovnání s první fází zpracování (mlýny) v rámci komoditní vertikály v posledním období, a to především důsledkem rostoucí tržní síly obchodu. Bylo také potvrzeno, že rozhodujícími subjekty v mlýnském odvětví se stávají větší mlýny s napojením na dodavatele výchozí suroviny i na navazující zpracovatelské fáze.
Klíčová slova: ekonomická diferenciace, komoditní řetězec, Spider analýza, fáze zpracování
1Agribusiness is conceptualized according to the Davis-goldberg concept (19��).(19��).
(heffernan et al. 1999), leaving a smaller and a con-tinually decreasing number of increasingly larger and more powerful players. Agribusiness is a regulated sector and many of the issues that it faces are global – from environmental impacts and guarantee issues, to free trade agreements. Sustainable value creation in such situation requires the participation of all par-ties involved in a particular agro-industry chain with regard to global markets and political and economic arenas involved. innovation and agility are the keys to success (Bryceson 2006; Bečvářová 2008).
The present changes of agribusiness (e.g. concentra-tion, globalisaconcentra-tion, market power, agricultural policy) influence all subjects in the market. concentration and the market power lead to the market unbalance in the framework of the food commodity chains. Due to the system disproportion of the whole agri-business and the imperfect price transmission, some market segments can gain a greater market power and extra revenue compared to others (Bečvářová, Lechanová 2006).
it relates especially to two markets and their
inter-connection within the commodity chain. (a)
Agricul-tural commodity market, where the market power of the processor (monopsony resp. oligopsony) handicaps negotiation possibilities of farmers due to the farm size and character of agricultural commodities that are perishable and also dependent on transport distances between the place of production and consumption. (b) Food market, where the processing and distribution firms (monopoly resp. oligopoly) do not accurately and completely transfer changes from the farm level to consumers, and, moreover, consumer demand is still more influenced by marketing activities of big retailers (Blažková 200�).
According to the market structure, market power is used between the processor and the retail stage of the food chain, which is one of the typical demonstrations of agribusiness in the transformed economics such as the czech republic (Bečvářová 200�). Big producers with a known trademark seem more resistant towards the pressure of big retailers. The position of smaller processors is more vulnerable.
in the last time period, powerful food commodity chains have emerged, in which few big firms dominate (Swinnen 200�). By the force of strategic alliances and joint ventures, they are able to dominate an impor-tant part of food commodity vertical in agribusiness from the research and biological material production to the final food products. in the EU, the trend is
more noticeable in the economically most developed member countries such as germany and great Britain (value added of food processing industry is triple in comparison with agricultural production). on the other side, “agricultural” states such as greece, Portugal or italy make a relatively low processing share of basic agricultural commodity (value added of food processing industry comprises about 12–30% of the farm value added) and food market is still more dominated by the large retail firms with high value added food products of foreign provenience (Bečvářová, Lechanová 2006).
Food and agribusiness firms are confronted with a great competition in the agro-food markets. The development brings about the need for durable
part-nerships. Vertical integration2 (or coordination) could
be one of the solutions. Before deciding about ver-tical integration or coordination, it is necessary to thing about its important general contributions and costs, depending on the given sector (Bečvářová 2001; Blažková 2002; Porter 1994; ziggers, Trienekens 1999).
in general it is believed that vertical integration and contracts have resulted in improved, consistently higher-quality, more-uniform food products and a wider choice of food products for the consumers. critics argue, however, that such vertical coordina-tion or integracoordina-tion may increase the market power and thereby adversely affect market performance (carlton, Perloff 2000). Some economists argue that vertical mergers cannot transfer market power from one level to another (Williamson 19�4; Klein et al. 19�8; Perry 1989), the opposite view is that “when vertical mergers displace open transactions, it often forecloses the market and excludes rivals” (Shepherd, Shepherd 2004). The issue of whether vertical integra-tion can raise the market power is hotly debated in the literature (see Martin 1993; george et al. 1992; Azzam, Pagoulatos 1990; Bhuyan, Lopez 199�).
ObjEctivEs And mEthOdOlOgy
The objective of the article is to analyse the eco-nomic situation in the particular processing stages within the chosen commodity chain with regard to the agro-food market development in the last years. Simultaneously, there was verified the possibility of usage of one of the methods of economic analysis at the sector level for the purposes of the evaluation of
2Porter (1994) defines vertical integration as “the combination of technologically different production, distribution,
economic differentiation on the particular vertical stages. The analysis was based on the statement that better economic results of businesses can be achieved not only by a successful business strategy or quality management and employees but also by the business ability to advance its own interests and to influence market conditions, such as setting higher prices, pressure on lower input prices, a better position for negotiations with business partners etc.
The problem is presented on the example of the wheat commodity chain in the czech republic, where the first stage of processing is represented by flour production in the mills and the second stage of processing is represented by the bakery and pasta production.
The paper is based on the agricultural statistical reports of the czech Statistical office and research results published by the Ministry of Agriculture of the czech republic and the Ministry of industry and Trade of the czech republic. Furthermore, the analyses and market evaluations of the Economic research Service of the United States Department of Agriculture were used. The common statistical
methods, e.g. analysis, synthesis, comparison, were employed in the data processing.
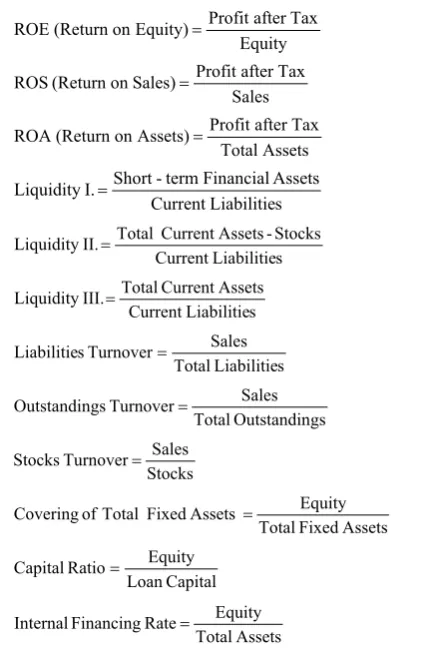
The Spider Analysis Method was used for the evalu-ation of the business economic position, because it works with relatively available data (accounting data available in annual reports of businesses) and it enables the presentation of results in the schematic and transparent way. The Spider diagram is made from 12 half-axes with the percentage scale, there are chosen ratio numbers on them (Table 1). higher values of the ratios mean better results and a longer distance from the centre of the diagram.
The Spider Analysis was used for the evaluation of the economic position of the bakery and milling industry within the food processing industry and for comparison of these two stages of processing in 2000 and 200�. Processors of the milling-bakery industry were evaluated according to their size as well.
REsults And discussiOn
The basic agricultural commodity (wheat) goes within the commodity chain through two processing stages – the flour production in mills (the first stage of processing) and the bakery production in bakeries (the second stage of processing). The first stage of processing is generally characterised by undifferenti-ated products with a low value added, the low share in the consumers food expenditures, a significant influence of agricultural policy and by the position of the price accepter, because prices are created on this stage of processing by the market or by the agri-cultural policy. on the other side, the bakery indus-try as the second processing stage within the wheat commodity chain provides high finalised products for final consumption. it is characterised by a higher share in the consumer food expenditures (the share in consumer food price is about �2% for the second stage of processing in the czech republic in 2006, whereas the share of the first stage of processing is only 6%). The production of this sector is significantly influenced by the consumers demand. Profitability of this sector is hobbled by the forced competition in the sector, surplus capacities and the market position of the following stage – retail (Blažková 2002).
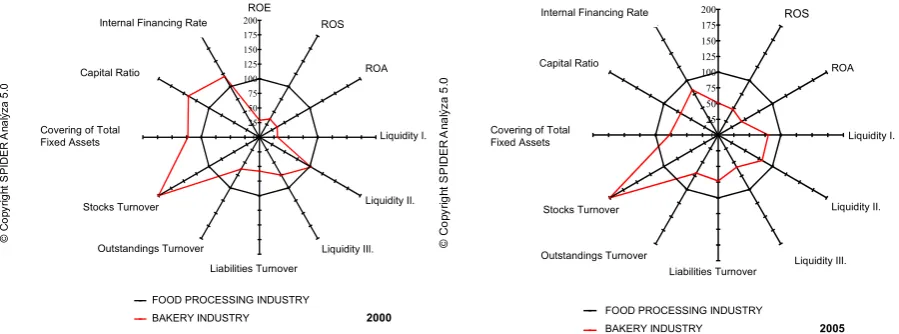
the economic position of the bakery industry within the food processing industry
[image:3.595.66.290.413.743.2]The comparison of the position of the bakery in-dustry within the food processing inin-dustry in 2000 and 200� is shown in Figure 1.
Table 1. ratios used in Spider diagram
Equity Tax after Profit Equity) on (Return ROE
Sales Tax after Profit Sales) on (Return ROS
Assets Total
Tax after Profit Assets) on (Return ROA
s Liabilitie Current
Assets Financial term
-Short I. Liquidity
s Liabilitie Current
Stocks -Assets Current Total II.
Liquidity
s Liabilitie Current
Assets Current Total III.
Liquidity
s Liabilitie Total
Sales Turnover
s
Liabilitie
gs Outstandin Total
Sales Turnover
gs
Outstandin
Stocks Sales Turnover
Stocks
Assets Fixed Total
Equity Assets
Fixed Total of
Covering
Capital Loan
Equity Ratio
Capital
Assets Total
Equity Rate
Financing
Internal
Primarily, we can see a significantly lower profit-ability of the bakery industry in comparison with the whole food processing industry. This situation is a consequence of the fact that the bakery industry produces essential products of everyday consumption, the prices of which do not raise considerably, but all costs do. The bakery industry does not realize high margins as is shown by the ratios based on profits. The business ability to realize its products and serv-ices in the market is described by the roS ratio. Low values of this ratio can be influenced by the product quality, the marketing and price strategy, advertising, the consumer mood etc. The unbalanced position of the particular stages within the commodity chain (retail market power) can have a negative influence as well. Low values of the roE ratio for the bakery industry in comparison with the whole food industry in both years (4.�% compared to 1�.1% in 2000 and �.8% compared to 1�.2% in 200�) are influenced not only by the attained profit, but also by the range of the equity financing, because the lower indebtedness of the bakery industry can in a measure implicate a decline of the roE.
We can see a significant impairment of all indebted-ness ratios in 200� for the bakery industry. The internal Financing rate of bakery companies is 43.�% in 200� compared to �2.1% in the food industry. Also long-term assets are not fully financed by own resources in 200�. These results may arise from the non-stabilized situation in the bakery market, and also the investment into modernization and into the fulfilment of the EU requirements and norms forces bakery companies to use more loan capital and so it leads to the higher indebtedness of the bakery industry.
Liquidity of the bakery industry is lower than that of the processing industry in the time in view, how-ever, the critical value was found out only for the Liquidity iii ratio (0.98 in 200�). it implies that the
bakery industry uses even long-term financial re-sources for covering the short-term assets, which can have a negative influence on the business stability.
Stocks Turnover ratio points out, that the stocks usage is better in the bakery industry than in the whole processing industry (19.� in comparison with �.11 in 2000 and 30.9 in comparison with 8.� in 200�). These values are related to the fact, that bakery and patisserie products belong to high-speed turnover goods, the production interval is short and these products cannot be produced for stock.
Both the outstandings and Liabilities Turnover ratios of the bakery industry reach about 60–�0% of the value of the processing industry in both years, the outstandings and Liabilities Turnover period is 90–100 days in the bakery industry. The situation in the market is contributing to the low values of the Liabilities Turnover – a keen competition in the bakery industry (as a result of the surplus capacity) and market power of the following stage of the verti-cal (retail stage).
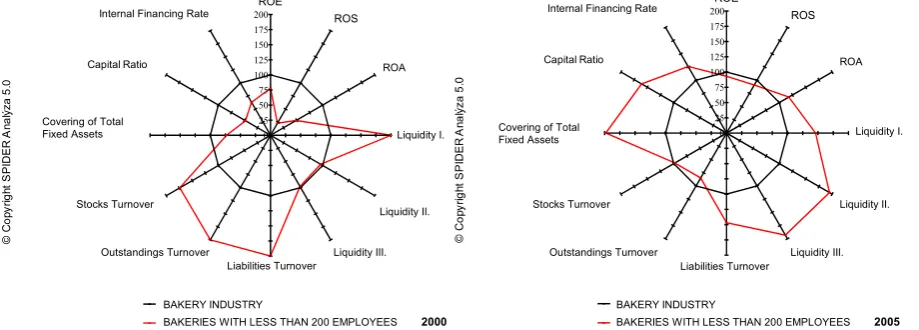
the economic position of bakeries according to their size
Within the bakery industry, there were analysed busi-nesses divided according to their size in dependence on the number of employees – bakeries with less than 200 employees, bakeries with 200–499 employees and bakeries with �00 and more employees. The compari-son was made in 2000 and 200� and the conclusions about the position of the individual size groups within the analysed vertical were made. The results of the Spider Analysis are shown in Figures 2–4.
in Figure 3, there can be seen the best economic position of bakeries with 200–499 employees in the market. This group of bakeries has above-average
0 25 50 75 100 125 150 175
200ROE ROS
ROI
Likvidita I.
Likvidita II.
Likvidita III. Obrátka závazkĤ
Obrátka pohledávek Obrátka zásob Krytí stálých aktiv
Kapitálový pomČr Vlastní financování
PotravináĜský prĤmysl - 12/2000 - 150 - CZE Pekárenský prĤmysl - 12/2000 - 158 - CZE
0 25 50 75 100 125 150 175
200ROE ROS
ROI
Likvidita I.
Likvidita II.
Likvidita III. Obrátka závazkĤ
Obrátka pohledávek Obrátka zásob Krytí stálých aktiv
Kapitálový pomČr Vlastní financování
PotravináĜský prĤmysl - 12/2005 - 150 - CZE Pekárenský prĤmysl - 12/2005 - 158 - CZE ROA
Liquidity I.
Liquidity II.
Liquidity III.
Liquidity II. Liquidity I.
Liquidity III. ROA ROA
Liabilities Turnover Liabilities Turnover
Outstandings Turnover Outstandings Turnover
Stocks Turnover Stocks Turnover
Covering of Total
Fixed Assets Covering of Total Fixed Assets
Capital Ratio Capital Ratio
Internal Financing Rate Internal Financing Rate
FOOD PROCESSING INDUSTRY
BAKERY INDUSTRY 2000 FOOD PROCESSING INDUSTRY
BAKERY INDUSTRY 2005 Capital Ratio
Covering of Total Fixed Assets Covering of Total
Fixed Assets
[image:4.595.73.523.74.241.2]Liquidity III.
economic results in the profitability field in both analysed years. The inferior bargaining position in the market puts pressure on the bakeries to conform to the requirements of the customers at price negotia-tions. it is difficult for them to ensure a regular and
certain income with regard to the keen competition and low exercise prices.
The lowest profitability was found out in the biggest bakeries with more than �00 employees (Figure 4). The low profitability in this size category was strongly
0 25 50 75 100 125 150 175200ROE ROS
ROI
Likvidita I.
Likvidita II.
Likvidita III. Obrátka závazkĤ
Obrátka pohledávek Obrátka zásob Krytí stálých aktiv
Kapitálový pomČr Vlastní financování
Pekárenský prĤmysl - 12/2005 - 158 - CZE Pekárny do 200 zam. - 12/2005 - 158 - CZE 0 25 50 75 100 125 150 175
200ROE ROS
ROI
Likvidita I.
Likvidita II.
Likvidita III. Obrátka závazkĤ
Obrátka pohledávek Obrátka zásob Krytí stálých aktiv
Kapitálový pomČr Vlastní financování
Pekárenský prĤmysl - 12/2000 - 158 - CZE Pekárny do 200 zam. - 12/2000 - 158 - CZE
ROA ROA
Liquidity I. Liquidity I.
Liquidity II. Liquidity II.
Liquidity III. Liquidity III.
Liabilities Turnover Liabilities Turnover
Outstandings Turnover Outstandings Turnover
Internal Financing Rate Internal Financing Rate
Stocks Turnover Stocks Turnover
Capital Ratio Capital Ratio
Covering of Total Fixed Assets
Covering of Total Fixed Assets
BAKERY INDUSTRY
BAKERIES WITH LESS THAN 200 EMPLOYEES 2000
BAKERY INDUSTRY
BAKERIES WITH LESS THAN 200 EMPLOYEES 2005
Capital Ratio
Covering of Total Fixed Assets
Liquidity II.
Covering of Total Fixed Assets
Capital Ratio
Figure 2. The position of the bakeries with less than 200 employees within the bakery industry in 2000 and 200�
0 25 50 75 100 125 150 175200ROE ROS
ROI
Likvidita I.
Likvidita II.
Likvidita III. Obrátka závazkĤ
Obrátka pohledávek Obrátka zásob Krytí stálých aktiv
Kapitálový pomČr Vlastní financování
Pekárenský prĤmysl - 12/2005 - 158 - CZE Pekárny 200-499 zam. - 12/2005 - 158 - CZE 0 25 50 75 100 125 150 175
200ROE ROS
ROI
Likvidita I.
Likvidita II.
Likvidita III. Obrátka závazkĤ
Obrátka pohledávek Obrátka zásob Krytí stálých aktiv
Kapitálový pomČr Vlastní financování
Pekárenský prĤmysl - 12/2000 - 158 - CZE Pekárny 200-499 zam. - 12/2000 - 158 - CZE
Internal Financing Rate Internal Financing Rate
ROA ROA
Liquidity I. Liquidity I.
Liquidity II. Liquidity II.
Liquidity III. Liquidity III.
Liabilities Turnover Liabilities Turnover
Outstandings Turnover Outstandings Turnover
Stocks Turnover Stocks Turnover
Capital Ratio Capital Ratio
Covering of Total
Fixed Assets Covering of Total Fixed Assets
BAKERY INDUSTRY
BAKERIES WITH 200-499 EMPLOYEES 2000
BAKERY INDUSTRY
BAKERIES WITH 200-499 EMPLOYEES 2005
Capital Ratio Capital Ratio
Covering of Total
[image:5.595.71.531.159.324.2]Fixed Assets Covering of Total Fixed Assets
Figure 3. The position of the bakeries with 200–499 employees within the bakery industry in 2000 and 200�
0 25 50 75 100 125 150 175200ROE ROS
ROI
Likvidita I.
Likvidita II.
Likvidita III. Obrátka závazkĤ
Obrátka pohledávek Obrátka zásob Krytí stálých aktiv
Kapitálový pomČr Vlastní financování
Pekárenský prĤmysl - 12/2000 - 158 - CZE Pekárny nad 500 zam. - 12/2000 - 158 - CZE
0 25 50 75 100 125 150 175
200ROE ROS
ROI
Likvidita I.
Likvidita II.
Likvidita III. Obrátka závazkĤ
Obrátka pohledávek Obrátka zásob Krytí stálých aktiv
Kapitálový pomČr Vlastní financování
Pekárenský prĤmysl - 12/2005 - 158 - CZE Pekárny nad 500 zam. - 12/2005 - 158 - CZE
ROA ROA
Liquidity I. Liquidity I.
Liquidity II. Liquidity II.
Liquidity III. Liquidity III.
Liabilities Turnover Liabilities Turnover
Outstandings Turnover Outstandings Turnover
Internal Financing Rate Internal Financing Rate
Stocks Turnover Stocks Turnover
Capital Ratio Capital Ratio
Covering of Total
Fixed Assets Covering of Total Fixed Assets
BAKERY INDUSTRY
BAKERIES WITH 500 AND MORE EMPLOYEES 2000
BAKERY INDUSTRY
BAKERIES WITH 500 AND MORE EMPLOYEES 2005
Capital Ratio Capital Ratio
Covering of Total
Fixed Asstes Covering of Total Fixed Assets
[image:5.595.73.524.366.537.2]Liquidity II.
influenced by the technological changes and restruc-turing connected with the high costs of modernisation and investments (due to the EU requirements) and the higher marketing and advertisement expenditures. These influences were substantial especially in 2 000 during the time of the EU accession preparations.
From the viewpoint of liquidity and stocks turnover, the situation is similar in all size groups of bakeries. Bigger bakeries are better technologically equipped and produce also various durable food bakery products and specialities, which can be produced to stocks, their production is more complicated and requires often a longer production interval. Therefore, the Stock Turnover is rather slower.
The biggest bakeries with more than �00 employees show the highest indebtedness (about 60 %). These companies have a better access to credits and the indebtedness is raised also by the need of financial funds for the modernisation, investments and the EU norms standing as mentioned above.
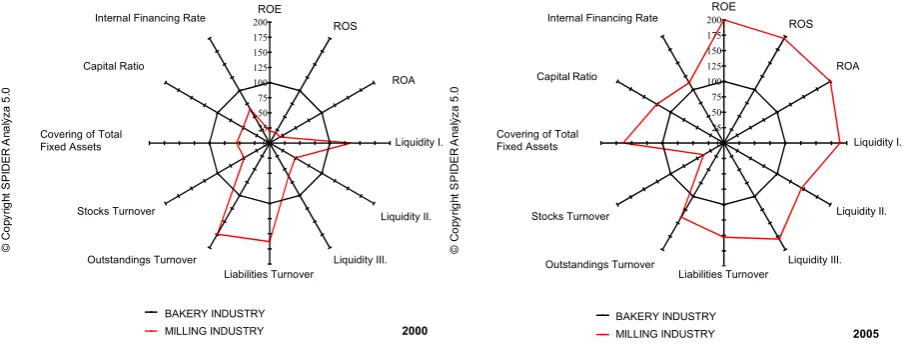
the economic position of the milling industry
in the following part of the paper, the evaluation of the milling industry economic position in 2000 and 200� is presented by the way of the comparison with the whole food processing industry (Figure �) and the comparison with the bakery industry (Figure 6).
While in 2000 the profitability of the milling industry was markedly lower than that of the food processing industry, in 200� the results were more balanced. The profitability of the milling industry has increased more than that of the bakery industry, which is evident also from the comparison of both these processing stages in Figure 6. The position of milling industry is strengthening because of the dominant position of the retail stage in the chain, which prevents the bakery product prices from raising.
Also the liquidity is better in the milling industry in comparison with both the food processing industry and the bakery industry. it is related to indebtedness.
0 25 50 75 100 125 150 175
200ROE ROS
ROI
Likvidita I.
Likvidita II.
Likvidita III. Obrátka závazkĤ
Obrátka pohledávek Obrátka zásob Krytí stálých aktiv
Kapitálový pomČr Vlastní financování
PotravináĜský prĤmysl - 12/2005 - 150 - CZE Mlýnský prĤmysl - 12/2005 - 156 - CZE 0
25 50 75 100 125 150 175
200ROE ROS
ROI
Likvidita I.
Likvidita II.
Likvidita III. Obrátka závazkĤ
Obrátka pohledávek Obrátka zásob Krytí stálých aktiv
Kapitálový pomČr Vlastní financování
PotravináĜský prĤmysl - 12/2000 - 150 - CZE Mlýnský prĤmysl - 12/2000 - 156 - CZE
Internal Financing Rate Internal Financing Rate
Outstandings Turnover Outstandings Turnover
Liabilities Turnover Liabilities Turnover
Liquidity I. Liquidity I.
Liquidity II. Liquidity II.
Liquidity III. Liquidity III.
ROA ROA
Stocks Turnover Stocks Turnover
Capital Ratio Capital Ratio
Covering of Total
Fixed Assets Covering of Total Fixed Assets
FOOD PROCESSING INDUSTRY
MILLING INDUSTRY 2000
FOOD PROCESSING INDUSTRY
MILLING INDUSTRY 2005
Covering of Total
[image:6.595.70.530.364.537.2]Fixed Assets Liquidity I. Covering of Total Fixed Assets
Figure �. The position of the milling industry within the food processing industry in 2000 and 200�
0 25 50 75 100 125 150 175
200ROE ROS
ROI
Likvidita I.
Likvidita II.
Likvidita III. Obrátka závazkĤ
Obrátka pohledávek Obrátka zásob Krytí stálých aktiv
Kapitálový pomČr Vlastní financování
Pekárenský prĤmysl - 12/2000 - 158 - CZE Mlýnský prĤmysl - 12/2000 - 156 - CZE
0 25 50 75 100 125 150 175
200ROE ROS
ROI
Likvidita I.
Likvidita II.
Likvidita III. Obrátka závazkĤ
Obrátka pohledávek Obrátka zásob Krytí stálých aktiv
Kapitálový pomČr Vlastní financování
Pekárenský prĤmysl - 12/2005 - 158 - CZE Mlýnský prĤmysl - 12/2005 - 156 - CZE
ROA ROA
Liquidity I. Liquidity I.
Liquidity II. Liquidity II.
Liquidity III. Liquidity III.
Liabilities Turnover Liabilities Turnover
Internal Financing Rate Internal Financing Rate
Outstandings Turnover Outstandings Turnover
Stocks Turnover Stocks Turnover
Capital Ratio Capital Ratio
Covering of Total
Fixed Assets Covering of Total Fixed Assets
BAKERY INDUSTRY
MILLING INDUSTRY 2000 BAKERY INDUSTRY MILLING INDUSTRY 2005
Liquidity II. Covering of Total
Fixed Assets Covering of Total Fixed Assets
Capital Ratio ROA
[image:6.595.71.525.574.746.2]While in 2000 the indebtedness of milling industry was higher than that of food industry including the bakery industry, in 200� the indebtedness situation is relatively balanced.
Activity ratios values of the milling industry are at a comparable level with the food industry, the Stocks Turnover is even faster, which is positive. Mills are able to pay for their liabilities faster in 200� and col-lect debts from the customers later. This confirms strengthening of the economic position of mills within the chain.
the economic position of mills according to their size
For the analysis, mills were divided into two size groups according to the number of employees – mills with less than �0 employees and mills with �0 and more employees. The results of the Spider Analysis are shown in Figures � and 8.
The Spider Aanalysis has demonstrated a better eco-nomic position of bigger mills in both analysed years, which is manifested by better financial results almost in all ratios. however, in 200� the differences between these two size groups of mills are not so distinct.
Bigger mills have reached better profitability results, which may be caused by the fact, that these mills are able to satisfy the bakery requirements relating to the supply fluency and the constant quality of flour. They have also ensured sales by big bakeries. A posi-tive factor in the big mills economics is their better technical level, which is comparable with foreign countries.
Better results in the liquidity field are influenced by the conclusion of long-term contracts (including price parameters) with the customers. This can ensure regular and certain sales and incomes.
There is another risk factor in the small mills economy (Figure �) – the deficient long-term asset coverage by the long-term capital, especially by the equity capital. A higher indebtedness of small mills
[image:7.595.66.527.364.536.2]Figure 8. The position of mills with �0 and more employees within the milling industry in 2000 and 200� Figure �. The position of mills with less than �0 employees within the milling industry in 2000 and 200�
0 25 50 75 100 125 150 175
200ROE ROS
ROI
Likvidita I.
Likvidita II.
Likvidita III. Obrátka závazkĤ
Obrátka pohledávek Obrátka zásob Krytí stálých aktiv
Kapitálový pomČr Vlastní financování
Mlýnský prĤmysl - 12/2000 - 156 - CZE Mlýny do 50 zam. - 12/2000 - 156 - CZE
0 25 50 75 100 125 150 175
200ROE ROS
ROI
Likvidita I.
Likvidita II.
Likvidita III. Obrátka závazkĤ
Obrátka pohledávek Obrátka zásob Krytí stálých aktiv
Kapitálový pomČr Vlastní financování
Mlýnský prĤmysl - 12/2005 - 156 - CZE Mlýny do 50 zam. - 12/2005 - 156 - CZE
ROA ROA
Liquidity I. Liquidity I.
Liquidity II. Liquidity II.
Liquidity III.
Liquidity III.
Liabilities Turnover Liabilities Turnover
Internal Financing Rate Internal Financing Rate
Outstandings Turnover Outstandings Turnover
Stocks Turnover Stocks Turnover
Capital Ratio Capital Ratio
Covering of Total
Fixed Assets Covering of Total
Fixed Assets
MILLING INDUSTRY
MILLS WITH LESS THAN 50 EMPLOYEES 2000 MILLING INDUSTRY MILLS WITH LESS THAN 50 EMPLOYEES 2005
Covering of Total
Fixed Assets Covering of Total
Fixed Assets
0 25 50 75 100 125 150 175
200ROE ROS
ROI
Likvidita I.
Likvidita II.
Likvidita III. Obrátka závazkĤ
Obrátka pohledávek Obrátka zásob Krytí stálých aktiv
Kapitálový pomČr Vlastní financování
Mlýnský prĤmysl - 12/2000 - 156 - CZE Mlýny nad 50 zam. - 12/2000 - 156 - CZE
0 25 50 75 100 125 150 175
200ROE ROS
ROI
Likvidita I.
Likvidita II.
Likvidita III. Obrátka závazkĤ
Obrátka pohledávek Obrátka zásob Krytí stálých aktiv
Kapitálový pomČr Vlastní financování
Mlýnský prĤmysl - 12/2005 - 156 - CZE Mlýny nad 50 zam. - 12/2005 - 156 - CZE
ROA ROA
Liquidity I. Liquidity I.
Liquidity II. Liquidity II.
Liquidity III. Liquidity III.
Liabilities Turnover Liabilities Turnover
Internal Financing Rate Internal Financing Rate
Outstandings Turnover Outstandings Turnover
Stocks Turnover Stocks Turnover
Capital Ratio Capital Ratio
Covering of Total
Fixed Assets Covering of Total Fixed Assets
MILLING INDUSTRY
MILLS WITH 50 AND MORE EMPLOYEES 2000 MILLING INDUSTRY MILLS WITH 50 AND MORE EMPLOYEES 2005
Covering of Total
is necessary for the modernisation of their techno-logical equipment.
cOnclusiOn
Based on the financial results, the comparison of the processing stages within the wheat commodity chain and the food processing industry as a whole shows the typical character of production of the fundamental products for everyday consumption, which substantially restrains the enforcement of the expansive price strategy of wheat processors. There are also further factors influencing the economic position of the analysed industries, notably the retail concentration and the market position on one hand and the relatively high corn prices supported by the state interventions on the other hand. Economic results of the evaluated industries are influenced also by the restructuring and the surplus produc-tion capacity. All these facts negatively influence the profitability of both processing stages within the wheat commodity chain.
The results of the analysis have proved worsening of the bakery economic position and the enhance-ment of the milling industry position within the commodity chain during the last time, especially as a result of the increasing market power of the retail. The concentrated retail sector and the surplus capac-ity of the bakery industry escalate the competition between firms on this stage of processing and this is reflected in the profitability ratios. Better economic results were found out in bigger bakeries. The analy-sis has also confirmed that the decisive subjects in the milling industry become bigger mills joining to the raw commodity supplier and the subsequent processing stages. it can largely eliminate the low flour price that becomes the competitive advantage by the reason that the raw commodity costs become cheaper for the subsequent processing stage within the interconnected companies.
REfEREncEs
Azzam A., Pagoulatos E. (1990): Testing oligopolistic and oligopsonistic behavior: An application to the U. S. meat packing industry. Journal of Agricultural Economics,
41: 362–3�0.
Bečvářová V. (2001): Vliv vertikální integrace na konkurenc-eschopnost zemědělství (Vertical integration impact on competitiveness of Agriculture). in: Produkčná a obchodná výkonnosť agropotravinárského komplexu. SPU, nitra, pp. 14–21; iSBn 80-�13�-9�3-�.
Bečvářová V. (200�): Podstata a ekonomické souvislosti formování agrobyznysu (Substantiality and Economic context of Agribusiness Formation). MzLU, Brno; iSBn 80-�1��-911-4.
Bečvářová V. (2008): issues of competitiveness of today’s agriculture. Agricultural Economics – czech, 54: 399– 40�.
Bečvářová V., Lechanová i. (2006): zemědělství a potravi-nářský průmysl v rámci komoditních vertikál, obecné a regionální aspekty (Agriculture and Food industry within commodity chains – general and regional Aspects). MzLU, Brno; iSBn 80-�1��-921-1..
Bhuyan S., Lopez r.A. (199�): oligopoly power in the food and tobacco industries. American Journal of Agricultural Economics, 79: 103�–1043.
Blažková i. (2002): A commodity chain and strengthen-ing of agro-food sector competitiveness. Agricultural Economics – czech, 48: 293–29�.
Blažková i. (200�): Economic position of the process-ing stage within the wheat commodity chain. roczniki naukowe – Stowarzyszenia Ekonomistów rolnictwa i Agrobiznesu, iX: 2�–29; iSSn 1�08-3�3�.
Bryceson K.P. (2006): ‘E’ issues in Agribusiness: the ‘What’, ‘Why’, ‘how’. The University of Queensland, Australia; iSBn 1 84�93 0�1 1.
carlton D.W., Perloff J.M. (2000): Modern industrial or-ganization. 3rd ed. Addison Wesley Longman, inc., reading, MA.
Davis J.h., goldberg r.A. (19��): A concept of agribusi-ness. research Division, harvard Business School, Bos-ton Mass.
george K.D., Joll c., Lynk E.L. (1992): industrial organi-zation: competition, growth and Structural change. 4th ed. routledge, London.
heffernan W., hendrickson M., gronski r. (1999): con-solidation in the Food and Agriculture System. report to the national Farmers Union, 02/1999.
heffernan W.D., hendrickson M. gronski r. (1999): con-solidation in the food and agriculture system. report to the national Farmers Union, Department of rural Sociology, University of Missouri. Available at http://nfu. org/images/heffernan_1999.pdf
Kislingerová E. (200�): Manažerské finance (Managerial Fi-nances). c.h. Beck, Praha; iSBn 9�8-80-�1�9-903-0. Klein B., crawford r.g., Alchian A.A. (19�8): Vertical
integration, appropriable rents, and the competitive contracting process. Journal of Law and Economics,
27: 29�–326.
Martin S. (1993): Advanced industrial Economics. Blackwell Publishers, cambridge, MA.
Porter M.E. (1994): Konkurenční strategie (competitive Strategy). Victoria Publishing, Praha; iSBn 80-8�60�-11-2.
Sheperd W.g., Shepherd J.M. (2004): The Economics of industrial organization. �th ed. Waveland Press, Long
grove, iL.
Swinnen J.F.M. (200�): global Supply chains, Standards and the Poor. cromwell Press, Trowbridge UK; iSBn-13:9�8 1 84�93 18�8.
Williamson o.E. (19�4): The economics of antitrust: Trans-action cost considerations. University of Pennsylvania Law review, 122: 1439–1496.
Wilkinson J. (2003): Agriculture to Agribusiness. Australian government Briefing Paper 3.
ziggers g.W., Trienekens J. (1999): Quality assurance in food and agribusiness supply chains: Developing suc-cessful partnerships. international Journal of Production Economics, 60–61: 2�1–2�9. Elsevier Science B. V.
Arrived on 2�th May 2009
Contact address:
ivana Blažková, Mendel University of Brno, Faculty of regional Development and international Studies, Department of regional and Business Economics, zemědělská 1, 613 00 Brno, czech republic