Estimation of Stress Corrosion Cracking Initiation and Propagation
in High-Pressure, High-Temperature Water Environment
Utilizing Acoustic Emission
Takuma Matsuo
1,+, Keita Sano
1, Yohei Sakakibara
2and Gen Nakayama
2 1School of Science and Technology, Meiji University, Kawasaki 214-8571, Japan2IHI Corporation, Yokohama 235-8501, Japan
The stress corrosion cracking (SCC) of type 304 stainless steel during a creviced bent beam (CBB) test in a temperature, high-pressure water environment was monitored by an opticalfiber acoustic emission (AE) sensor. By examining the number and type of cracks formed by different durations of CBB testing an SCC initiation and propagation behavior model was developed. This model was then used to examine the AE event rate, which was found to agree well with the observed changes in the number and size of the cracks formed. Through analysis of the relationship between crack size and AE, the weaker AE signals were assumed to be produced by the initiation of small cracks, whereas the coalescence of cracks produces moderate and large AE signals. On the basis of thesefindings, it is concluded that the SCC propagation behavior can be reliably estimated from the event rate and amplitude of AE signals. [doi:10.2320/matertrans.M2014357]
(Received October 15, 2014; Accepted December 16, 2014; Published January 30, 2015)
Keywords: stress corrosion cracking, acoustic emission, opticalfiber sensor, high temperature, guided wave
1. Introduction
Stress corrosion cracking (SCC) induced in metals subjected to high-pressure and high-temperature water environments is one of the most serious safety problems currently faced by nuclear plants.17)The heat affected zone (HAZ) of stainless steel pipes have been reported to be particularly susceptible to SCC due to the residual tensile stress and hoop tensile stress created in their fabrication, as well as the sensitization created by the heat input of welding. However, measurement techniques suitable for these con-ditions are currently quite limited, thus creating an urgent need to better understand the initiation and propagation behavior of SCC.
The creviced bent beam (CBB) test6,7) is an accelerated laboratory test that is used to evaluate SCC initiation in high-temperature and high-pressure water environments, but does not allow for the detection of SCC initiation or propagation. This limitation, however, can potentially be addressed by using acoustic emission (AE), which is a nondestructive technique that can use elastic waves produced by the emission of strain energy to detect SCC behavior in real time. Indeed, many researchers have reported that AE signals are produced by SCC initiation and propagation,8,9)and that the event rate and amplitude these signals varies depending on the type of SCC. For example, tarnish rupture (TR)-type SCC tends to generate strong AE signals,10) intergranular-type SCC (IG-SCC) generally produces weak primary AE signals, and transgranular-type SCC produces secondary AE signals and, in some cases, the loss of individual grains.8)Monitoring these signals in high-temperature and high-pressure water environ-ments, however, is made difficult by the low Curie temperature of the lead zirconate titanate (PZT) elements used in conven-tional AE sensors. There are some heat-resistant AE sensors currently available on the market, but these have a peak sensitivity that is lower than that of conventional AE sensors.
In order to overcome these problems, an optical fiber AE system with a high heat resistance has been developed by our group specifically for use in high-temperature environments. Using this system, it is possible to detect the AE signals generated by the fracture of thin oxide films11)and monitor SCC in carbon steel in a high-temperature, high-pressure environment;12)however, although AE signals were success-fully detected, their precise source was never identified. This study therefore proposes a SCC initiation and propagation behavior model for type 304 stainless steel, the validity of which is tested against experimental results obtained through CBB tests of different durations. An opticalfiber AE sensor is also used to monitor SCC during the CBB test to identify the precise relationship between the CBB test results and AE signals, with a view to estimating the SCC initiation rate and propagation behavior from the AE signals.
2. Experimental Setup for Monitoring AE Signals during CBB Test
2.1 Process and materials
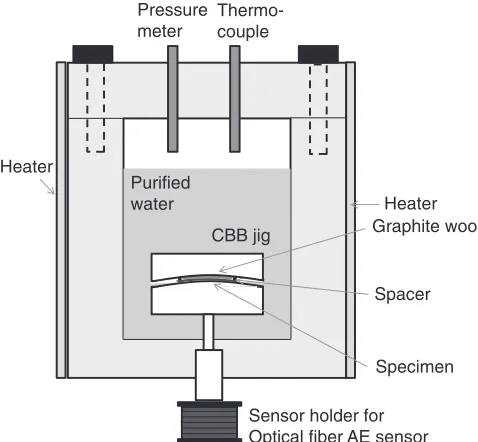
Figure 1 shows the experimental setup used for monitoring the AE signals generated by SCC initiation and propagation during CBB testing within a batch-type autoclave.12)The test specimen was fabricated from a type 304 stainless steel that was sensitized at 700°C for 2 h and at 500°C for 24 h; the chemical composition is shown in Table 1. This specimen was bent by the CBB jig to a strain of 1%, with graphitefiber wool and a type 316 stainless steel spacer being used to preserve the crevice. The cylinder-type holder for the optical fiber AE sensor9)and CBB jig were connected with a wave guide, and after injecting highly purified water into the autoclave, the temperature was raised to 240°C under a pressure of 4.0 MPa. As the water was in equilibrium with the atmosphere approximately 8 ppm of oxygen is likely to have dissolved prior to testing, with no deaeration by nitrogen gas being performed in the autoclave. To evaluate the size and number of cracks generated in detail, several CBB tests were
+Corresponding author, E-mail: matsuo@meiji.ac.jp
performed with different durations without AE monitoring (Test 1, 2, 3, and 4). Next, the AE signals were monitored in two different tests with durations of 294 ks (Test 5) and 604 ks (Test 6), in which the temperature in the autoclave reached 240°C within 15 ks of the start of heating.
2.2 AE monitoring
The AE monitoring system used in this study is shown in Fig. 2, and consisted of an optical fiber AE sensor (a homodyne Mach-Zender interferometer with a feedback circuit) that was combined with a digitizer to store the AE signals obtained. Laser light was introduced into the single-mode opticalfiber, where it was then split between the sensor fiber and reference fiber. The sensor fiber was wound over the sensor holder and fixed with a metallic band, and was maintained at almost the same temperature as the autoclave.
The reference fiber, on the other hand, was wound over the cylinder of the PZT actuator. The resonant frequency of the sensor holder used in this study was about 42.1 kHz.13)The laser light transmitted through the twofibers was combined by a fiber coupler, which allowed changes in the laser intensity due to interference to be detected by photodiodes. A low-frequency component (<20 kHz) was used as a feedback signal to maintain the phase of the laser in the reference fiber, while a feedback signal generated in the feedback circuit was fed to the PZT actuator to maintain a high sensitivity. The high-frequency components of the detected signal were fed to the digitizer through a 40 dB pre-amplifier, and then filtered (20 kHz high-pass) in the frequency domain. This filtered signal was split into a AE signal and trigger signal, the latter being passed through a 50 kHz low-pass filter. When the amplitude of this filtered trigger signal was over the threshold, the signal was stored as the AE signal.
3. Comparison of SCC Propagation Model and CBB Test Results
Crack initiation and propagation behavior were described in this study using Akashi’s model6)and the CBB test results for type 304 stainless steel obtained after different durations. As depicted in Fig. 3, this begins with small cracks initiating at the edge of a pit on the surface of the specimen (Fig. 3 (1)), which then propagate and coalesce to become a long crack (Fig. 3 (2)). These long cracks then propagate (Fig. 3 (3)) and coalesce again (Fig. 3 (4)).
Figure 4 shows the surface of the specimen after CBB Test 5 (294 ks duration), in which some 60 cracks were detected near the center of the specimen. Plotting the relationship between the test duration and the number of cracks (Fig. 5) revealed that although there is an initial increase in the number of cracks up to 33 ks, their number decreases between 33 and 155 ks. Meanwhile, beyond 155 ks, the number of cracks increases again. Clearly, this relation-ship is complicated, and so in order to understand it better the cracks were classified into two groups on the basis of their size: short cracks with lengths less than 100 µm and long cracks with higher lengths. Note that a value of 100 µm was defined here by using the average length of thefive longest cracks produced by the shortest CBB test. The frequency of all cracks in these two groups is shown in Fig. 6, in which it
Thermo-couple Pressure meter
CBB jig Purified
water
Specimen Spacer Graphite wool
Sensor holder for Optical fiber AE sensor
Heater Heater
[image:2.595.49.288.71.292.2]Fig. 1 Experimental setup for monitoring AE signals with an opticalfiber AE sensor during CBB testing.
Table 1 Chemical composition of type 304 stainless steel.
Elements C Si Mn P S Ni Cr
SUS304 0.05 0.46 0.83 0.30 0.04 8.09 18.18
00.80
Feedback system Laser Diode
Isolator
1X2 Fiber Splitter
PZT actuator
Reference Fiber
Digitizer
Photo Diode Sensor Fiber
Differential amplifier and band-pass filter
AE signals
2X2 Fiber Coupler Polarization
Controller
Sensor holder for optical fiber sensor
Feedback signal
Trigger signal (50 kHz Low-pass)
[image:2.595.44.291.357.387.2] [image:2.595.107.495.628.769.2]can be seen that the frequency of short cracks decreases with increasing duration before 100 ks, increases from 100 ks to 155 ks, and then decreases again after 155 ks. Based on the results in Fig. 5 and Fig. 6, the test duration was divided into four periods reflecting the different stages in the proposed model shown in Fig. 3.
In Period A, there is an increase in the number of cracks that is assumed to be caused by crack initiation (Fig. 3 (1)); but as the frequency of small cracks decreases, the coalescence of cracks (Fig. 3 (2)) is also assumed to have started. In Period B, there is a decrease in the total number of cracks and frequency of small cracks, and so it is assumed that the coalescence of small cracks into long cracks actively occurs. Moreover, although there is a decrease in the activity
of crack initiation due to small cracks already being generated in most pits, the generation of new corrosion pits means that it is not stopped entirely. In Period C, there is a decrease in both the number of cracks and the frequency of long cracks that presumably comes from a reduced rate of coalescence due to the increasing distance between cracks that are not already connected. Consequently, it is assumed that this is the point at which cracks again start to propagate individually (Fig. 3 (3)). Figure 7 shows the change in the maximum crack size, with the white circles indicating the maximum crack size, and the black circles indicating the average length of the five longest cracks. We can see from this that the average propagation rate becomes small after Period C, which clearly indicates that the coalescence of long
(1) Crack initiation (Small cracks)
(2) Coalescence of cracks (Moderate cracks)
(4) Coalescence of moderate cracks (Large cracks) (3) Individual Crack growth
Fig. 3 Model of the initiation and propagation of SCC.
[image:3.595.133.462.70.246.2] [image:3.595.115.482.284.577.2]cracks is quite low. However, the fact that the largest of these five cracks kept propagating suggests that the propagation was not changed, but rather was confined to just the one main crack. Finally, in Period D, there is an increase in both the number of cracks and the length of the longest cracks, but the fraction of long cracks does not increase. It is therefore assumed that this period involves both the coalescence of large cracks (Fig. 3 (4)) and the initiation of new cracks. Although the CBB test results can be explained by the proposed model only the one specimen was used for each test duration, and so the dispersion of the results is not considered. Moreover, there were was an insufficient number of specimens to obtain an accurate period division. Thus, many more tests exploring different conditions are needed to explain the SCC process in greater detail.
4. Estimation of SCC Initiation Rate and Propagation Behavior by AE Monitoring
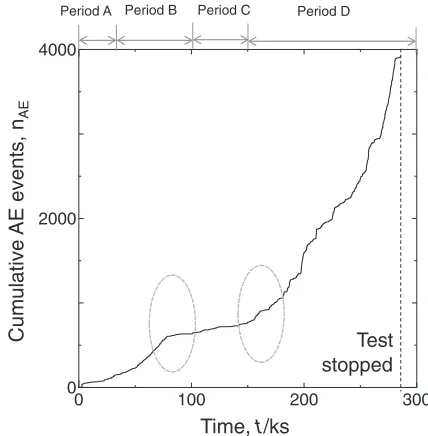
The cumulative number of AE events observed during CBB testing was next compared with the CBB test results
themselves. In the case of Test 5 (Fig. 8), a total of 5277 AE events were detected; but once the environmental and electrical noise was removed using the waveform shape and peak frequency of the signals, this was reduced to a total of 3872 AE events. These AE signals, however, could not have been solely produced by SCC, as AE signals were detected at the very beginning of the test. The dotted circle at around 79 ks indicates a point at which there was a clear decrease in the AE event rate clearly, while the solid circle marks a rapid increase in the event rate that occurred around 157 ks. The top of Fig. 8 lists the periods estimated from the CBB test results, and clearly shows that the AE event rate decreased during Period C. Figure 9 shows the maximum amplitude of the AE signals as a function of test duration. Note that thefirst 10 ks has been disregarded due to the noise generated by the heating in bringing the temperature up to 240°C, thus making it difficult to detect when SCC wasfirst initiated. Nevertheless, it can be seen that the maximum amplitude of the AE signals decreased to about 12 mV
peak-0 200 400 600
0 20 40 60 80
Period APeriod B Period D
Duration, TD/ks
T
o
tal number of cracks,
nc
Period C
Fig. 5 Total number of cracks produced by CBB tests of different durations.
0 200 400 600
25 50 75
Frequency (%)
Short cracks (<100 µm)
Long cracks (>100 µm)
Period APeriod B
Period D Period C
Duration, TD/ks
Fig. 6 Frequency of short or long cracks produced by CBB tests of different durations.
0 200 400 600
100 200 300 400
Maximum
Average of five longest cracks
Crack length,
L
/
µ
m
Duration, TD/ks
Period A Period B
Period D Period C
Fig. 7 Change in the maximum crack length and the average length of the five longest cracks.
0 100 200 300
0 2000 4000
Time, t/ks
Cumulative
AE events, n
AE
Test stopped
Period A Period B Period C Period D
[image:4.595.63.281.72.253.2] [image:4.595.321.530.73.248.2] [image:4.595.318.532.296.514.2] [image:4.595.63.280.305.482.2]to-peak (mVpp; weak AE) after 79 ks from a maximum of about 25 mVpp (moderate AE). These weak AE signals proved difficult to extract from the background noise, but the moderate AE signals could be clearly detected as burst-type AE signals. Meanwhile, AE signals with amplitudes higher than 25 mVpp (strong AE) and produced by the emission of large strain energies can be seen after 157 ks. These strong AE signals were also detected as a burst, and may indicate the arrival time of a primary wave.
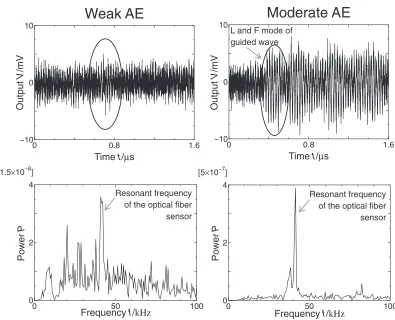
Figure 10 shows examples of weak (left, event count 1990) and moderate (right, event count 1981) AE signals along with their respective frequency spectra. Note that
longitudinal and flexural (L and F) modes10,14) typical of guided wave propagation can be observed in the left waveform, whereas this is not the case with the weak AE signals due to the S/N ratio of their waveform. However, the peak frequency of the weak AE signal spectrum was the same as the resonant frequency of optical fiber sensor, suggesting that these signals originate from the specimen and are transmitted through the waveguide.
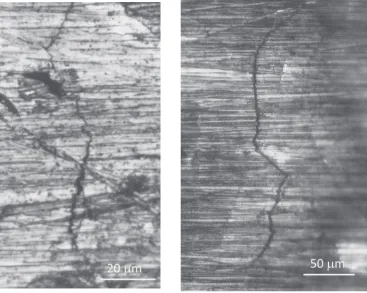
Since the strain energy produced by a given crack-opening speed depends on the size of the crack,15) weak AE signals are most likely produced by low strain energy phenomenon such as crack initiation and the propagation of individual cracks. The moderate and strong AE signals, on the other hand, are more likely to be produced by the high strain energy coalescence of cracks. According to the model shown in Fig. 3, the propagation of individual cracks occurred in Period C, whereas the coalescence of cracks occurred in Period B and D, which is consistent with the AE amplitude distribution. In Fig. 11, we see that CBB Test 3 produced a large crack in close proximity to another crack, and so it stands to reason that a strong AE signal would be produced when these two cracks connect. Thus, it is assumed that the large AE signals in Fig. 9 are produced by the coalescence of large cracks very much like those in Fig. 11.
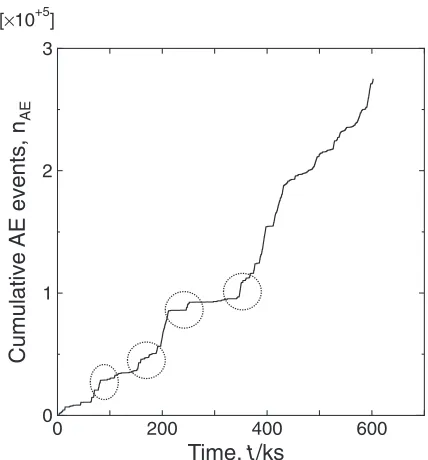
Figure 12 shows the cumulative number of AE events recorded during CBB Test 6, which differ from Test 5 in that the system was calibrated. Note that despite this difference the AE generation rate displayed a similar trend, which indicates that the changes observed in the AE event rate are indeed reproducible. Furthermore, since the AE event rate
0 100 200 300
0 50 100
Weak AE Moderate AE Strong AE
Period A Period B Period C Period D
Test stopped Including Noise
from heater
Time, t/ks
Maximum AE
amplitude,
Vmax
/mV
Fig. 9 Distribution of the maximum amplitude of the AE signals produced during a 294 ks CBB test (Test 5).
0 50 100
0 2 4 [1.5×10⁻⁸]
Frequency f/kHz
Power
P
Resonant frequency of the optical fiber sensor
0 0.8 1.6
−10 0 10
Time t/µs
Output
V
/mV
Weak AE
0 0.8 1.6
−10 0 10
Moderate AE
Time t/µs
Output
V
/mV
0 50 100
0 2 4 [5×10⁻⁷]
Frequency f/kHz
Power
P
Resonant frequency of the optical fiber sensor L and F mode of
[image:5.595.49.289.71.240.2]guided wave
[image:5.595.101.496.452.772.2]once again decreased near 200 ks and increased at about 330 ks, it can be concluded that the source of these AE signals (presumably SCC) has both active and inactive periods that repeat as the cracks propagate. The significance of this is that it means the crack propagation behavior can be evaluated from the change in AE event rate and amplitude.
5. Conclusion
Through examination of the relationship between the acoustic emission (AE) signals produced during creviced bent beam (CBB) tests and the initiation and propagation behavior of stress corrosion cracking (SCC) in a high-temperature, high-pressure environment, the following con-clusions have been made:
(1) The SCC of type 304 stainless steel can be modeled by dividing the initiation and propagation behavior into four distinct periods based on changes in the number of cracks and crack size over time.
(2) Both the AE event rate and amplitude change simulta-neously during CBB testing, and the changes in the AE event rate correspond well to the four periods of SCC from the CBB test results.
(3) Weak-amplitude AE signals are produced by the propagation of individual cracks, whereas moderate and strong AE signals are produced by the coalescence of cracks. Given this, the crack propagation behavior can be monitored using the AE event rate and the amplitude of the AE signals.
REFERENCES
1) G. Nakayama and Y. Sakakibara:ECS Trans.50(2013) 303311.
2) P. L. Andresen and M. M. Morra:J. Nucl. Mater.383(2008) 79111.
3) R. M. Horn, G. M. Gordon, F. P. Ford and R. L. Cowan:Nucl. Eng. Des.174(1997) 313325.
4) O. Wachter and G. Brummer:Nucl. Eng. Des.168(1997) 3552.
5) P. L. Andresen:Corrosion69(2013) 10241037.
6) M. Akashi: Localized Corrosion, Current Japanese Materials Research,4(Elsevier, 1988) pp. 175196.
7) M. Nono, T. Nakajima, M. Iwama, R. Kasada and A. Kimura:J. Nucl. Mater.417(2011) 878882.
8) A. Yonezu, H. Cho and M. Takemoto:Meas. Sci. Technol.17(2006) 24472454.
9) M. Shiwa, H. Yamawaki, H. Masada, K. Ito and M. Enoki: Strength Frac. Complex.5(2009) 109116.
10) F. Uchida, H. Nishino, M. Takemoto and K. Ono: J. Acoust. Emiss.19
(2001) 7584.
11) T. Matsuo, H. Cho and M. Takemoto:Sci. Technol. Adv. Mater.7
(2006) 104110.
12) T. Matsuo, T. Konno, H. Cho, Y. Sakakibara, K. Kurebayashi and G. Nakayama:Corros. Eng.62(2013) 376381.
13) T. Matsuo, H. Cho and M. Takemoto: J. Acoust. Emiss.24(2006) 84 96.
14) J. L. Rose:Ultrasonic Waves in Solid Media, (Cambridge University Press, Cambridge, 1999) pp. 143153.
15) T. Kishi, M. Ohtsu and S. Yuyama: Acoustic Emission beyond the Millennium, (Elsevier Science, Amsterdam, 2000).
[image:6.595.55.283.69.240.2]Crack
Fig. 11 Photograph showing the surface of a sample after a 604 ks CBB test (Test 6).
0 200 400 600
0 1 2 3 [×10+5]
Time, t
/ks
Cumulative
AE events, n
AE
[image:6.595.63.277.284.514.2]