warwick.ac.uk/lib-publications
Original citation:
Walker, Liam, Boddington, Clare, Jenkins, Dafyd J., Wang, Ying, Gronlund, Jesper T.,
Hulsmans, J., Kumar, Sanjeev, Patel, Dhaval, Moore, Jonathan D., Carter, Anthony,
Samavedam, Siva, Bonomo, G., Hersh, D. S., Coruzzi, G. M., Burroughs, Nigel John and
Gifford, Miriam L.. (2017) Changes in gene expression in space and time orchestrate
environmentally mediated shaping of root architecture. The Plant Cell, 29 (10). pp.
2393-2412.
Permanent WRAP URL:
http://wrap.warwick.ac.uk/91500
Copyright and reuse:
The Warwick Research Archive Portal (WRAP) makes this work of researchers of the
University of Warwick available open access under the following conditions.
This article is made available under the Creative Commons Attribution 4.0 International
license (CC BY 4.0) and may be reused according to the conditions of the license. For more
details see:
http://creativecommons.org/licenses/by/4.0/
A note on versions:
The version presented in WRAP is the published version, or, version of record, and may be
cited as it appears here.
LARGE-SCALE BIOLOGY ARTICLE
Changes in Gene Expression in Space and Time Orchestrate
Environmentally Mediated Shaping of Root Architecture
CC-BYLiam Walker,
a,1Clare Boddington,
b,1,2Dafyd Jenkins,
a,b,1,3Ying Wang,
b,1Jesper T. Grønlund,
a,4,5Jo Hulsmans,
a,b,4Sanjeev Kumar,
a,4Dhaval Patel,
a,4,6Jonathan D. Moore,
b,4,7Anthony Carter,
a,b,4Siva Samavedam,
a,8Giovanni Bonomo,
c,8,9David S. Hersh,
c,8,10Gloria M. Coruzzi,
cNigel J. Burroughs,
b,dand Miriam L. Gifford
a,11aSchool of Life Sciences, University of Warwick, Coventry CV4 7AL, United Kingdom
bWarwick Systems Biology Centre, University of Warwick, Senate House, Coventry CV4 7AL, United Kingdom cCenter for Genomics and Systems Biology, Department of Biology, New York University, New York, New York 10003
dWarwick Mathematics Institute, University of Warwick, Zeeman Building, University of Warwick, Coventry CV4 7AL, United Kingdom
ORCID IDs: 0000-0003-0261-0518 (L.W.); 0000-0003-0875-1936 (J.H.); 0000-0002-3561-8180 (S.K.); 0000-0002-2099-0596 (D.P.); 0000-0002-5486-0407 (J.D.M.); 0000-0003-2608-2166 (G.M.C.); 0000-0002-4005-2513 (M.L.G.)
Shaping of root architecture is a quintessential developmental response that involves the concerted action of many different cell types, is highly dynamic, and underpins root plasticity. To determine to what extent the environmental regulation of lateral root development is a product of cell-type preferential activities, we tracked transcriptomic responses to two different treatments that both change root development inArabidopsis thalianaat an unprecedented level of temporal detail. We found that individual transcripts are expressed with a very high degree of temporal and spatial specificity, yet biological processes are commonly regulated, in a mechanism we term response nonredundancy. Using causative gene network inference to compare the genes regulated in different cell types and during responses to nitrogen and a biotic interaction, we found that common transcriptional modules often regulate the same gene families but control different individual members of these families, specific to response and cell type. This reinforces that the activity of a gene cannot be defined simply as molecular function; rather, it is a consequence of spatial location, expression timing, and environmental responsiveness.
INTRODUCTION
As sessile organisms, plants are highly responsive to the envi-ronment, at both the molecular and phenotypic levels. A facet of multicellularity is that it enables organisms to have the scope for
differentiation between different cell types and within a cell type as it develops. To maintain compartmentalization of specialized functions, different cell types maintain distinct transcriptional programs. This discovery was facilitated by the use offl uores-cence-activated cell sorting (FACS), which enables isolation and analysis of endogenous responses in specialized cell types (Birnbaum et al., 2003, 2005; Brady et al., 2007). Cell-type spe-cialization manifests not only in the development of different cell type functions, but also in how different cell types respond to their environment. For example, lateral root organogenesis is initiated specifically in the pericycle cell type through a program of asym-metric, anticlinal cell division and is a root developmental process that is highly responsive to environmental change (Malamy and Benfey, 1997). This enables the architecture of the root to be tuned to particular environments or remodeled over time, a manifestation of plant plasticity. In response to nitrogen influx, a vast array of changes occurs at the molecular level in plants, and these changes influence root development. However, it is unclear how short-term and long-term changes are linked temporally. Furthermore, al-though many environmental factors affect root development, we do not know the extent to which lateral root development regulation in different environments is controlled by the same genes.
FACS-based approaches to cell-type-specific profiling have pre-viously been used to study a range of processes and environmental responses in the root. Previous studies have addressed the responses of distinct root layers to stresses, including salinity (Dinneny et al., 2008; Geng et al., 2013), low pH, and sulfur (Iyer-Pascuzzi et al., 2011). 1These authors contributed equally to this work.
2Current address: CTSU, Richard Doll Building, Old Road Campus,
Roosevelt Drive, Oxford OX3 7LF, UK.
3Current address: Research and Development, Tata Steel, University of
Warwick Science Park, Coventry CV4 7EZ, UK.
4These authors contributed equally to this work.
5Current address: British American Tobacco (Investments), R&D Plant
Biotechnology Division, 210 Cambridge Science Park, Cambridge CB4 0WA, UK.
6Current address: Azotic Technologies, BioCity, Nottingham NG1 1GF, UK. 7Current address: The Earlham Institute, Norwich Research Park,
Norwich NR4 7UH, UK.
8These authors contributed equally to this work.
9Current address: Penn State Milton S. Hershey Medical Center, Division
of Colon and Rectal Surgery, 500 University Drive, P.O. Box 850, Hershey, PA 17033.
10Current address: 22 S Greene St., Suite 12D, Department of Neurosurgery,
University of Maryland School of Medicine, Baltimore, MD 21201.
11Address correspondence to [email protected].
The author responsible for distribution of materials integral to thefindings presented in this article in accordance with the policy described in the Instructions for Authors (www.plantcell.org) is: Miriam L. Gifford (miriam. [email protected]).
CC-BYArticle free via Creative Commons CC-BY 4.0 license.
FACS has also been used to quantify endogenous auxin levels at the tissue-specific level (Petersson et al., 2009) and to identify auxin-responsive genes (Bargmann et al., 2013). Other studies have employed FACS to isolate cells of the root quiescent center (Nawy et al., 2005) and generate metabolic profiles of distinct root cell types (Moussaieff et al., 2013).
Complementary to spatial analysis of responses is the dis-section at a temporal level. Collection of sequential time points of transcriptomic data enables the use of network inference methods to reconstruct causative gene networks (Krouk et al., 2010; Windram et al., 2012; Lewis et al., 2015). Using network inference methods, it is thus possible to make predictions of regulatory interactions and how these interactions are influenced by different treatments or under different conditions (Hecker et al., 2009; Krouk et al., 2010; Emmert-Streib et al., 2012). Furthermore, networks can identify control hubs and enable prediction of the effect of genetic perturbations (Krouk et al., 2010, 2013). In the case of root environmental responses, nitrogen responses have been studied at the whole root level over thefirst minutes of nitrate influx (Krouk et al., 2010) at 2 h in isolated root cell types (Gifford et al., 2008) and at the phenotypic level to look at longer-term effects of nitrogen on root development (Gifford et al., 2013). A number of previous network inference studies have inves-tigated the response ofArabidopsis thalianato nitrogen and have helped to identify major nitrogen-responsive sensors and hubs. The best understood of these is the nitrate transporter/ sensor NRT1.1 which also plays a key role in signal trans-duction during nitrogen responses (Ho et al., 2009). During the early nitrate response,NRT1.1is responsible for the activation of numerous genes involved in nitrate assimilation. There is also strong evidence thatNRT1.1represses lateral root branching in response to depleted nitrate levels by diverting accumulating auxin from lateral root primordia (Bouguyon et al., 2015). Two bZIP family transcription factors that are downstream of
NRT1.1,TGA1andTGA4, have been demonstrated to regulate expression of the nitrate transportersNRT2.1andNRT2.2(Alvarez et al., 2014). It has also been shown that the key circadian clock geneCCA1is regulated by organic nitrogen signaling and in turn regulates genes involved in nitrogen assimilation itself (Gutiérrez et al., 2008).
However, each of these studies captures a specific snapshot of nitrogen responsiveness and is insufficient for reconstruction of the temporal link between molecular and developmental responses. In order to address this important question, we tracked gene expression responses in roots over a 48-h time series in Arabidopsis. This allowed us to compare temporal changes in the pericycle to those in the cortex, which has po-tential for postdifferentiation development (e.g., nodule devel-opment in leguminous species), but does not divide during lateral root development. We used two environmental pertur-bations (replete nitrate and rhizobia) that each affect lateral root development and asked to what extent similar changes in gene expression are involved in similar developmental responses. This unique high-resolution time series analysis enabled an investigation of the links between molecular and developmental dynamic behaviors. Our data suggest that the responsiveness of different cell types to the environment is a fundamental func-tional aspect of a multicellular system such as the root.
RESULTS
Cell-Type Profiling of Arabidopsis Roots Reveals Dynamic Gene Expression over Time
To characterize the transcriptional changes that underlie changes in lateral root development in response to environmental changes, we subjected Arabidopsis root cell-type-specific GFP marker lines to tissue-specific transcriptional analysis after either treat-ment with nitrogen, inoculation with rhizobia, or no treattreat-ment (as a baseline). To investigate transcriptional changes underlying or preceding developmental regulation, we analyzed the pericycle cells using a GFP marker specific to xylem pole pericycle cells from where lateral root primordia originate via reactivation of cell di-vision in differentiated cells (Gifford et al., 2008). We also analyzed a GFP marker line specific to cortical cells (Brady et al., 2007), since this is a more outer cell type in the root, providing the op-portunity to examine spatial variation in responses across root cell types. A time series of sampling was performed over a 48-h growth period starting at dawn (= time point 0) on day 9 postgermination, using protoplast generation and FACS (Gifford et al., 2008) (Figures 1A to 1E), and the whole experiment was performed in at least biological triplicate. Each biological replicate sample (for each time point in each time series and cell type) consisted of total mRNA isolated from ;10,000 FACS-isolated cells from pooled harvested roots from ;200 GFP-expressing seedlings grown on the same plate. Each (destructive) sample was con-sidered as an independent replicate within subsequent gene expression and network inference analysis (see Methods).
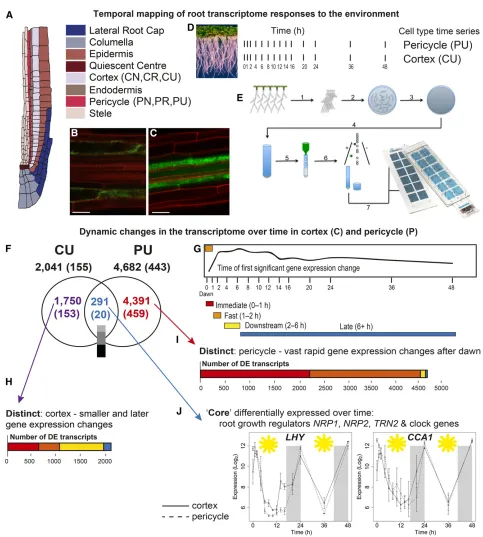
Figure 1. Time-Series Profiling of Gene Expression within Isolated Cortical and Pericycle Cells Reveals Dynamic and Cell-Type Distinct Transcriptomes.
(A)Schematic of an Arabidopsis root tip, illustrating different cell types.
(B)and(C)Confocal microscopy images of the cortex-specific cell lineProCo2:YFPH2B(Heidstra et al., 2004).(B)and the pericycle-specific line E3754
(Gifford et al., 2008)(C)used in experiments. Bars = 25mm. (D)Illustration of time series harvested for each cell type.
responders, with 49% being fast, 2% being downstream, and 1% being late (Figure 1I; Supplemental Figure 1F). For each time series’clusters, there were a wide range of differential expression patterns. These include transcripts whose expression increases over time (e.g., fast upregulated cluster CU62; Supplemental Data Set 2), decreases over time (e.g., pericycle immediate down-regulated cluster PU37; Supplemental Data Set 2), as well as transcripts that cycle over time (e.g., putative circadian clusters CU37 and PU64; Supplemental Data Set 2). Clustering also delineates transcripts with the same expression timing but dif-ferent expression amplitude (e.g., cortex immediate upregulated clusters CU47 and CU50 or pericycle immediate upregulated clusters PU87 and PU88; Supplemental Data Set 2). Overall then, the pericycle appears to have more frequent and earlier (in the day) perturbations in gene expression, potentially reflecting the fact that the pericycle is comprised of cells at a wide range of mitotic activities (Malamy and Benfey, 1997).
A Differentially Expressed Core of Genes Coordinates Changes in Cortex and Pericycle
Despite the large numbers of DE transcripts in the cortex and pericycle, there is a very high degree of cell specificity with only 291“core”transcripts (transcripts that are DE in both cell types) differentially expressed (as a function of time) in both of the cell types (Figure 1F). The expression responses of the core tran-scripts reflect well the range of patterns of all transcripts that are differentially expressed in cells; despite accounting for only 14% (cortex) and 6% (pericycle) of the DE genes, these core 291 tran-scripts were present in 63% of the clusters. A similar percentage of clusters were reflected from each cell type, invariant of cluster size and including clusters in all four response timing groups. This indicates that this core of DE transcripts is part of a wide range of responses across time in both cell types and could thus act to coordinate the function of these cell types in the context of the whole root, including housekeeping processes such as primary metabolism.
Among these 291 core dynamic transcripts, the Gene Ontology (GO) term“circadian rhythm”was overrepresented (P < 9.15E-4), includingfive previously characterized core circadian clock genes (Hsu and Harmer, 2014).LHY(LATE ELONGATED HYPOCOTYL),
CCA1(CIRCADIAN CLOCK-ASSOCIATED1),PRR5 ( PSEUDO-RESPONSE REGULATOR5),PRR9, andEARLY FLOWERING4
are found to be expressed in accordance with their characterized dynamics and are invariant between cell types, supporting the time-series nature of our data (Supplemental Figure 2 and Supplemental Data Set 2). The core group also includes transcripts important in
a range of metabolic and cellular processes that could be con-sidered to be important for root function, independent of cell type (Supplemental Data Set 2). For example, the nucleosome assembly proteinNRP1(NAP1-RELATED PROTEIN1), together withNRP2, has already been shown to be critical for cell cycle regulation in roots (Zhu et al., 2006).TET1/TRN2(TETRASPANIN1/TORNADO2), a gene that is expressed throughout the root and plays a role in determining cell fate in the root apical meristem (Wang et al., 2015) is regulated byPRR5andERF115(ETHYLENE-RESPONSIVE TRANSCRIPTION FACTOR115) (Wang et al., 2015). Consistent with this, we foundTET1andPRR5to be coregulated (fast cluster CU62 forPRR5and downstream cluster CU66 forTET1; fast cluster PU79 forPRR5and downstream cluster PU76 forTET1; Supplemental Data Set 2).
To determine if the 291 core transcripts also share the same temporal dynamics between the pericycle and cortex, we com-pared their expression using Gaussian process modeling (see Methods). We found that 40% have identical expression patterns (invariant; including clock genesCCA1andLHY; Figure 1J), 40% have an expression pattern that is similar (e.g., MICROTUBULE-ASSOCIATED PROTEIN 65-1; fast downregulated cluster CU14 and immediate downregulated cluster PU46; Supplemental Data Set 2), and only 20% have expression whose pattern varies significantly between the cortex and pericycle (e.g.,RAB GTPase HOMOLOG G1; immediate downregulated cluster CU73 and immediate activated cluster PU87; Supplemental Data Set 2). Together, this suggests that if transcripts are differentially expressed in different cell types, they are often under the same directional control. This makes sense for critical functions such as the circadian clock, whose invariant expression between cell types enables other functions to be coordinated across the root as a whole.
Reprogramming of Cell-Type Responses after Nitrogen Influx
The plant root response to nitrogen has previously been found to be highly cell type specific; however, this conclusion was made from work at a single time point after nitrogen treatment (Gifford et al., 2008). Other work has analyzed an early time series of nitrogen responses to create a functional timeline, but at the whole-root level where signals from several cell types are mixed (Krouk et al., 2010). To investigate how nitrogen responses are partitioned across a longer-term environmental exposure, we followed the same experimental design as above, but instead, immediately after the 0-h time point, seedlings were treated with replete nitrogen by transferring them to plates containing 5 mM
Figure 1.(continued).
(F)Venn diagram showing the DE transcripts within the untreated time series in the cortex (CU) and pericycle (PU); in parentheses in each case are the number of transcripts annotated as transcription factors. Most of the 291 core genes are similarly expressed between the cortex and pericycle; the color bar indicates the degree of differential expression (measured by GP2S); light gray = invariant, mid-gray = no evidence either way, and dark gray = variant.
(G)to(I)The spread of cortical(H)and pericycle(I)DE transcripts within each response time category; immediate, fast, downstream, or late ([G]; rep-resentative fast change CU57) reveal that a particularly large proportion of the pericycle transcriptome is rapidly regulated.
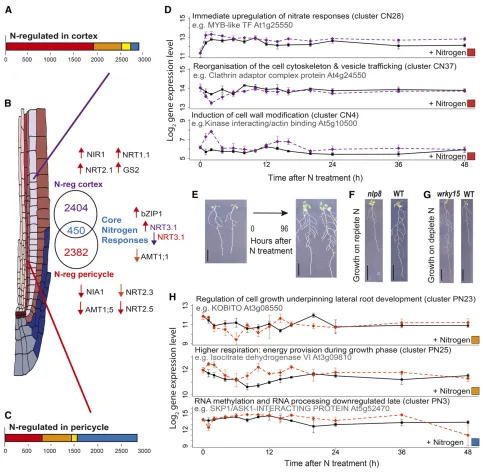
NH4NO3. In this case, we used a Gaussian process method (GP2S) to determine which of the dynamic transcripts change upon N treatment relative to the untreated time series. We again found a very high level of cell type preference in the N response, with 2404 transcripts N-regulated only in the cortex (CN), 2382 transcripts N-regulated only in the pericycle (PN), and 450 transcripts (only 16% of total) N-regulated in both cell types (Figures 2A to 2C). All differentially expressed transcripts were clustered using SplineCluster, generating 42 clusters for CN and 29 for PN (Supplemental Figure 3).
Supporting the effect of our N treatment, we detected many N-response markers (Canales et al., 2014) in our data (13 only in cortex, 7 only in pericycle and 11 in both [core]; Supplemental Data Set 2). These N-response markers are typically found in whole roots; thus, their cell-type responses here suggest that they are strongly regulated in those cell types. Many of these transcripts are in clusters PU6/PU11 and CU14 (Supplemental Data Set 2), suggesting that these represent N-responsive modules. By an-alyzing the expression regulation of key components of nitrogen uptake (nitrogen and ammonia transporters) and metabolism (primary nitrogen metabolism), it is possible to analyze the tem-poral aspects of nitrogen uptake across the tissues (Figure 2B). Both the high-affinity nitrate transporter NRT2.1 (NITRATE TRANSPORTER2.1) and the dual-affinity nitrate transporter
NRT1.1as well as nitrate reductase activity (NIR1) are immediately upregulated specifically in the cortex (Figure 2B). The rapid upregu-lation ofNRT2.1in the cortex (cluster CN3, immediate; Supplemental Data Set 2) corroborates previous expression data (Feng et al., 2011) and is consistent with the role ofNRT2.1in signaling rescue from N starvation, preparing the plant to start absorbing N again (Yong et al., 2010). At the same time (“immediate”), nitrite reductase (NIA1) and other nitrogen transporters (NRT2.3andNRT2.5) are downregulated in the pericycle, suggesting a tissue-specific effect. Ammonium transport (viaAMT1;1) appears to be downregulated in both tissue types. Nitrogen signaling via the key N-responsive hubbZIP1
(Obertello et al., 2010) is immediately upregulated in both cortex and pericycle. Other N-responsive regulators that we found include the GARP transcription factorHRS1, which integrates N and P signaling in the root and is N-induced late in the pericycle (cluster PN8; Supplemental Data Set 2) (Medici et al., 2015).
SAG21(SENESCENCE-ASSOCIATED GENE21), a regulator of both primary and lateral root development as well as biotic re-sponses (Salleh et al., 2012), is downregulated in the pericycle late after N treatment (cluster PN11; Supplemental Data Set 2). Another line of support that the N responses we see are physi-ologically relevant and related to molecular changes that precede regulation of lateral root development comes from the presence of a NIN1-like putative transcription factor,NLP8, among the core N responses (clusters CN6 and PN11; Supplemental Data Set 2). NIN is a critical regulator that coordinates cell-type re-sponses during nodulation in the legumeMedicago truncatula
(Vernié et al., 2015).NLP8has recently been found to regulate N-responsive seed germination (Yan et al., 2016). We analyzed T-DNA lines and found that anlp8homozygous loss of ex-pression knockout mutant (nlp8-2as named in Yan et al., 2016) has a shorter primary root and fewer lateral roots on replete levels of nitrate (Figure 2F; Supplemental Data Set 3) but not on depleted levels of nitrate. This is consistent withfindings by Yan
et al. (2016) who did not analyze root development but did observe N-dependent effects on germination.
Cell-Type Preferential Nitrogen Responses Coordinate Nitrate Influx with Induction of Lateral Root Development and Remodeling of the Root
Our temporal data uncovered the rapid speed with which the Arabidopsis transcriptome responds to a new environment. By examining the cell type preferential N response at the gene and process level (GO term analysis of gene clusters), we can de-termine the extent to which compartmentalization in different cell types underlies regulation of lateral root development (Figures 2D and 2H). Within the pericycle, WRKY75, a gene that has previously been shown to affect lateral root numbers (Devaiah and Raghothama, 2007), is strongly and immediately upregulated after nitrogen treatment (cluster PN6; Supplemental Data Set 2). Next, there is N repression of genes regulating “multidimensional cell growth”(fast cluster PN23, P = 1.22E-4; Supplemental Data Sets 2 and 4). A combination of processes are regulated relating to modification of the cell wall during lateral root primordial develop-ment, including genes involved in cytoskeleton reorganization, cell elongation, and cell wall biogenesis (e.g., KOBITO, Actin-1, ATFUT5, CESA1, and Profilin-1; all cluster PN23; Supplemental Data Set 2), which can all be directly related to lateral root development (Vilches-Barro and Maizel, 2015) (Figure 2H). Genes involved in “cellular respiration”(cluster PN25, P = 1.49E-8; Supplemental Data Sets 2 and 4) are induced early by N (at 2 h) and again at 16 h, in a diurnal fashion. This could provide energy during the lateral root growth phase. Late N repression of“RNA methylation”(cluster PN4, P = 2.52E-11; Supplemental Data Sets 2 and 4) could be linked to de-velopment of new lateral root primordial cells since it follows thefirst cell division in the pericycle. Also late N-induced are the auxin biosynthetic genes YUC3 (YUCCA3; PN15; Supplemental Data Set 2) and YUC7 (PN18; Supplemental Data Set 2) and the N-responsive transcription factor WRKY15 (PN6; Supplemental Data Set 2). Using mutant analysis, we found that a wrky15 homozygous loss of ex-pression mutant, relative to the wild type, has a longer primary root and more lateral roots on deplete N but a similar root system on replete N (Figure 2G; Supplemental Data Set 3). This confirms that our analysis is able to identify novel functionally important regulators of N-responsive lateral root development.
Figure 2.The Nitrogen Response Is Spatially Directional and Highly Cell-Type Specific.
(A)and(C)Numbers and time response partitioning of transcripts regulated by nitrogen in the cortex(A)and pericycle(C).
(B)Euler diagram showing the numbers of genes regulated by nitrogen in the cortex (purple font), pericycle (red font), or in both (core N-responding genes, blue font). Nitrogen assimilation genes that were found to be nitrogen regulated in the cortex, pericycle, or both (core) are indicated next to the Euler diagram sections; the arrows designate direction of regulation and timing (as in Figure 1G);NRT3.1is differentially regulated in the cortex and pericycle. (D)Timeline of processes affected by nitrogen, with the log2expression of select indicative genes shown in nitrogen-treated and untreated cortical cells.
Among cortex clusters that contain an overrepresentation of transcripts involved in particular processes are immediate N responses, including upregulation of nitrate responses (cluster CN28), downregulation then recovery of cytoskeleton organization components (cluster CN37), and biphasic upregulation of cell wall modification genes (cluster CN4). Solid black line, untreated (CU); dashed purple line, N-treated (CN); see Supplemental Data Set 4 for GO overrepresentation analysis corrected P values and Supplemental Data Set 2 for cluster membership.
(E)N treatment induces lateral root development, as visible if seedlings are maintained in the treatment up to 4 d. Bar = 1 cm.
immediately N-repressed (Figure 2D); this includes“vesicle coat” processes (P = 9.67E-3; Supplemental Data Set 4) and two genes involved in microtubule binding in cluster CN37 (At3g45850 and At1g65470; Supplemental Data Set 2), suggesting a change in cell growth processes. PIN-FORMED2, an auxin efflux carrier, was found to be fast N-induced (in cluster CN36; Supplemental Data Set 2). There is also an early biphasic (1 and 14 h) induction of“cell wall modification,”overrepresented in cluster CN4 (P = 1.7E-2; Supplemental Data Sets 2 and 4), here involving N regulation of expansins (e.g., ATEXPB1; cluster CN39; Supplemental Data Set 2), together with an increase in cell adhesion processes (Figure 2D).
Network Inference Reveals How Nitrogen Responses in the Cortex and Pericycle Are Connected via Regulation of Transcription Factor Activity across Cell Types
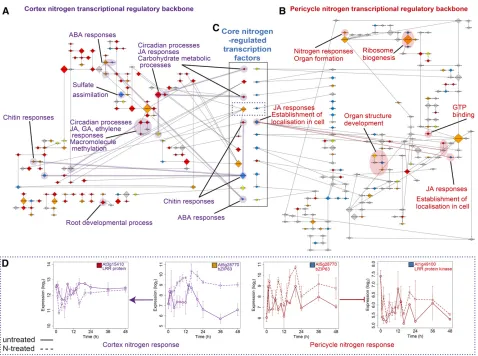
To identify candidate upstream regulators of the nitrogen and lateral root development response and understand how regu-lated processes are connected, we generated causal tran-scription networks using the Bayesian network inference tool GRENITS (Morrissey et al., 2012; Wang et al., 2014) from DE genes in each experiment. We assessed the accuracy of con-nection predictions by comparing predicted edges in all net-works with the interactions found in published data (O’Malley et al., 2016) (see Methods; Supplemental Data Set 5) and by asking if the promoters of target genes contained a binding site motif for the predicted regulatory transcription factor using a test set of edges between nodes that were common between all interaction networks in a cell type (see Methods; Supplemental Data Set 6D). On average, 43% of DE genes were connected in networks and all temporal patterns of expression were represented (see Supplemental Files 1 to 14 and Supplemental Table 1). To gain a higher-order “backbone” view of regulatory connections, we created a view of the network by forming nodes from transcription factors together with their targets (each being a“TF module”), based on the fact that one TF was predicted to regulate another TF and thus the TF module (Figure 3; Supplemental Files 7 to 14). This enabled us to query each module to ask if any functions or pro-cesses were significantly overrepresented. If a module, or con-nected modules, shared similar overrepresented GO terms, we shaded them to illustrate potential common function (Figures 3A to 3C). The cortex nitrogen regulatory backbone network contains several such sets of connected modules that are involved in similar biological processes (Figure 3A). These include abscisic acid (ABA), chitin, circadian, JA, gibberellin, and ethylene responses. Together, this suggests that a wide range of processes are controlled by
nitrogen within the cortex. There is considerable evidence linking hormone signaling to N status in the plant. For example, ABA-insensitive and -deficient mutants are less sensitive to the in-hibitory effect of high nitrate concentrations on root growth (Signora et al., 2001).
Thefinding of a decrease in expression levels in clusters of genes enriched for JA GO terms agrees withfindings that JA genes are upregulated during nutrient starvation and quickly downregulated after resupply (Armengaud et al., 2004). Most of the CN network nitrogen-regulated transcriptional regulators were in the“immediate”response class (30/45), with a similar ratio to the number of differentially expressed genes within CN (Figure 2A). Module size (number of edges) was found to be largest in the“fast”class (Supplemental Data Set 6). A test of the ranking of the fast modules when ordered by size indicates that larger modules significantly correlate with the fast cate-gory (P < 3.8E-2 using a Monte Carlo simulation for the null distribution). The largest module in the CN network with 34 targets isPIF7(fast cluster CN10; Supplemental Data Set 2), a member of a basic helix-loop-helix-type TF family that has been linked to transcriptional activation leading to a rapid growth response (Li et al., 2012).
In the pericycle, the regulatory backbone network is more sparsely connected, with some significant modules that could be related to formation of new lateral roots, including N responses, ribosome biogenesis, organ structure development, and estab-lishment of cell localization (Figure 3C). As with the CN network, we again see that the“fast”modules are the largest (P < 3.3E-3 using a Monte Carlo simulation for the null distribution). The largest reg-ulatory module in the PN network, with 77 regreg-ulatory targets, is At1g31760 (fast cluster PN5; Supplemental Data Set 2), an unknown member of theSWIB/MDM2domain superfamily of chromatin re-modeling proteins that facilitate transcription activation. The sec-ond largest module isSUVH4(fast cluster PN5; Supplemental Data Set 2), a histone methyltransferase involved in the maintenance of DNA methylation, suggesting that posttranscriptional modification could play a crucial role in the regulation of the response to nitrogen in the pericycle. SUVH4inhibits RAB HOMOLOG1(late cluster PN11; Supplemental Data Set 2), a gene involved in the general response to auxin in roots, with mutants exhibiting defective gravitropism and auxin physiology as well as fewer lateral roots (Fortunati et al., 2008).
Although some genes with the same GO terms or molecular processes are N-responsive in both the cortex and pericycle, the lack of shared regulatory links between the cortex and pericycle networks suggests that individual N-regulated transcripts and
Figure 2.(continued).
(G)Perturbation of N-regulated putative transcription factorWRKY15(cluster PN6) leads to seedlings with longer roots specifically on depleted levels of nitrogen. Bar = 1 cm. See Supplemental Data Set 3 for phenotype values andttest P values.
processes in each cell type are different. However, there are 11 N-regulated transcription factor modules that are present in both cortex and pericycle backbone networks and that thus could enable coregulation of N responses between cell types (Figure 3C). These are the transcription factors that are regulated in common and could be suggested to act as“core”nitrogen reg-ulators. A predominant cortex then pericycle timing of the N re-sponse is evident when comparing the timing of expression regulation of these genes; all but two of these 11 transcription factors are N-regulated in the cortex earlier than in the pericycle.
[image:9.603.64.542.85.441.2]Downstream of these core transcription factors, there are putative targets with the same molecular function, based on the annotation of the target genes. For example, NF-YA10 regulates F-box proteins in both cortex (At1g62270) and pericycle (At5g39450), and AtbZIP63 (At5g28770) induces a LRR protein in the cortex (At3g15410) and represses a LRR kinase in the pericycle (At1g49100) (Figure 3D; Supplemental Files 2, 5, 13, and 14). Individually observing these transcription factors regulating LRR and F-box family genes is not significant on the inferred CN/PN network (P = 0.056 for LRR and P = 0.085 for F-box;
Figure 3.Nitrogen Response Networks Are Modular in Their Cell-Type Organization, but Connected by Transcription Factor Regulation.
(A)and(B)Inferred causal transcription factor (backbone) network on CN(A)and PN(B)expression data. Node size is scaled by the outdegree of the module (number of targets) and colored according to response category: immediate (red), fast (orange), downstream (yellow), and late (blue) as in Figures 1 and 2 (see Supplemental Files 1 to 9). The edges denote that one TF regulates the other TF (and thus TF module), with regulation type (induction; arrow-headed lines or repression; bar-arrow-headed lines) shown by the arrowhead shape. Processes that are overrepresented among genes within module(s) are highlighted for each network.
(C)Transcription factors that are N-regulated in both cell types (core) have been located between the cortex and pericycle networks; within the solid box, each pair of nodes is the same transcription factor with the regulation timing and node size indicating interactions in the cortex (left) and pericycle (right). Directionality of the N response is evident in the earlier response of these in the cortex compared with the pericycle (see colors designating timing, as in Figure 1G).
(D)Targets of bZIP63, transcription factor in dotted line box section in(C). Expression profiles within time series of a transcription factor (At5g28770, bZIP63) that is core N-induced in both the cortex (fast) and pericycle (late), and predicted to regulate genes of similar function in each cell type, LRR protein At3g15410 in cortex (immediate) and LRR protein kinase At1g49100 in pericycle (late). Solid line, untreated (CU/PU); dashed line, N-treated (CN/PN); error bars indicate
permutation test). However, observing both in the CN/PN networks is significant at P = 0.0043 (permutation test).
Therefore, our time-series analysis has revealed that a combi-nation of variation in the timing, direction and location of core common responses can potentially regulate and enable cell type preferential outputs. To enable this common signaling, it is pos-sible that transcription factors move between cell types (as SHR/ SCR protein moves from the stele to the endodermis; Nakajima et al., 2001), but it is also possible that TF regulation is independent in both cell types.
Arabidopsis Biotic Responses Can Be Partitioned into Defense Responses in the Cortex, and Subsequent Developmental Responses in the Pericycle
Having discovered that the cortex and pericycle coordinate changes in response to the abiotic change of nitrogen influx, we asked whether coordination was also evident for biotic responses that alter root architecture. We analyzed Arabidopsis responses to theM. truncatula
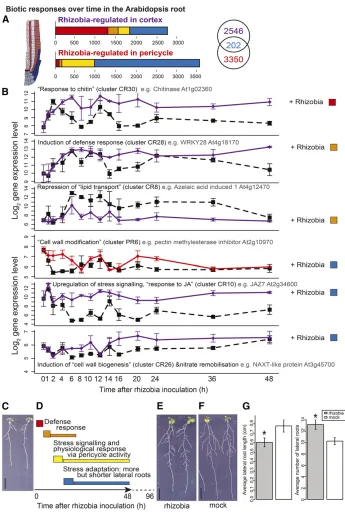
(legume) N-fixing bacterium symbiont Sinorhizobium meliloti, a biotic stress that we discovered can alter root architec-ture.S. melilotiis not a symbiont of Arabidopsis, butS. meliloti -treated seedlings have more lateral roots (P = 1.09E-2), although these are shorter (P = 1.77E-2) (Figures 4E to 4G; see data in Supplemental Data Set 3), indicating a possible stress/immunity response. We performed a time-series analysis of S. meliloti
treatment and identified 2546 transcripts that respond specifically in cortex, 3350 that respond specifically in pericycle, and 202 that respond in both cell types (Figure 4A). CR transcripts were clustered into 32 clusters and PR transcripts into 25 clusters (Supplemental Figure 4). As with the nitrogen responses, we used network inference to construct networks to identify transcrip-tion factors that are associated with the regulatranscrip-tion of rhizobia responses (Supplemental Files 3 and 6).
We found putative defense responses in the cortex to be immediately activated then maintained, with three immediate/ fast regulated clusters enriched for genes annotated as chitin responses (Figure 4B, clusters CN19, 28, and 30; Supplemental Data Set 2; see P values in Supplemental Data Set 4). Rhizobia contain microbe-associated molecular patterns (MAMPs) such as peptidoglycan that activate innate immunity via a conserved LysM signaling pathway that also responds to the MAMP chitin (Gust, 2015). Among the“chitin-responsive”genes are several cortex-specific rhizobial-responsive TFs including ERF11 (cluster CR19, Supplemental Data Set 2); WRKY48 (cluster CR30, Supplemental Data Set 2); a known repressor of plant basal defense genes (Xing et al., 2008); and MYB44 (cluster CR30, Supplemental Data Set 2), a positive regulator of SA-associated defense responses and a negative regulator of JA-associated defense response (Shim and Choi, 2013; Shim et al., 2013). Within the inferred cortex rhizobia-responsive regulatory network (Supplemental File 9), highly connected predicted defense modules included WRKY3 (cluster CR7; Supplemental Data Set 2) and WRKY28 (cluster CR28; Supplemental Data Set 2), with CESA1 (cluster CR26; Supplemental Data Set 2), a cellulose synthase critical for cell wall formation (Burn et al., 2002) pre-dicted to control developmental responses (see Supplemental File 9). Modification of the responses of rhizobia-responsive
genes (e.g., via mutation) could alter basal defense responses to bacteria such as rhizobia, as already seen for responses to patho-genic microbes. For example, wrky48 mutants exhibit stronger de-fense responses (Xing et al., 2008) and myb44 mutants exhibit higher pathogen resistance and are also more sensitive to JA-mediated root growth inhibition (Shim et al., 2013).
Later in the cortex there is upregulation of stress signaling, including“response to jasmonic acid stimulus”(cluster CR10, P = 4.27E-4; Supplemental Data Set 2), and induction of genes known to be involved in remobilizing nitrogen (e.g., NAXT1, cluster CR26; Figure 4B; Supplemental Data Set 2), which could indicate re-partitioning of resources. Similar to in the nitrogen response, cell wall development is regulated, e.g., the methyltransferase GXMT (cluster CR29; Supplemental Data Set 2) that plays a role in the production of cell wall xylan (Lee et al., 2012), CESA3 (cluster CR27; Supplemental Data Set 2), and CSI1 (cluster CR28; Supplemental Data Set 2), which are both involved in cellulose production and for which mutation affects root development (Daras et al., 2009; Gu et al., 2010).“Plant-type cell wall modifi -cation”related transcripts are also regulated in the pericycle, e.g., the pectin methylesterase inhibitor At2g10970 (cluster PR6, P = 8.3E-4; Figure 4B; Supplemental Data Sets 2 and 4), which could be related to the induction of lateral root development or cell wall fortification as part of immunity.
In summary, we found that S. meliloti induces defense re-sponses at early time points (immediate/fast) and stress signaling (late). In addition, other processes including cell wall modification and nitrate remobilization are rhizobia responsive. We hypothe-size that combined, these lead to effects on root architecture as a form of stress adaptation (Figures 4C to 4G).
Cell-Type Identity and Cell-Type Responses to the Environment
Figure 4.Cortical and Pericycle Cells Partition Defense and Developmental Responses to Rhizobia.
(A)Numbers and time response partitioning of transcripts regulated by nitrogen in the cortex and pericycle.
(B)Timeline of processes affected by rhizobia, with the log2expression of select indicative genes shown in rhizobia-inoculated and untreated cortical cells (purple lines) and pericycle cells (red lines). Among cortex clusters that contain an overrepresentation of transcripts involved in particular processes (GO terms) is an immediate upregulation of chitin responses, fast induction of defense responses, fast repression of lipid transport, late upregulation of stress signaling, and nitrate remobilization. Among pericycle clusters there is downstream modification of cell wall formation; see Supplemental Data Set 4 for GO overrepresentation analysis corrected P values and Supplemental Data Set 2 for cluster membership. Dashed black line, untreated (CU/PU); solid purple/red line, rhizobia-treated (CR/PR); error bars indicateSEwith average sample size of 2.95 replicates.
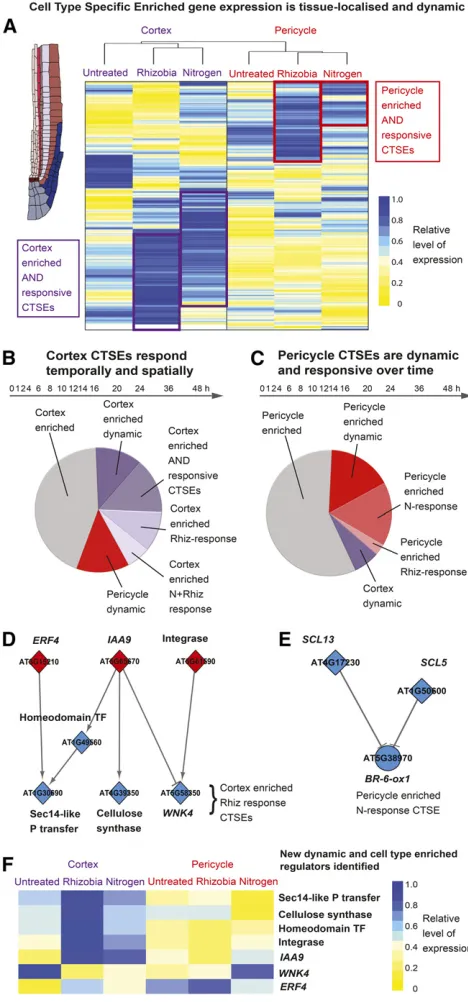
the CTSEs were indeed cell-type-specific enriched but that they were also responsive to the environment.
To determine what controls the expression of the CTSEs that respond to the environment, we queried the PN causative network for N-responsive pericycle CTSEs (Figure 5E) and the CR network forS. meliloti-responsive cortex CTSEs (Figure 5D). TwoSCL
transcription factors are predicted to repress the pericycle re-sponse of the BR-6-ox1 N-responsive gene, potentially re-pressing brassinosteroid synthesis under replete N (Figure 5E). Four transcriptional regulators were found to coregulate a group of three cortex rhizobia-responsive CTSEs and the expression of three out of four of these regulators was found to be similarly enriched in the cortex (Figure 5F). Overall, we found that re-sponsiveness to the environment is enabled by the transcriptome of a cell type and that this response also contributes to the state of that cell type. Using network analysis, we were able to identify novel cell-type-enriched responsive genes that could control responses of particular cell types.
Individual Genes Are Expressed with a High Degree of Temporal and Spatial Specificity, yet the Regulation of Processes Has a High Degree of Overlap
Although most differentially expressed transcripts were DE in one cell type and treatment only (Figure 6), our gene and network analysis suggests that similar processes are regulated across multiple conditions. To confirm this, we determined the degree of functional overlap between lists of differentially expressed tran-scripts. We assigned each transcript to its deepest nonoverlapping path molecular function GO term (see Methods). There is a signif-icantly higher proportion of transcripts that are unique to a cell type and treatment than the proportion of unique GO terms (P < 10E-116), while the proportion of GO terms shared among all cell types and treatments is significantly higher than the proportion of shared transcripts (P < 10E-84) (z-tests) (Figures 6A and 6B); transcript level overlap is low (62% DE in a single cell type and treatment; 1% DE in all cell types and treatments) compared with process level overlap (31% DE in a single cell type and treatment; 23% DE in all cell types and treatments). We term this mechanism“response nonredundancy,” whereby individual transcripts within gene functional groups are expressed with a very high degree of temporal and spatial specificity, yet biological processes are commonly regulated.
Although most (84%) N responses are cell-type preferential, those that are shared between cell types (core N responses) could shed light on the coordination of the N response. We analyzed the timing of the responses of the 450 core N-responsive genes. We
found that 24% (108) of these transcripts display invariant ex-pression in cortex and pericycle. Assessing the 342 genes with timing directionality, a significantly larger number of the core N-responsive transcripts (295) arefirst regulated in the cortex, then in the pericycle (Figure 6C; P < 10E-20, binomial test). This suggests that N responses occurfirst in outer root cell types, including the cortex, before then occurring in inner cell types including the pericycle (Figure 6C). Previous work suggests that nitrate is rapidly transported throughout the root to regulate core N responses, with organic assimilated N typically playing a role in regulating cell-type responses including lateral root development (Gifford et al., 2008). The signal to regulate tissue directional responses could thus be assimilated N or a molecule downstream. This would likely involve signaling across the endodermis, also an N-responsive cell type (Gifford et al., 2008).
The N response of 135 of the 295 cortex-then-pericycle tran-scripts are in the same regulation direction (induced or repressed; see Methods). This timing of gene regulation suggests that an N-induced signal regulates gene expression in the cortex, before passing through and inducing a N-mediated response in the pericycle. This category is overrepresented for genes involved in responses to abiotic stimulus (P = 0.001), which includes many N- and ABA-responsive genes (Figure 6C; Supplemental Data Set 4). Also present is the bZIP family transcription factor TGA1, which has been demonstrated to act downstream of NRT1.1 and has been implicated in the regulation of NRT2.1 and NRT2.2 (Alvarez et al., 2014). The remaining 160/295 genes whose N-response occurs later in the pericycle are regulated in opposite directions in cortex and pericycle. This includes two genes linked to auxin responses:
EXTENSIN(clusters CN38 and PN23; Supplemental Data Set 2), an auxin-responsive member of environment-driven cell wall modi-fying enzymes (Eklöf and Brumer, 2010); and ZINC INDUCED FACILITATOR-LIKE1(clusters CN6 and PN11; Supplemental Data Set 2) that has been shown to modulate auxin transport (Remy et al., 2013). These two genes could be part of auxin-responsive lateral root regulation, responding to auxinflow from the vasculature.
Systemic, non-cell-autonomous signaling or a mix of both could potentially control 108 of the 450 common DE transcripts, since they are regulated at the same time in both cell types (Figure 6C). Seventy-three of these transcripts have identical expression, in-cluding bZIP1 that is immediately N-induced in both cortex and pericycle (clusters CN31 and PN6; Supplemental Data Set 2), and the key ammonia transporter AMT1;1 (AMMONIUM TRANSPORTER1;1) that is N-downregulated fast in both cell types (fast clusters CN10 and PN24; Supplemental Data Set 2). Our finding that bZIP1 plays a role in rapid and early N signaling is supported by studies of bZIP1 perturbation in studies of isolated root cells
Figure 4.(continued).
(D)Schematic timeline of gene expression changes after rhizobial inoculation, preceding root developmental changes (more but shorter lateral roots); labels based on summary of GO terms presented in(B). Solid arrow represents time series of gene expression analysis, and dotted line represents time up to phenotypic analysis images shown in(E)and(F).
(E)Seedlings 4 d after rhizobial inoculation.
(F)Seedlings 4 d after mock inoculation. Bars in(C),(E), and(F)= 1 cm.
(Para et al., 2014). The remaining 47/450 common DE transcripts are regulated first in the pericycle and second in the cortex, which could indicate cell type independence rather than core responses (Figure 6C).
We observed widespread response nonredundancy regula-tion of genes involved in the same gene ontology molecular functions (Figures 6A and 6B), and it is also evident when as-sessing the regulation of gene family members (Figure 6D). We analyzed the regulation of 55 gene families and found that 47/55 gene families had members differentially expressed in each time series. The remaining eight had family members differentially expressed in at least three time series, but these had fewer members (an average of eight DE transcripts rather than an average of 35 DE transcripts; Supplemental Data Set 8). As an example of the typical widespread differential expression within gene families, we found that 29/51 transcripts from the gluta-thioneS-transferase (GST) family are regulated in one or more time series and show diverse patterns of gene regulation (Figure 6D; Supplemental Data Set 7). Although variation in expression patterns between members of a gene family could reflect the inherent range of functions, it is also likely that regulation of the same molecular function in a spatially and temporally diverse fashion will alter the outcome of that molecular activity. This rep-resents the same phenomenon as discussed earlier for common nitrogen-responsive network modules: These were found to regulate the same gene families but control different individual members of these gene families, specific to response and location (Figure 3C). Together, this shows how variations in temporal and spatial regulation in gene expression can enable specificity of re-sponses and highlights the importance of large gene families for enabling complex responses to the environment.
DISCUSSION
[image:13.603.55.289.90.591.2]Our novel time-series data have enabled us to show that envi-ronmental responses exhibit a very high degree of temporal and tissue specificity. By tracking the expression of transcripts over time, we were able to reconstruct a timeline of regulation of molecular processes that link short-term and long-term conse-quential developmental changes in the root system. We found that gene expression in the cortex and pericycle of the root is highly dynamic over day/night cycles, with thousands of genes changing in a wide range of different temporal patterns. Many of these genes also respond to the environment, potentially enabling both
Figure 5. Cell-Type-Specific Enriched Genes Are Dynamic and Re-sponsive to the Environment.
(A)Heat map of average expression within each time series of CTSEs for the cortex and pericycle. The heat map is ordered by hierarchical clustering on distance, within rows of transcript data and between (see dendrogram showing that the CTSE expression is sufficient to cluster according to cell type). Color denotes the average expression of each transcript across the time series and is relative to the average expression of all genes in all time series. Yellow, low level of expression; blue, high level of expression. (B)and(C)Regulation of the 194 cortex CTSEs(B)and 104 pericycle CTSEs(C) based on their differential expression within time series; “enriched,”no differential expression within a time series;“dynamic,”
differential expression within the untreated (U) time series;“responsive,” differential expression within the nitrogen-treated (N) or rhizobia-treated (R) time series; purple shades, differential expression within cortex; red shades, differential expression within the pericycle.
(D)and(E)Network inference-predicted upstream regulators of enriched and responsive CTSEs in the cortex(D)and pericycle(E); diamonds, genes annotated as transcription factors, circles, genes with non-transcription factor functions. Color denotes time offirst significant differential expression (as in Figure 1G).
Figure 6.Gene Family Nonredundancy Enables Specialization of Cell-Type Activity, but with Shared Functional Responses.
temporal- and spatial-specific responses. We hypothesize an interplay between cell-type identity and how these cell types respond to their environment, whereby responses are pro-grammed by the cell type, but in turn reinforce the unique functions of those cell types (the cell type is programmed by its responses). The validity of this hypothesis could be investigated by expressing genes that are typically responsive in one cell type (e.g., pericycle), under the control of a promoter typically expressed in a different cell type (e.g., the promoter of a cortex-specific gene) and/or typically responsive in a different cell type (e.g., the promoter of a cortex-responsive gene). Such“promoter swapping” to compare responses would help to test our hypotheses re-garding the connections between cell-type identity and cell-type responses.
We identified transcription factor modules that control modules of processes and also identified a novel root architecture role for
NLP8(Yan et al., 2016) and a new root architecture-regulating transcription factor,WRKY15, the functions of which are mod-erated by N abundance. The molecular regulation that we uncover underlies lateral root developmental responses under different environments, one component of root plasticity. The time series also enabled us to identify novel directionality in root responses between tissue layers to nitrogen.
Analysis of differentially expressed genes shows that there is a high level of specificity in the regulation of genes in response to treatment and within each cell type. Despite the fact that thou-sands of genes respond to treatments, each cell type before and after treatment still clusters together, suggesting that cell type identity is maintained during these responses. CTSE genes (Birnbaum and Kussell, 2011; Bargmann et al., 2013) are expressed in particular cell types but their expression is not static: They are highly sponsive to the environment. This implies that cell type re-sponses are controlled by the expressed transcriptome, but also that transcript responses contribute to modulating cell-type state. Within this analysis we identified new enriched genes using differential expression and network analysis. In our net-works, we also found closely connected modules regulating similar processes, akin to“molecular network machines,”a term for identifying common control of molecular processes, evident within network analysis (Gunsalus et al., 2005).
Our analysis revealed a novel level of coordination between cell types, since several of the biological processes that are regulated by nitrogen treatment or rhizobia inoculation in cor-tical and pericycle cells were the same, but different genes are
responsible for the responses in each cell type. For example, common transcriptional modules respond in both pericycle and cortex, and regulate similar gene families, but different members of these families act in each cell type and at different times during environmental responses. This suggests much less functional redundancy in gene families than is typically considered and that this is obscured at the whole-root level. This is an important
finding since it shows that the scale and scope of gene activity is not simply the molecular function of a gene, but a consequence of its spatial location, timing of expression, and responsiveness to environmental conditions. It also helps to provide an expla-nation for the typically higher hit rate in identifying phenotypes in regulators identified in systems biology data set analysis using a reverse genetic approach (Ransbotyn et al., 2015); a higher level specificity in the measurement of expression levels, reg-ulation, and location of genes means that investigators can determine more precise and accurate predictions of when perturbation of function might lead to a measurable phenotype.
Overall, thesefindings identify novel mechanisms of environ-mental responses and highlight the need to examine the ex-pression of individual genes at the temporal and spatial levels to better understand how developmental plasticity is controlled and enabled in plants.
METHODS
Plant Lines and Plant Growth
Arabidopsis thalianaGFP-expressing lines in the Col-0 background were selected to mark the cortex (ProCo2:YFPH2Bline; Heidstra et al., 2004) or pericycle (E3754 enhancer trap GFP line; Gifford et al., 2008). To examine At2g43500 (NLP8) perturbation, a heterozygous T-DNA line in the start of the open reading frame (nlp8-2,SALK_140298) was obtained from the ABRC stock center (Scholl et al., 2000; nomenclature as in Yan et al., 2016). CS75037-4-7, harboring a T-DNA inWRKY15(At2g23320), was isolated as part of a mutant screen of pools of T-DNA lines (CS76052) obtained from the ABRC (Scholl et al., 2000); T-DNA location (promoter) was determined using TAIL-PCR (Liu et al., 1995).
For GFP-expressing seeds,;400 per plate were surface-sterilized and sown on 0.7-cm strips of autoclave-sterilized brown growth pouch paper (CYG germination pouch) on 0.8% agar plates containing a basal 13 Murashige and Skoog growth medium (Sigma-Aldrich M0529), supple-mented with sucrose (30 mM), CaCl2(1.5 mM), MgSO4(0.75 mM), KH2PO4 (0.625 mM), and 0.3 mM NH4NO3, pH 5.7. Plates were sealed with mi-croporous tape, seeds stratified for 2 d at 4°C in the dark, and then plates placed in opaque (black polythene) covers (Bagman of Cantley) and grown
Figure 6.(continued).
(B)Euler diagram showing the number of molecular function GO terms from nonoverlapping paths represented within differentially expressed transcripts in (A)and illustrating the greater overlap at the function level compared with at the transcript level. The percentage of transcripts DE in one/two/three/all cell types/treatments is 62:33:4:1, respectively, and the percentage of GO terms DE in one/two/three/all cell types/treatments is 31:29:17:23, respectively. (C)Transcripts that are N-responsive in both the cortex and pericycle (core N responses) can be distinguished according to the timing of their regulation. The predominant pattern is cortex then pericycle regulation (295 transcripts), then regulated in both cell types at the same time (108 transcripts), followed by pericycle then cortex regulation (47 transcripts). Overrepresented processes or genes of note are indicated below indicative expression patterns for each response category; see Supplemental Data Set 4 for GO overrepresentation analysis corrected P values.
in a Sanyo growth chamber (MLR-351H; Sanyo, E&E Europe) with a 16/8-h photoperiod at 50 mmol m22s21and constant 22°C. For T-DNA lines and
their wild-type siblings/Col-0, approximately eight seeds were surface-sterilized and sown directly, side-by-side on deplete N agar plates (as above) or replete N agar plates (as above but with 5 mM NH4NO3) for 12 d, or seedlings were treated with replete N or rhizobia as above at 9 d, then imaged 4 d after treatment.
Plant Treatments
After 9 d in the growth chamber, treatments were performed at dawn (= time 0). To prepare theSinorhizobium melilotisolution, 50 mL of TY/Ca2+
medium (5 g/L Bacto-tryptone, 3 g/L yeast extract, and 6 mM CaCl2) (Journet et al., 2001) was inoculated withS. melilotiand incubated for 26 h at 28°C and 220 rpm to an OD600of 1 to 2. Cells were then harvested by centrifugation (4000 rpm, 10 min, 4°C) and resuspended in 40 mL water to afinal OD600of 0.01 (Ding et al., 2008). To carry out the treatments, seedling strips were removed from plates, briefly immersed (10 s) in liquid deplete N medium (as plates but with no agar), placed on a fresh plate (untreated or briefly immersed in liquid replete N medium, as plates but with no agar and with 5 mM NH4NO3), and placed on a fresh 5 mM NH4NO3 plate (N
treatment), or briefly immersed (10 s) in a solution ofS. melilotiand placed on a fresh deplete NH4NO3plate. Plates were then resealed with
micro-porous tape, replaced in opaque (black polythene) covers, and returned to the Sanyo growth chamber. The same procedure was used to treat Col-0 plants for phenotypic analysis (Figures 2E, 4C, and 4E to 4G), but after growth of;8 seedlings per agar plate for visualization purposes. At hourly time points 0 (immediately before transfer, at dawn), 1, 2, 4, 6, 8, 10, 12, 14, 16, 20, 24, 36, and 48 h after transfer, whole roots were harvested for protoplast generation and FACS by cutting roots just below the growth pouch paper strip. The whole experiment was performed in at least bi-ological triplicate with seedlings for each bibi-ological replicate grown in-dependently (in a nonoverlapping time period). Each replicate sample (for each time point in each time series) consisted of the pooled harvested roots from;200 GFP-expressing seedlings (destructive sampling) grown on the same plate. Each replicate sample was considered independently within subsequent analysis.
Protoplast Generation and FACS
Harvested roots were bundled and cut into lengths of;2 to 3 mm into a 70-mm cell strainer in a small Petri dish containing protoplast-generating solution (600 mM mannitol, 2 mM MES hydrate, 10 mM KCl, 2 mM CaCl2, 2 mM MgCl2, and 0.1% BSA, pH brought to 5.7 with Tris HCl) with 1.5% cellulase R-10 (Phytotechlab), 1.2% cellulase RS (Sigma-Aldrich), 0.2% macerozyme R-10 (Phytotechlab), and 0.12% pectinase (Phytotechlab). The Petri dishes were placed on an orbital shaker at 200 rpm for 1 h then cells harvested by centrifugation (5 min at 1200 rpm, room temperature), resuspended in 500mL protoplast-generating solution lacking enzymes, thenfiltered through a 40-mm cell strainer to break up large clumps of protoplasts.
Protoplasts were sorted using a BD Influx cell sorter (BD Biosciences)
fitted with a 100-mm nozzle, using FACS-Flow (BD Biosciences) as sheath
fluid. Pressure was maintained at 20 p.s.i. (sheath) and 21 to 21.5 p.s.i. (sample), and drop frequency was set to 39.5 kHZ, which yielded an event rate of <4000; these are optimal settings on a BD influx cell sorter for the type of protoplasts (Gifford et al., 2008). To optimize alignment of relevant lasers and detectors, Calibrite Beads (BD Biosciences) suspended in FACS-Flow were used, and to optimize sort settings, BD Accudrop Fluorescent Beads (BD Biosciences) suspended in FACS-Flow were used. GFP-positive protoplasts were identified using a 488-nm argon laser and plotting the output from the 580/30 band-passfilter (orange) versus the 530/ 40 band-passfilter (green). GFP/YFP-positive protoplasts were in the high 530/low 580 population, with non-GFP protoplasts in the low 530/low
580 population and dead/dying protoplasts and debris in the high 580 population (as in Grønlund et al., 2012). At least 10,000 GFP-positive protoplasts were sorted using methods shown previously to preserve endogenous gene expression levels (Birnbaum et al., 2003; Gifford et al., 2008). Sorted protoplasts were directly sorted into Qiagen RLT lysis buffer containing 1% (v:v)b-mercaptoethanol, mixed, and im-mediately frozen at–80°C for RNA extraction (methods according to Gifford et al., 2008).
RNA Isolation, qPCR, and Microarray Hybridization
RNA was extracted from sorted cells using the Qiagen RNeasy RNA kit and DNase treatment using the Qiagen DNase kit. The quantity and quality of RNA were checked with a Bioanalyzer 2100 RNA 6000 Pico Total RNA Kit (Agilent Technologies). cDNA was amplified from RNA using 1/2 reactions of the Ovation Pico WTA System V2 kit (NuGEN Technologies) according to the“quick”protocol. Post-amplification purification of cDNA was per-formed using the QIAquick PCR purification kit (Qiagen). Then, 0.5mg NuGEN-amplified cDNA was labeled using the NimbleGen One-Color Cy3 labeling kit, and 4mg of this was hybridized using the GeneChip hybridization kit on NimbleGen Arabidopsis 123135k probe microarrays designed for the full TAIR-10 annotation Arabidopsis genome (design OID 37507; see GPL18735 and GSE91379; Roche Applied Science). OID has 131,524 probes designed against 27,143 genes in the Arabidopsis genome; 3675 genes had multiple probes along their length to determine expression of 31,524 gene transcripts (an average of 2.19 and up to four gene models each for these genes). Arrays were imaged using an MS200 microarray scanner using only the 480-nm laser using the autogain feature of the NimbleScan software, all according to the manufacturer’s instructions. Grids were aligned automati-cally then manually verified. Raw probe (xys) and gene level unnormalized data were obtained using NimbleScan.
For qPCR analysis of gene expression in T-DNA and wild-type lines, root samples (consisting of;16 roots per sample) were harvested at the end of the growth period on plates; three independent biological replicate sam-ples were harvested. RNA was extracted using the Qiagen RNeasy RNA kit and used for cDNA synthesis (Primer Design). qPCR was performed using SYBR Green dye (Sigma-Aldrich) on a LightCycler 480 system (Roche) (primer sequences in Supplemental Data Set 3D). As a control, we used polyubiquitin UBQ10 using the geNorm REF gene kit (Primer Design) as described (Mestdagh et al., 2009).
Normalization and Quality Assessment of Microarray Data
The xys (NimbleGen)files, which store array coordinates and observed in-tensities, were imported with the Bioconductor“oligo”package (Carvalho and Irizarry, 2010) using the annotation package pd.120110.athal.mg.expr installed through the pdInfoBuilder package (Falcon and Carvalho, 2013). The RMA algorithm (Irizarry et al., 2003), which performs background subtraction, quantile normalization, and summarization via median polish, was applied to the raw data of expression arrays to obtain the log2-normalized gene
Confirmation of Time-Series Data Robustness and Data Processing
The expression of routinely used housekeeping genes (CBP20,Actin-2/8, UBC,YLS8,TUB4, andGAPDH,EF-1a) was analyzed. All the house-keeping genes had constant expression and were invariant to treatment/ tissue type, changing less than 1-fold in either time series (Supplemental Figure 5). A full expression data set for all three of our time series is available to view at the Arabidopsis eFP browser: http://bar.utoronto.ca/ efp_arabidopsis/cgi-bin/efpWeb.cgi?dataSource=Lateral_Root_Initiation Initiation (Winter et al., 2007). For analysis of differential expression, the variation between gene model=transcript expression was investigated by examining the 1547 transcripts, representing 711 genes that were de-termined to be differentially expressed within (using the software BATS [Bayesian Analysis of Time Series]; see below) one or more time series presented in this article (14% of all DE transcripts). Expression was de-termined to be identical between transcripts for 34%, similar for 36%, and different for 30% (Supplemental Data Set 9). Identical expression could indicate redundancy between transcript expression levels, with divergence indicative of functional variation, to be explored in future work. Each transcript was considered separately for the purpose of analyzing ex-pression patterns (in clustering) and for comparing the total size of tran-scriptional response. However, for analysis of functional categories/GO terms represented in responses, and for network inference, analysis was performed at the gene level, to avoid a bias introduced by including the same gene more than once. For network inference, this meant that the average expression value of a transcript set was used; we considered this to be justified since 70% of transcripts showed similar or identical DE.
For analysis of gene families, we determined which transcripts belonged to which gene families according to the same TAIR gene annotation as used for expression array analysis (file: TAIR_gene_families_sep_29_09_update), and we analyzed gene families with more than 20 members.
Two-tailedttests assuming equal variance were used to compare trait values for wild-type and mutant seedling roots and trait values for Col-0 with treatment compared with mock treatment.
Determination and Clustering of DE Genes
DE genes within each time series were obtained using the software BATS (Angelini et al., 2008) and determined to be robust using the independent method of gradient analysis (Breeze et al., 2011). The BATS inputfile for each time series contains the rescaled log2gene expression values such that the vector of log2expression values of each gene had mean zero and variance one. Genes were considered to be DE if their Bayes factors in the BATS outputfile were less than a threshold (log2Bayes factor >3), which was determined by the histogram of log10of Bayes factors and the regression plots of gene expression levels from BATS. DE genes between treatments in each cell type were obtained using Gaussian process modeling implemented in the software GP2S (Stegle et al., 2010). In the GP2S inputfile, the log2
expression levels of each gene for the two time series were rescaled such that their mean was zero and their variance was one. GP2S assigned each gene a Bayes factor that equals the difference between the likelihood of the ex-pression level of a gene in two treatments being sampled from different Gaussian processes and that from the same Gaussian process.
Immediate responding genes were defined as those with |x1-x0| >f1x sd(xt) for gene transcription time series xt, i.e., the absolute value of the change in thefirst time point being larger thanf1times the time seriesSD.
Furthermore, fast and downstream responding genes were defined as genes that were not immediate responders but had a dramatic change within 2 or 6 h of treatment (sd(x0..2) >f2x sd(xt), sd(x0..6) >f6x sd(xt)). The remaining genes not in any of these three classes were designated late. Clusters were further defined as upregulated or downregulated if their expression increased or decreased at this point of differential expression. The thresholdsf1,f2, and
f6were chosen and then clusters were visually inspected to confirm
sep-aration of the clusters into the appropriate classes.
Hierarchical clustering of the differentially expressed genes was per-formed using SplineCluster (Heard et al., 2006). The mean expression levels of biological replicates of a DE gene at each time point in a time series was used as input. A reallocation function was implemented to reallocate outliers of each cluster into other more appropriate clusters at each ag-glomerative step. A prior precision value wasfinally determined after trying different values and comparing their effects on clusters (Supplemental Figure 6).SEof the mean was plotted on all graphs of gene expression.
Statistical Analysis of GO Terms
GOrilla (Eden et al., 2009) with hypergeometric test correction for clusters or BioMaps (Katari et al., 2010) with Fisher exact test with FDR correction was used to determine which GO categories are statistically over-represented for groups of DE genes. The whole TAIR-10 annotated Arabidopsis genome was used as the reference set. To consider a cluster to have a significantly overrepresented GO term, we considered clusters/ groups with$15 genes with the GO term in$3 genes and a corrected P# 0.05 (results are tabulated in Supplemental Data Set 4; generic GO terms were removed from the table during analysis). To assess the degree of functional overlap between lists of differentially expressed genes, we ob-tained GO terms for every gene from the GO website for Arabidopsis using the TAIR10 annotation (Berardini et al., 2004). Since every gene could be as-sociated with more than one function, we assigned as few GO terms as possible for a gene using the R package Go.db and by removing terms that could be associated via a directed acyclic graph as an ancestor to other GO terms assigned for the same gene (Carlson, 2016). This approach determined GO terms from nonoverlapping paths that end with a GO term, which is deepest in its respective path. Sometimes there were GO terms with less significant branching but even these were considered unique for that par-ticular gene. As afinal step, we sorted the GO terms across a particular treatment condition in order to determine unique molecular functions.
Gene Regulatory Network Inference and Analysis