ORIGINAL RESEARCH
PEDIATRICS
Differences in Activation and Deactivation in Children with
Sickle Cell Disease Compared with Demographically
Matched Controls
XB. Sun,XR.C. Brown,X T.G. Burns,XD. Murdaugh,XS. Palasis, andX R.A. Jones
ABSTRACT
BACKGROUND AND PURPOSE: Declines in both functional activation and functional connectivity have been reported in patients with sickle cell disease. In this study, we derived the functional and default mode responses to a word stem paradigm in age-, ethnicity-, and background-matched subjects with sickle cell disease and control groups, with the aim of testing whether both networks were similarly attenuated and whether the changes were related to physiologic parameters that characterize sickle cell disease.
MATERIALS AND METHODS: Both the functional and default mode responses were obtained from age- and background-matched controls and the sickle cell population by using a visually presented word stem paradigm on a 3T scanner.
RESULTS:We observed an attenuated response to both activation and deactivation in the sickle cell disease group. There were no significant differences in the activation response between the 2 groups for the contrast control⬎sickle cell disease; however, significant differences were observed in the medial parietal cortex, the auditory cortex, and the angular gyrus for the default mode. For the sickle cell group, a significant correlation between the activationzscores and the physiologic parameters was observed; for the deactivation, the results were not significant but the trend was similar.
CONCLUSIONS: The results indicate that the physiologic parameters modulate the activation in the expected fashion, but that the effect was weaker for deactivation. Given that significant differences between the 2 groups were only seen for deactivation, additional factors must modulate the deactivation in sickle cell disease.
ABBREVIATIONS:BOLD⫽blood oxygen level– dependent; DM⫽default mode; GLM⫽General Linear Model; SCD⫽sickle cell disease
S
ickle cell disease (SCD) is a hereditary condition that can cause ongoing hemolytic anemia and vaso-occlusion, which can subsequently cause irreversible organ damage. Individuals with SCD are also at an increased risk for ischemic insult to the brain, and both overt1-4and silent-type strokes5-7have been shown tocause neurocognitive deficits. However, studies involving large numbers of neurologically asymptomatic children and adults with SCD have shown that cognitive impairment occurs even in the absence of structural brain abnormalities on MR imaging.8-10
Even though the method of neurocognitive assessment varied among these studies, intellectual ability, executive functioning ability, and visual-spatial memory were usually the cognitive areas most likely to be affected.11These observations support an
emerg-ing consensus that brain injury in SCD is diffuse and insidious12
and that conventional neuroimaging is prone to underestimating the extent of injury.
Thus, advanced neuroimaging techniques are warranted to bet-ter detect differences in SCD. Significant differences in gray matbet-ter volumes have been shown in patients with SCD compared with healthy controls.8In addition, white matter changes have been
dis-covered in patients with SCD by means of voxel-based morphome-try, even in the absence of overt stroke.10One article comparing
pa-tients with SCD with and without prior stroke demonstrated white matter “density” abnormalities in multiple, anatomic regions.10
Dif-fusion-weighted imaging has also been attempted with Tract-Based Spatial Statistics (TBSS; http://fsl.fmrib.ox.ac.uk/fsl/fslwiki/TBSS) to reveal reduced anisotropy and increased diffusivity in subjects with SCD compared with healthy controls, particularly in areas involving the corpus callosum and centrum semiovale.13
Received October 6, 2016; accepted after revision February 6, 2017.
From the Departments of Radiology (B.S., S.P., R.A.J.), Hematology (R.C.B.), and Neu-ropsychology (T.G.B., D.M.), Children’s Healthcare of Atlanta, Atlanta, Georgia. This study was funded by an internal grant from the radiology department at Chil-dren’s Healthcare of Atlanta.
Paper previously presented, in part, at: Annual Meeting of the American Society of Neuroradiology and the Foundation of the ASNR Symposium, May 21–26, 2016; Washington, DC.
Please address correspondence to Richard A. Jones, PhD, Department of Radiol-ogy, Children’s Healthcare of Atlanta, 1001 Johnson Ferry Rd, Atlanta, GA 30305; e-mail: [email protected]
In addition to the aforementioned neuroimaging techniques, functional MR imaging seems to be a promising method for studying neurologic changes. Indeed, fMRI can be used to assess not only task-based activation but also deactivation, (ie, rest ver-sus task). One of the most commonly studied networks assessed during rest is the default mode (DM) network. The DM network can be defined with either resting-state14or task-driven fMRI.15
However, fMRI seems to be underused in SCD because there have been relatively few studies published using this neuroimag-ing technique, to our knowledge. One possible explanation may be the difficulty in determining whether the changes in the blood oxygen level– dependent (BOLD) effect are due to neurologic dif-ferences or possible difdif-ferences in the hemodynamic properties of SCD. While the hemodynamic properties associated with anemia and SCD have been shown to alter the resting perfusion rate of the brain, the degree to which the changes in perfusion, oxygenation, and blood volume affect the BOLD response is unclear. The stud-ies using fMRI have produced mixed results, depending on whether they were assessing deactivation or activation. One acti-vation study using a visual paradigm for fMRI did find that the BOLD response was attenuated in children with SCD.16
Resting-state fMRI studies have reported that pain can alter the connec-tivity between the DM regions and pro- and antinociceptive structures in SCD.17 Additionally, connectivity of the medial
parietal cortex, one of the main elements of the DM network, was shown to be higher in patients with SCD compared with controls.18
Given these findings, 1 advantage of using a task-driven ap-proach to define the DM network is that the same paradigm can be used to derive the activation and responses, so that any hemo-dynamic differences between the patient and control populations will equally affect the activation and deactivation BOLD re-sponses. Because the DM network is implicated in many aspects of brain function15and disruption of the DM has been reported to
negatively impact attention, working memory, and emotional ca-pacity,19an altered DM network in SCD may account for the
some of the neurocognitive changes associated with SCD. While the core elements of the DM network are now well-defined, some areas show more variable deactivation, with the presence and/or strength of the deactivation being modulated by the nature of the stimulus.20,21
In this study, we used fMRI with a visually presented block word stem paradigm to derive the functional and DM responses from age- and background-matched subjects with SCD and con-trol groups. In the subjects with SCD, we also recorded physio-logic parameters that can be used to characterize the BOLD re-sponse and correlated these with the functional and DM responses. Our main aim was that with the same task for both activation and deactivation responses, we could better character-ize neurologic differences between subjects with SCD and control groups.
MATERIALS AND METHODS
ParticipantsThis prospective study was approved by the institutional review board. The subjects with SCD had the homozygous form of SCD (HbSS), no history of stroke, normal blood velocities on routine
screening with transcranial Doppler sonography, and no reported developmental delay. In addition, any prior neuroimaging per-formed as part of their standard of care had to have normal find-ings for inclusion in the study. The control group was composed of siblings or demographically matched peers of the prospective SCD group, who had either sickle cell trait or were healthy and had no history of serious illness, brain surgery, or developmental delay, to limit potential confounds. Physiologic variables that were expected to affect the BOLD response, specifically bin level, mean corpuscular volume, percentage of fetal hemoglo-bin, and percentage of sickle cell hemoglohemoglo-bin, were recorded for the patients with SCD. For both groups, the lower and upper age limits for this study were 10 and 21 years of age.
Neuropsychology
A number of neuropsychological measures were administered to each subject to determine whether significant differences were observed between the SCD group and the control group in cog-nitive ability. The measures included the following: measures of intelligence (Wechsler Abbreviated Scales of Intelligence); work-ing memory (Wechsler Intelligence Scale for Children, Fourth Edition, Digit Span subtest); attention/executive functioning (Conners Continuous Performance Test, Second Edition; Delis-Kaplan Executive Function System; Tower of London, Second Edition, Drexel version; and the Behavioral Rating Inventory of Executive Functioning); and memory (Wide Range Assessment of Memory and Learning, Second Edition; and Children’s Memory Scale). Scores are reported in standard scores (mean of 100 with a SD of 15), in which ranges that extend 0.6, 1.3, and 2 SDs from the mean are equivalent to the average, low average, and impaired ranges respectively.
Between-group differences were analyzed by using SPSS 22.0 statistical software (IBM, Armonk, New York) with an␣ level set to .05. Independent-samplesttests were conducted to compare the SCD and control groups across the neuropsycho-logic measures.
Image Acquisition
MR images from all participants were acquired on a 3T Tim Trio scanner (Siemens, Erlangen, Germany). Standard, noncontrast, clinically diagnostic sequences were performed as follows: T1 3D sagittal MPRAGE (TR/TE/TI⫽2300/2.98/900 ms, 1.0⫽ mm isotropic resolution). 2D T2 and FLAIR images were acquired to screen for disease. MR angiography was performed to screen for large-vessel stenosis. The fMRI sequence used a block-design par-adigm of a word stem task in which the participant was visually presented with a set of 3 letters and had to construct a word that starts with those 3 letters.22Each word stem could be used to
focus on the crosshair. The sequence parameters for the fMRI sequence were the following: TR/TE⫽3000/35 ms, FOV⫽216⫻ 216 mm, matrix⫽72⫻72. Parallel imaging with an acceleration factor of 2 was used in the phase-encoding (anteroposterior) direction.
Diagnostic Imaging Analysis
The clinical diagnostic sequences were reviewed by a board-certi-fied pediatric neuroradiologist. The scans from both patients and volunteers were reviewed for the absence of general pathology; in case of infarcts, these were judged to have normal or abnormal findings. In the latter case, the lesions were then classified as either nonspecific white matter lesions if⬍3 mm in diameter and visible in 2 planes or focal discreet white matter lesions if⬎3 mm in 2 planes.23
fMRI Processing
fMRI processing of the data was performed by using the software routines in the FSL Software Library (http://www.fmrib.ox.ac.uk/ fsl). For each subject, we performed the following steps: motion correction with the MCFLIRT tool of the FSL (https://fsl.fmrib. ox.ac.uk/fsl/fslwiki/MCFLIRT), brain extraction with the FSL Brain Extraction Tool (http://fsl.fmrib.ox.ac.uk/fsl/fslwiki/BET), spatial smoothing with a Gaussian kernel (full width at half max-imum⫽5 mm), and high-pass temporal filtering. A general linear model (GLM) was then used to generate statistical parametric maps of activation and deactivation for each subject by using the motion parameters as estimated by MCFLIRT for that patient as confounds in the FSL General Linear Model (GLM; http://fsl.fmrib. ox.ac.uk/fsl/fslwiki/GLM). The fMRI data were aligned to a skull-stripped anatomic volume acquired in the same imaging session by using the BBR registration option (https://fsl.fmrib.ox.ac.uk/fsl/ fslwiki/FLIRT_BBR) and were subsequently mapped to the standard Montreal Neurological Institute space by using a 12dflinear registra-tion. A second-level analysis was performed by using Flame1 (https:// fsl.fmrib.ox.ac.uk/fsl/fslwiki/FEAT/UserGuide#Group_Statistics) to generate statistical parametric maps of the group activation, group deactivation, and areas of significant difference between the groups (controls⬎SCD).
To measure the meanzscore in areas of activation and deac-tivation (DM), we thresholded the Z statistical maps correspond-ing to the group activation and deactivation to create binary ROIs. These ROIs were then projected back from the standard space to the subject space for each individual by using the inverse transform provided by FSL (https://fsl.fmrib.ox.ac.uk/fsl/fslwiki/ FLIRT/UserGuide).
RESULTS
Exclusion and Demographic Information
All participants in the current study identified themselves as Af-rican AmeAf-ricans. There were initially 17 subjects in the control group and 19 subjects in the SCD group. Three control subjects were excluded due to excessive motion (⬎3 mm) during the fMRI series, and 1 was excluded due to existing pathology. Four subjects with SCD were excluded due to existing pathology, and 2 were excluded due to excessive motion. Thus, 13 subjects were left in each group. The mean ages were 14.5⫾3.1 years for the control
group and 15.3⫾2.3 years for the SCD group. The difference in age between the groups was not statistically significant. In the SCD group, 12 subjects were right-handed, and 1 was left-handed. In the control group, 9 were right-handed, 1 was left-handed, and the handedness was not recorded for the other 3 subjects. Nine of the 13 subjects with SCD were taking hydroxyurea to boost their levels of fetal hemoglobin.
Neuropsychology
Between-group analyses of neuropsychological measures revealed no differences in intelligence, with both groups performing in the average range (Wechsler Abbreviated Scales of Intelligence Full Scale Intelligence Quotient: SCD mean⫽97.7, control mean⫽ 106.0,P⫽.149). Differences observed between the 2 groups were found almost exclusively within the cognitive domain of execu-tive functioning. The control group performed significantly higher than the SCD group on a measure of executive functioning that requires sequencing, planning, and inhibition (Delis-Kaplan Executive Function System Color Word Inference Test; SCD mean⫽88.1, control mean⫽101.9,P⫽.022). Additionally, the control group performed significantly higher on a measure of auditory attention and working memory (Wechsler Intelligence Scale for Children, Fourth Edition, Digit Span; SCD mean⫽92.7, control mean⫽107.3,P⫽.003).
Functional Imaging
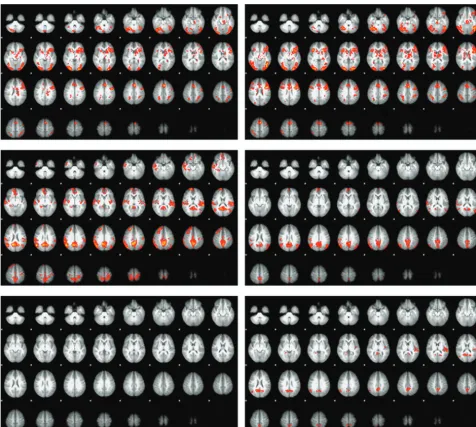
An initial review of the first-level fMRI results revealed 3 subjects with minimal activation but an intact, if attenuated, DM re-sponse. Due to the very different responses in these 3 subjects, they were removed from all subsequent analyses. For the controls, the 10 subjects having the best age match to the reduced sickle cell group were chosen so that each group would consist of 10 sub-jects.Table 1summarizes thezscores for all activated and deacti-vated voxels, for both the complete (n⫽13) group and a reduced group (n⫽10), with the 3 outliers removed. For the activation, the regions seen for both groups were in good agreement with those previously described in the literature (Fig 1).22Subjectively,
[image:3.594.300.531.66.108.2]the activation was somewhat more extensive in the SCD group, most notably in the right anterior temporal lobe. However, there were no areas of significant difference in the control⬎SCD con-trast for activation. For the DM analysis, the classic DM regions (medial parietal cortex and medial prefrontal cortex), the audi-tory cortex bilaterally (left⬎right), and the angular gyrus bilat-erally (right⬎left) were seen in the controls. The left auditory cortex was absent in the subjects with SCD, and the other areas were subjectively both weaker and less extensive in the SCD group. The control⬎SCD image for the DM showed areas of significant difference in the medial parietal cortex, the left audi-tory cortex, and the right angular gyrus (Fig 1).
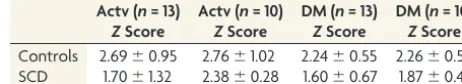
Table 1: Summary of theZstatistics for the total activated and deactivated (default mode) areasa
Actv (n= 13) ZScore
Actv (n= 10) ZScore
DM (n= 13) ZScore
DM (n= 10) ZScore Controls 2.69⫾0.95 2.76⫾1.02 2.24⫾0.55 2.26⫾0.59 SCD 1.70⫾1.32 2.38⫾0.28 1.60⫾0.67 1.87⫾0.49 Note:—Actv indicates activation.
a
A GLM analysis was performed by using age and the physio-logic variable as the dependent parameters in the GLM, covarying age, because CBF varies with age in both healthy subjects and those with sickle cell disease.24 The results are summarized in
Table 2. All 4 variables (hemoglobin, percentage of fetal hemoglo-bin, percentage of sickle cell hemoglohemoglo-bin, and mean corpuscular
volume) showed a statistically significant correlation with thez
score (P⬍.05) for the activation, but none showed a significant correlation with the deactivationzscore. However, with the ex-ception of hemoglobin, the slopes of the GLM fit were very similar for both the activation and the deactivation.
DISCUSSION
Overall our results provide evidence for attenuated DM network activation in our patients with SCD compared with matched con-trols. In addition, results revealed decreased volumes of white matter and the globus pallidus in the patients with SCD compared with controls. The lack of differences in the task-based activation is not surprising given the neuropsychological testing, in which the 2 groups were equally matched for intelligence quotient and did not differ in verbal memory measures. In contrast, differences were specifically observed in the DM network activation, with the control group showing significantly greater activation of core DM nodes compared with patients with SCD. Research suggests that the DM network reflects intrinsic organization of a healthy
[image:4.594.55.284.533.609.2]func-FIG 1. The activation (top row) and the default mode (middle row) responses to the word stem paradigm in the controls (left column) and subjects with SCD (right column). The lower row shows the control⬎SCD contrast for the activation (left) and DM (right) responses.
Table 2: The results for the GLM modeling of the interaction between the BOLD response as measured by theZscore and the physiologic variablesa
Activation Hb MCV %F %S
Activation
Phys. variable () 0.173 0.013 0.018 ⫺0.020 Phys. variable (Pvalue) .036b .034b .023b .021b Deactivation
Phys. variable () 0.246 0.013 0.022 ⫺0.023 Phys. variable (Pvalue) .109 .268 .173 .169 Note:—Phys. indicates physiologic; Hb, hemoglobin; MCV, mean corpuscular vol-ume; %F, level of fetal hemoglobin; %S, level of fetal hemoglobin S.
aThe GLM was run individually for each of the variables in the headers, in each case
tional organization system that primes the brain for efficiently responding to input from external stimuli.25Thus, 1 plausible
explanation for our findings is a disruption of the DM network in SCD, causing these patients to work less efficiently to perform a similar task, in this case a word stem task.
Additional results worthy of discussion are that the physiologic variables were significantly correlated with the activation, but not the deactivationzscores. Thus in patients with SCD, the activation re-sponse reflects the expected effects of variations in the vascular phys-iology (increases in hemoglobin, mean corpuscular volume, and the percentage of fetal hemoglobin, resulting in higherzscores while a higher percentage of sickle cell hemoglobin reduced thezscore). For the 3 outliers who were excluded after the initial analysis, the physi-ologic variables were in the same range as in the other patients but did not show any significant correlation with thezscore. We also inves-tigated other possible reasons for the abnormal activation in these outliers. Of the 3 outliers, 1 was taking hydroxyurea and 2 were not. To investigate the possible effects of pain medications, we acquired the number of emergency department visits during the previous year that required the use of IV pain medications from a review of each subject’s medical records. For all 13 subjects, the average number of visits was 1.6, while for the 3 excluded subjects, none of whom had had any such visits in the previous year, the average was 2.0. Thus, neither of these factors appear to explain the lack of activation in these subjects, and other factors, such as changes in cerebrovascular reactivity26and/or oxygen extraction fraction,27may be responsible
for the weak activation and the poor correlation of the physiologic variables with thezscores for these subjects. Deriving the activation and DM responses from the same paradigm ensures that the physi-ologic effects of SCD are common to both responses. The left audi-tory cortex and the right angular gyrus, while not part of the classic DM network, did exhibit significant deactivation on the difference map (Fig 1). Other groups have previously shown that sensory areas are deactivated when they are not central to task performance,20,21so
that attention to a single sensory technique (the visually present let-ters) can result in decreased activity in cortical regions that process information from an unattended sensory technique (the auditory cortex). The deactivation of the auditory cortex has previously been shown to be bilateral; thus, the absence of activation in the left audi-tory cortex in the subjects with SCD is surprising. Our findings sug-gest the following: 1) a weaker correlation of the DM with the phys-iologic variables for subjects with SCD, 2) larger differences in the DM for the control⬎SCD contrast, and 3) stronger deactivation of the auditory cortex and angular gyrus in the controls. Each of the above may indicate that the deactivation of the DM and associated regions are impaired in the SCD group.
There are some limitations in this work. Many of the DM areas, particularly the medial parietal cortex, are associated with a high resting metabolism and have also been shown to have re-duced cortical thickness26,28and cerebrovascular reactivity26in
subjects with SCD. In this study, we were unable to detect any regions of significant cortical thinning; however, the group size used in the other articles was much larger than ours, and they restricted the age range to older than 12 years to minimize age-related effects.26,28Applying the same criteria to our already small
group size would have reduced the size of the already small con-trol group from 13 to 9 subjects.
CONCLUSIONS
We found significantly decreased volumetric deactivation of the DM network and neuropsychological functioning in pa-tients with SCD compared with controls. These results high-light the effectiveness of using advanced neuroimaging tech-niques to help inform our understanding of neurocognitive deficits in SCD. Our results lend support to the hypothesis that the deficits seen in executive functioning, which primarily re-lies on the medial parietal cortex and medial prefrontal cortex, in patients with SCD are shown to have deactivation differ-ences within the DM network. Additionally, these deficits ap-pear to be related to difficulties of patients with SCD in appro-priately modulating intrinsic brain activity during a cognitive task. Overall, this study provides support for a more focused examination of the DM network and brain matter differences in patients with SCD.
REFERENCES
1. Cohen MJ, Branch WB, McKie VC, et al.Neuropsychological im-pairment in children with sickle cell anemia and cerebrovascular accidents.Clin Pediatr (Phila)1994;33:517–24CrossRef Medline
2. Watkins KE, Hewes DK, Connelly A, et al.Cognitive deficits associ-ated with frontal-lobe infarction in children with sickle cell disease. Dev Med Child Neurol1998;40:536 – 43Medline
3. Wilimas J, Goff JR, Anderson HR Jr, et al.Efficacy of transfusion therapy for one to two years in patients with sickle cell disease and cerebrovascular accidents.J Pediatr1980;96:205– 08CrossRef Medline
4. Bernaudin F, Verlhac S, Freard F, et al.Multicenter prospective study of children with sickle cell disease: radiographic and psycho-metric correlation.J Child Neurol2000;15:333– 43CrossRef Medline
5. Schatz J, Finke R, Roberts CW.Interactions of biomedical and envi-ronmental risk factors for cognitive development: a preliminary study of sickle cell disease.J Dev Behav Pediatr 2004;25:303–10
CrossRef Medline
6. Wang W, Enos L, Gallagher D, et al; Cooperative Study of Sickle Cell Disease.Neuropsychologic performance in school-aged children with sickle cell disease: a report from the Cooperative Study of Sickle Cell Disease.J Pediatr2001;139:391–97CrossRef Medline
7. Hijmans CT, Grootenhuis MA, Oosterlaan J, et al.Neurocognitive deficits in children with sickle cell disease are associated with the severity of anemia.Pediatr Blood Cancer2011;57:297–302CrossRef Medline
8. Steen RG, Emudianughe T, Hunte M, et al.Brain volume in pediatric patients with sickle cell disease: evidence of volumetric growth de-lay?AJNR Am J Neuroradiol2005;26:455– 62Medline
9. Steen RG, Langston JW, Ogg RJ, et al.Diffuse T1 reduction in gray matter of sickle cell disease patients: evidence of selective vulnera-bility to damage?Magn Reson Imaging1999;17:503–15CrossRef Medline
10. Baldeweg T, Hogan AM, Saunders DE, et al.Detecting white matter injury in sickle cell disease using voxel-based morphometry.Ann Neurol2006;59:662–72CrossRef Medline
11. Berkelhammer LD, Williamson AL, Sanford SD, et al. Neurocogni-tive sequelae of pediatric sickle cell disease: a review of the litera-ture.Child Neuropsychol2007;13:120 –31CrossRef Medline
12. Wang WC.Sickle-cell disease and compromised cognition.Pediatr Blood Cancer2011;56:705– 06CrossRef Medline
13. Sun B, Brown RC, Hayes L, et al.White matter damage in asymp-tomatic patients with sickle cell anemia: screening with diffusion tensor imaging.AJNR Am J Neuroradiol2012;33:2043– 49CrossRef Medline
15. Buckner RL, Andrews-Hanna JR, Schacter DL.The brain’s default network: anatomy, function, and relevance to disease.Ann N Y Acad Sci2008;1124:1–38CrossRef Medline
16. Zou P, Helton KJ, Smeltzer M, et al.Hemodynamic responses to visual stimulation in children with sickle cell anemia.Brain Imaging Behav2011;5:295–306CrossRef Medline
17. Darbari DS, Hampson JP, Ichesco E, et al.Frequency of hospitaliza-tions for pain and association with altered brain network connec-tivity in sickle cell disease.J Pain2015;16:1077– 86CrossRef Medline
18. Colombatti R, Lucchetta M, Montanaro M, et al.Cognition and the default mode network in children with sickle cell disease: a resting state functional MRI study.PLoS One2016;11:e0157090CrossRef Medline
19. Salgado-Pineda P, Fakra E, Delaveau P, et al.Correlated structural and functional brain abnormalities in the default mode network in schizophrenia patients.Schizophr Res 2011;125:101– 09 CrossRef Medline
20. Laurienti PJ, Burdette JH, Wallace MT, et al.Deactivation of sen-sory-specific cortex by cross-modal stimuli. J Cogn Neurosci
2002;14:420 –29CrossRef Medline
21. Humphreys GF, Hoffman P, Visser M, et al.Establishing task- and modality-dependent dissociations between the semantic and de-fault mode networks.Proc Natl Acad Sci U S A2015;112:7857– 62
CrossRef Medline
22. Ojemann JG, Buckner RL, Akbudak E, et al.Functional MRI studies of word-stem completion: reliability across laboratories and com-parison to blood flow imaging with PET.Hum Brain Mapp1998;6: 203–15Medline
23. Casella JF, King AA, Barton B, et al.Design of the silent cerebral infarct transfusion (SIT) trial.Pediatr Hematol Oncol2010;27:69 – 89
CrossRef Medline
24. Bush AM, Borzage MT, Choi S, et al.Determinants of resting cere-bral blood flow in sickle cell disease.Am J Hematol2016;91:912–17
CrossRef Medline
25. Raichle ME, Snyder AZ.A default mode of brain function: a brief history of an evolving idea.Neuroimage2007;37:1083–90; discussion 1097–99CrossRef Medline
26. Kim JA, Leung J, Lerch JP, et al.Reduced cerebrovascular reserve is regionally associated with cortical thickness reductions in children with sickle cell disease. Brain Res 2016;1642:263– 69 CrossRef Medline
27. Jordan LC, Gindville MC, Scott AO, et al.Non-invasive imaging of oxygen extraction fraction in adults with sickle cell anaemia.Brain
2016;139:738 –50CrossRef Medline