Abstract—Wireless mesh networks (WMNs) consist of mesh
clients that can be either stationary or mobile, and static mesh routers through which the clients communicate with each other and with the Internet or other networks. Wireless mesh networks have established their presence with a promise of supporting variegated traffic ranging from real-time to best-effort while providing coverage to large metropolitan areas. Multihop communication, the existence of inherently error-prone wireless channel, the static nature of mesh nodes, the availability of sufficient bandwidth resources and the need to transport multimedia traffic with different QoS budgets necessitate the design of QoS-aware routing metrics to improve the performance of routing algorithms. We study the motivations for new and quality-aware routing metrics and provide a detailed comparative analysis supported by NS-2 simulations of some routing metrics that attempt to address these goals. The routing metrics we compare include the traditional shortest-hop, ETX (Expected Transmission Count), ML (Minimum Loss) and MD (Minimum Delay). We observe that ETX improves throughput while MD reduces delay for different packet rates, proving that the right metric should be chosen based on user requirements.
Index Terms—Wireless Mesh Networks, Routing Metrics,
QoS, Performance in terms of throughput, jitter and end-to-end delay.
I.INTRODUCTION
Wireless mesh networks are becoming increasing common. It is a low cost access network communicating in multiple hops over a backbone composed of stationary wireless routers. In general, wireless networks are very popular as they support flexibility and mobility. They do not require the usual cable layout. As a result they are easy to deploy and cost effective. But the existing access points may not cover all users. Mesh networks are typically meant to extend the connectivity to these users by providing a multihop wireless backbone. Each node in WMN operates not only as a host but also as a router forwarding packets of its neighbors. The coverage area of these nodes is known as mesh cloud. These features equip WMNs with many advantages such as low up-front cost, easy network maintenance, robustness & reliable service coverage but key
Manuscript received March 23, 2010.
I. Bhakta is with the School of Mobile Computing and Communication, Jadavpur University, Salt Lake Campus, Block-LB, Plot-8, Sector-3, Kolkata-70009Plot-8, India (Email: [email protected]).
K. Majumdar, A. K. Bhattacharjee, A. Das, D. K. Sanyal, S. Chattopadhyay are with the Department of Information Technology, Jadavpur University, Salt Lake Campus, Block-LB, Plot-8, Sector-3, Kolkata - 700098, India (Email: [email protected]).
M. Chattopadhyay is with the School of Education Technology, Department of Electrical Engineering, Jadavpur University, Kolkata - 700032, India (Email: [email protected]).
advantages are – It is rapidly deployable, it is self-organizing, self healing and it has low transmission power. Due to these advantages WMNs have various applications like broadband home network, community and neighborhood network, enterprise networking, building automation, cash strapped ISPs etc.
For all these application QoS is a critical issue. All these application depend on the provision of adequate QoS support. The application such as voice and voice over IP need to be provided with carrier grade QoS support. So providing QoS is an important issue for designing routing metric in wireless mesh network.
The available MAC and routing protocols applied to WMNs do not have enough scalability for multihop communication. The throughput drops significantly as the number of nodes or hops increases. Implementing QoS at the MAC layer for multihop communication is challenging [15], [16]. Most of the research efforts are hence directed to designing efficient routing metrics which increase throughput and minimize delay is required. Indeed new metrics like ETX [2], [4], ML (Minimum Loss) and MD (Minimum Delay) have been proposed to address some of the limitations of vanilla shortest-hop routing.
We choose OLSR (Optimized Link State Routing) [8] as the routing protocol on which these metrics are implemented and perform a comparison between the metrics using NS2 simulator. In particular we measure the efficacy of the metrics in terms of throughput, jitter and end to end delay.
OLSR is a link state routing protocol which is an optimization of classical link state routing that fulfills the requirements of mobile wireless LANs. Here MPR node concept is used. The nodes which are selected as multipoint relay node (MPR node) forward broadcast messages during the flooding process. But in traditional flooding process every node forwards messages when first time any message reaches it. In OLSR only the nodes which are selected as MPR can generate link state information. Any MPR node is linked to its MPR selector. As a result partial link state information is distributed in the network. Thus optimal route can be obtained in OLSR using this route information. So in OLSR, 3 types of direct optimization is possible: (1) Message overhead is minimized, (2) Minimum number of control messages are flooded into the network, (3) OLSR provides optimized route in terms of number of hops [20]. This protocol use three types of messages – HELLO messages which are transmitted to all neighbors and used for neighbor sensing and multipoint relay calculation, TC messages which are the link state signaling done by OLSR and Multiple Interface Declaration messages which are transmitted by nodes running on different interfaces. It lists
Incorporating QoS Awareness in Routing
Metrics for Wireless Mesh Networks
all the IP addresses of the nodes. To avoid synchronizations of control messages a very simple strategy is used in this protocol – a node should add an amount of jitter to the interval at which the messages are generated.
This protocol is suitable for large and dense networks. It uses the mechanism of table driven proactive routing. The remainder of this paper is organized as follows. Section II gives an idea about the desirable features of routing metrics, QoS provisioning and some example of routing metrics related to wireless network. Section III classifies the routing metrics and gives some general information about each class. Section IV represents four of these routing metrics and their characteristics. Section V provides the simulation results using the NS-2 simulator [17]. Section VI concludes the paper.
II. DESIRABLE FEATURES OF ROUTING METRICS Routing protocols aim to provide good quality paths that may be used to transport traffic from a source node to a destination node. The notion of good quality is dependent on the type of network and the application. If all links are of similar quality, there is no interference and the network is lightly loaded, shortest hop path is the one that minimizes end-to-end delay. But in a multihop network where mesh topology is used and number of nodes or hops is large enough several issues are included such that – Channel Errors, Variability in Channel Conditions, Interference, Load Balancing etc. These above factors are not negligible. So while hop count is a first approximation to a desirable routing metric, several improvisations are possible that consider features characteristic of wireless networks and qualities demanded by applications higher in the protocol stack.
Similarly a good routing metric for wireless mesh networks also needs to address QoS, and computational complexity. QoS is not a new topic in networking but wireless mesh networks introduce several dimensions to it which are not visible in more traditional settings. For example the over-provisioning of bandwidth as done in the internet is not applicable to WMNs. The issues of interference and noise due to the wireless medium aggravated further due to multi-hop routes between source and destination must be dealt with a suitable way. Bandwidth measurement and admission control may be needed [12], [13].
Designing routing metrics for WMNs poses many challenging issues [14]. Unlike ad-hoc networks where new paths, which may not be always of high quality, must be found quickly, WMNs require new quality-aware routing metrics since they mostly have stationary topologies. There are four basic requirements that must be supported by any routing metric for wireless mesh network to provide good performance. These are – the routing metric should not cause frequent root changes to ensure root stability, the routing metric must capture the characteristic of mesh network to ensure that minimum weight paths give good performance, it also should ensure that minimum weight paths can be found using definite algorithms with
polynomial complexity and it must ensure that forwarding loops are not formed by routing protocol.
Various metrics proposed satisfying these criterion include Hop-Count, Expected Transmission Count (ETX), Expected Transmission Time (ETT) [7], Weighted Cumulative ETT (WCETT) [7], Modified ETX (mETX) [1], and Effective Number of Transmissions (ENT) [3], ML (Minimum Loss) [14], MD (Minimum Delay) [19].
Draves et. al. [7] provide an early survey of some of these metrics. Routing protocols and some representative routing metrics are also discussed in [14].
Here we only compare four metrics – Hop Count, ETX, MD, ML, mainly because they are easy to compute and hence appears practically useful. In fact, ETX is actively used in many wireless mesh networks. The other metrics are computationally complex and hence their practical feasibility still remains a question.
III. BROAD CLASSES OF ROUTING METRICS
A routing protocol may choose to optimize any or a combination of many routing metrics.
Metrics are associated with each link of the network and can be additive or non-additive. End-to-end delay is an additive metric since the delay associated with a network path is simply the sum of delays experienced by the links constituting the path. Minimum Loss metric is also additive metric. If error-free packet delivery probability is the chosen metric, its value for the path is the product of the error-free packet delivery probabilities of the included links assuming the probability is an independent and identically distributed random variable. It is easy to see that the logarithm of this metric is additive. The path with the optimal value of this metric can be easily calculated using Dijkstra’s shortest path algorithm. Non-additive metrics are more difficult to calculate. For example, to choose a path between a source-destination pair such that the least available bandwidth along the path is d, one cannot use shortest path algorithms directly. If exact bandwidths of all links are known, pruning the graph gives a desired path or shows that none exists. A stochastic approximation of the problem is to choose the path for which probability of having at least d units of bandwidth along any link is highest. Taking negative logarithm of the path metric, we can easily solve the problem by Dijkstra’s shortest path algorithm.
It may be remarked here that a necessary and sufficient condition for the existence of efficient algorithms (like Dijkstra’s algorithm) for computation of minimum weight routing paths is that the routing metric must have a property called isotonicity [6]. Designing routing algorithms with more than one additive constraint is NP-hard. In [5] the authors take a major stride in designing an algorithm with tunable accuracy that works in presence of multiple constraints.
IV. REPRESENTATIVE ROUTING METRICS
A. Hop Count
Hop count is the most intuitive and most common routing metric in wired and wireless networks. It is additive and isotonic, hence can be determined by Dijkstra’s algorithm. It is the default in routing protocols like DSR, and AODV. Though lightweight, it does not consider vagaries in transmission rates, bit-error induced packet losses in wireless links, interference among traffic flows, presence of multiple channels, and variation of load among different paths. This metric is appropriate for ad hoc networks because new paths can be easily found but high quality path can not be found in due time. So it is not a quality aware metric. We generally choose the path with minimum hop. But as the link between two nodes in wireless mesh network is variable, the number of hops should also be variable [3]. In this case minimum hop does not give a satisfactory solution. So other routing metrics have been proposed for better performance and quality.
B. ETX
ETX is one of the first metric specifically proposed for wireless mesh network. The ETX of a link is the predicted number of data transmissions required to send a packet over that link, including retransmissions. The ETX of a route is the sum of the ETX of each link in the route [2] [4]. So the goal of using ETX metric is to find a route with highest probability of packet delivery instead of shortest path. The ETX of a link is calculated using the forward and reverse delivery ratios of the link. Define:
df: measured probability that a data packet arrives at the recipient
dr: measured probability that the ACK packet is successfully received
Then, the expected probability that a transmission is successfully received and acknowledged = df dr. A sender retransmits a packet that is not successfully acknowledged. Assuming Bernoulli trials, the expected number of transmissions is:
r f d d ETX
1
Each node broadcasts link probes at fixed intervals (with small intentional jitter) to measure the delivery ratios df and dr. The delivery ratios are measured using modified OLSR HELLO packets sent every t seconds. In our experiment the value of t = 2 sec. Each node calculate the number of HELLOs received in a certain period and divides it with the number of HELLOs that should have been received in this period. Each modified HELLO packet informs the number HELLOs received to the neighbor in order to calculate reverse delivery ratio.
The immediate benefit of this metric is the ability to choose high-throughput paths on multihop wireless networks since delivery ratios reflect which links are more capable of successful transmissions. It also easily handles asymmetry of link qualities. It indirectly considers interference among links.
Now if the packet loss probabilities in forward and reverse link directions are p1 and p2 then the probability (p) of an unsuccessful transmission is
) 1 )( 1 (
1 p1 p2
p
So expected number of successful transmissions over 1-hop distance for a packet will be
1
1
) 1 /( 1 ) 1 (
k
k
p p
kp ETX
So ETX metric captures the effects of both the packet loss ratio and path length. It provides easy calculation of minimum weight paths and loop free routing under all routing protocols. Though ETX has some limitations – It can not distinguish between links with different bandwidths, It does not consider data packet sizes.
C. MD
Network delay is an important design and performance characteristic. The delay of a network specifies how long it takes for a bit of data to travel across the network from one node to another. It is typically measured in multiples or fractions of seconds. Delay may differ slightly, depending on the location of the specific pair of communicating nodes. To perform precise measurements both the maximum and average delay is required. There are four types of delay: i. Processing Delay - time routers take to process the packet header, ii. Queuing Delay - time the packet spends in routing queues, iii. Transmission Delay - time it takes to push the bits of a packet onto the link, iv. Propagation Delay - time for a signal to reach its destination.
There is a certain minimum level of delay that will be experienced due to the time it takes to transmit a packet serially through a link. With this some delay is also added due to network congestion. IP network delays can range from just a few milliseconds to several hundred milliseconds. To choose a path all these delay should be minimal over each link involved in this path. Packet retransmissions increase end-to-end delay. So in real time applications the probabilities of increasing end-to-end delay is very high. In this metric we use the path for transmission where delay is minimal.
In the implementation part of this metric for OLSR protocol least transmission delay is used as one of the route selection criterion. That means the route with least sum of transmission delays for all hops is chosen as best path. This will allow us to provide good QoS for multimedia application traffics, such as VoIP which are very sensitive to delay and jitter.
D. ML
V. EXPERIMENTAL RESULTS
We conduct extensive simulations in NS-2 to identify the relative merits and demerits of the above routing metrics at frequency 2.4GHz for 802.11b network. We used the patch for OLSR with support for the above metrics [18]. In this patch the implementation part of these four metrics had already done. We use this code and set the corresponding value of different parameters used specifically for these metrics in our application file. The application file is a tcl file used for NS-2 simulations. These parameters are used to specify which algorithms should be used for selection of multipoint relays, the routing table computation and other behavior of OLSR protocol. Multipoint relaying is used to reduce the number of duplicate retransmissions when forwarding a broadcast packet. This can be achieved by selecting multipoint relay node by each individual node. Multipoint relay nodes are a subset of symmetric neighbor nodes through which all 2 hop neighbor nodes can be easily reached. Another important parameter is willingness which specifies willingness of a node to carry and forward traffic for other nodes. By default a node should advertise a willingness of WILL_DEFAULT. In our tcl file we set willingness to OLSR_WILL_DEFAULT.
[image:4.595.320.523.195.389.2]
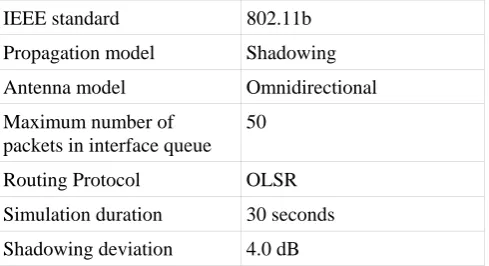
Table – I: Common ome parameters for the four metrics
IEEE standard 802.11b
Propagation model Shadowing Antenna model Omnidirectional Maximum number of
packets in interface queue 50 Routing Protocol OLSR Simulation duration 30 seconds Shadowing deviation 4.0 dB
For simulation we use some parameters which are common for these four metrics and given in table – I.
After simulations we collect the trace files for different packet transfer rates. We use a 10 node mesh topology with path loss exponent = 2.7 and bandwidth 11Mb. We measured the throughput, jitter and end-to-end delay for different packet rates of hop-count, ETX, MD and ML. Using gnu plot we plot these result in a graph so that the performance of these metrics can be easily observed. Figure 1 gives the throughput comparison of Hop Count, ETX, MD and ML metric in terms of graph. We measure the throughput by changing packet transmission rate. We take the throughput values at ten different packet rates and plot graphs with respect to packet speed.
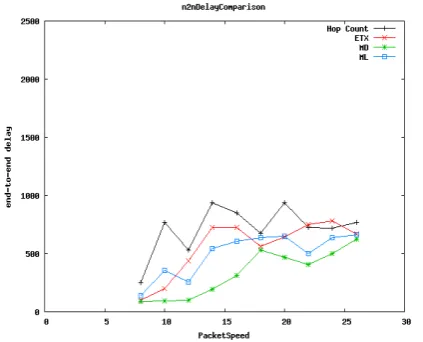
Similarly we measure the jitter and end-to-end delay for these metrics and compare their results. The graphs are given in Figure 2 and 3 accordingly.
Now let us explain each of these graphs thoroughly. According to Fig 1, ETX and ML give higher throughput than MD and hop-count. So we can say that if packet
transfer rate is increased then ETX and ML give better throughput than other two metrics.
[image:4.595.48.293.365.498.2]Now if we consider Fig 2 for three different low packet speeds, ETX and hop-count give lowest value of jitter. So ETX is good in this case also. But for higher packet speeds, the oscillations in the plots are quite significant. This points to an open research direction: designing routing metrics to capture paths with low jitter, retaining the desirable features of the other above mentioned metrics.
Fig 1: Throughput (kbps) comparison with respect to packet speed
[image:4.595.311.521.449.639.2]Fig 3: End - to - end delay (ms) comparison with respect to packet speed
Now consider figure 3. Here MD gives the lowest end-to-end delay (compared to other metrics) for all packet injection rates. Hop-count gives the maximum end-to-end delay.
Although ETX is most satisfactory in terms of throughput, the metric MD, as expected, gives the least end-to-end delay. ETX is most commonly recommended for next-generation wireless mesh networks but where delay is a crucial parameter, MD is a more relevant metric.
VI. CONCLUSIONS
A detailed analysis of four routing metrics for wireless mesh networks has been carried out and their relative merits and demerits outlined. NS-2 simulations of the metrics vindicate the theoretical analysis. We find that ETX performs best compared to other metrics like hop-count, ML and MD in terms of throughput, while MD produces minimum end-to-end delay. These metrics do not minimize jitter per se. An important conclusion is that these metrics perform much better than the traditional metric hop-count. Our future work is aimed at designing a routing metric that minimizes jitter. It is expected that the insights presented here will be useful in choosing the right metrics while designing routing protocols for wireless mesh networks.
REFERENCES
[1] C. E. Koksal, and H. Balakrishnan, “Quality-aware metrics for time-varying wireless mesh networks,” IEEE Trans. Sel. Areas Comm., vol. 24, no. 11, pp. 1984-1994, Nov. 2006.
[2] D. De Couto, D. Aguayo, J. Bicket, and R. Morris, “A high throughput path metric for multi-hop wireless routing,” Proc. MobiCom, 2003.
[3] C. E. Koksal, K. Jamieson, E. Telatar, and P. Thiran, “Impacts of channel variability on link-level throughput in wireless networks,” Proc. ACM SIGMETRICS/Performance, 2006.
[4] D. De Couto, “High-throughput routing for multi-hop wireless networks,” Ph.D. dissertation, MIT, Cambridge, MA, Jun. 2004.
[5] H. De Neve, and P. Van Miegham, “TAMCRA: A tunable accuracy multiple constraints routing algorithm,” Computer Communications, vol. 23, pp. 667-679, 2000.
[6] J. L. Sobrinho, “Network routing with path vector protocols: theory and applications,” Proc. ACM SIGCOMM, 2003.
[7] R. Draves, J. Padhye, and B. Zill, “Comparison of routing metrics for static multi-hop wireless networks,” Proc. ACM SIGCOMM, 2004.
[8] T. Clausen, P. Jacquet, C. Adjih, A. Laouiti, P. Minet, P. Muhlethaler, A. Qayyum, L. Viennot, “Optimized link state routing protocol (OLSR),” RFC 3626, Oct. 2003.
[9] S. Keshav, “A control-theoretic approach to flow control,” Proc. Conf. Comm. Arch. Protocols, 1993. [10] S. Roy, D. Koutsonikolas, S. Das, Y. C. Hu,
“High-throughput multicast routing metrics in wireless mesh networks,” Ad Hoc Netw., 2007
[11] I. F. Akyildiz, X. Wang, W. Wang, “Wireless mesh networks: A survey,” Computer Networks and ISDN Systems:47(4), March 2005.
[12] M. A. Ergin, M. Gruteser, L. Luo, D. Raychaudhuri, H. Liu, “Available bandwidth estimation and admission control for QoS routing in wireless mesh networks,” Computer Networks: 31(7), May 2008.
[13] R. Kravets, Y. Yang, “Contention-aware admission control for ad-hoc networks,” IEEE Transactions on Mobile Computing: 4(4), July 2005.
[14] M. E. M. Campista, et al., “Routing metrics and protocols for wireless mesh networks,” IEEE Network, January/February 2008.
[15] H. Shetiya, V. Sharma, “Algorithms for routing and centralized scheduling in IEEE 802.16 mesh networks,” Proc. IEEE WCNC, April 2006.
[16] V. Kanodia, C.Li, A. Sabharwal, B. Sadeghi, E. Knightly, “Distributed multi-hop scheduling and medium access with delay and throughput constraints,” Proc. 7th Annual International Conference on Mobile Computing and Networking (Mobicom '01), ACM Press, 2001.
[17] NS-2 Simulator version 2.34, www.isi.edu/nsnam/ns/
[18]OLSR patch for NS-2 Simulator,
http://www.inf.ufrgs.br/~wlccordeiro/resources/olsr/
[19] W. Cordeiro, E. Aguiar, W. Moreira, A. Abelem, M. Stanton, “Providing quality of service for mesh networks using link delay measurements,” Proc. ICCCN, 2007.