Dendritic Cells for SYN Scan Detection
Julie Greensmith and Uwe Aickelin
School of Computer Science, University of Nottingham,Nottingham, UK, NG8 1BB. {
jqg, uxa
}@cs.nott.ac.uk
ABSTRACT
Artificial immune systems have previously been applied to the prob-lem of intrusion detection. The aim of this research is to develop an intrusion detection system based on the function of Dendritic Cells (DCs). DCs are antigen presenting cells and key to the activation of the human immune system, behaviour which has been abstracted to form the Dendritic Cell Algorithm (DCA). In algorithmic terms, individual DCs perform multi-sensor data fusion, asynchronously correlating the fused data signals with a secondary data stream. Ag-gregate output of a population of cells is analysed and forms the basis of an anomaly detection system. In this paper the DCA is ap-plied to the detection of outgoing port scans using TCP SYN pack-ets. Results show that detection can be achieved with the DCA, yet some false positives can be encountered when simultaneously scanning and using other network services. Suggestions are made for using adaptive signals to alleviate this uncovered problem.
Categories and Subject Descriptors:I.2 Computing
Methodolo-gies: Artificial Intelligence
General Terms:Algorithms, Security.
Keywords:Artificial immune systems, Dendritic Cells, port scans,
anomaly detection.
1.
INTRODUCTION
The Dendritic Cell Algorithm (DCA) is a recent addition to ar-tificial immune systems (AIS), a collection of algorithms inspired by the human immune system. The DCA is based on current think-ing in immunology, regardthink-ing the role of ‘danger signals’[10] as activators of the immune system. It is shown experimentally that in the human immune system, Dendritic Cells (DCs) process danger signals and other indicators of damage and instruct the adaptive im-mune system to respond appropriately. In this paper we present an approach to intrusion detection inspired by the observed behaviour of natural dendritic cells.
In nature, DCs are sensitive to changes in concentration of dif-ferent signals derived from their tissue environment. DCs com-bine these signals internally to produce their own output signals in combination with location markers in the form of antigen[11]. The
Permission to make digital or hard copies of all or part of this work for personal or classroom use is granted without fee provided that copies are not made or distributed for profit or commercial advantage and that copies bear this notice and the full citation on the first page. To copy otherwise, to republish, to post on servers or to redistribute to lists, requires prior specific permission and/or a fee.
GECCO’07, July 7–11, 2007, London, England, United King-dom.
Copyright 2007 ACM 978-1-59593-697-4/07/0007 ...$5.00.
signal combination procedure is facilitated through a mechanism known as signal transduction. The signals received from the tissue during antigen collection determines the context in which the an-tigen is presented to the adaptive arm of the immune system. The outcome is either tolerance or activation towards entities express-ing antigen of the same structure as the presented antigen. DCs form ideal inspiration for an artificial immune system based intru-sion detection algorithm as they are a key cell in this biological decision.
The DCA is not the first AIS algorithm applied to intrusion de-tection. In fact, intrusion detection systems (IDS) were amongst the first applications of any AIS, based on the premise of combat-ing computer viruses with a computer immune system. Negative selection [7] has been used with some success, but is plagued by problems surrounding scaling and false positives[14]. The premise of the Danger Project [1] is to alleviate the problems encountered with negative selection through the incorporation of danger the-ory based immunology to AIS. The DCA is one of the significant research outcomes of the Danger Project, alongside the libtissue framework[16] and developments in DC biology[17].
The aim of this paper is to expand on previous work using the Dendritic cell algorithm [5], by applying the algorithm to realistic port scan detection and observing the effects on the system. This can be used to gain insight into the behaviour of the DCA under different conditions and the development of a generalised signal selection schema.
This paper describes the application of the DCA to the detec-tion of port scans based on the sending of SYN packets. This type of scan is termed a SYN scan. Section 2 contains background in-formation regarding the use of AIS in computer security, an over-view of the immunology used as inspiration, and an overover-view of the DCA itself. General rules for signal selection are outlined in Section 3, with examples of signals used for the purpose of scan detection. Experiments demonstrating the use of the DCA for SYN scan detection are outlined in Section 4. Results show the effects of different scanning scenarios on the detection capabilities of the algorithm. The final sections include a discussion of these results and their implications for the future of this algorithm.
2.
BACKGROUND
In this section we present information regarding the use of AIS within Intrusion detection, a summary of Dendritic cell biology and the fundamentals of the Dendritic Cell Algorithm.
2.1
Computer Security and AIS
where patterns of known malicious behaviour are stored in a data-base and are compared against observed patterns at run-time[13]. This approach can lead to false negative errors as the signature base must be constantly updated in order to provide adequate protection. Another approach tried by the IDS community is anomaly detec-tion. In this paradigm, a profile of good or normal behaviour is created from training data. Deviations from normal result in the generation of alerts. Anomaly detection systems can be prone to false positive errors, detecting normal actions as anomalous, be-cause normal is difficult to define and can change over time. Early AIS were developed for the purpose of detecting intruders in the context of computer security[3]. The method employed to achieve protection against breaches in computer security was the negative selection (NS) algorithm [7].
Extensive amounts of work have been performed with this al-gorithm, spanning over a decade of research within AIS[2]. In particular, the NS algorithm has been applied to the detection of anomalous connections between computers[7]. This anomaly de-tection style system used a supervised learning paradigm. Network connections are represented as bit-strings, and a profile of normal strings is created as training data. These positive examples of nor-mal are shown to a set of detectors, who are assigned randomly generated strings. Each detector is matched against each training item for similarity assessment. Should a detector match a sufficient number of normal strings, it is deleted from the detector set. This filtering results in a set of detectors tuned to detect strings which fall outside this normal set. This functions in a similar manner to mechanisms shown in classical immunology based on the self-nonself paradigm.
The NS approach has a number of problems, highlighted by vari-ous researchers within AIS and proved both empirically and the-oretically. Firstly the algorithm does not scale as well as expec-ted[8]. This is due to the randomisation process associated with the generation of the detector set. As the size of the detector space increases, the number of detectors needed to cover the space in-creases exponentially. Additionally, a higher rate of false posit-ives was shown than expected [14], despite attempts to improve the representation and the addition of features such as user interac-tion based ‘co-stimulainterac-tion’ techniques. The false positive problem arises due to the initial static definition of normal. What is ‘normal’ changes over time, as new previously unseen connections are made and once trusted connections can become subverted for malicious purposes.
In 2003, Aickelin et al [1] outlined the Danger Project, describ-ing the application of the ‘danger theory’ to intrusion detection sys-tems. The authors suggested a system of detection based around the presence or absence of danger signals as opposed to the pattern-matching based approach used in negative selection. Danger sig-nals released as a result of dying cells indicate damage, and stim-ulate the immune system. It was proposed that a system which could differentiate between data collected in a dangerous context with data collected in a safe context. It was suggested that some of the problems with false positives could be alleviated through the incorporation of these two contexts for the purpose of IDS. As dendritic cells are a key cell in the translation of danger signals, they have formed a central part in the development of the danger based IDS, described in this paper.
2.2
Dendritic Cells
In this section a brief overview of the biological principles used in the Dendritic Cell Algorithm are introduced. For more detailed discussion of DC biology, please refer to [9] or [4].
In the human body, DCs have a dual role, as garbage collectors
for tissue debris and as commanders of the adaptive immune sys-tem. DCs belong to the innate immune system, and do not have the adaptive capability of the lymphocytes of the adaptive immune system. DCs exist in various states of differentiation, which de-termines their exact function. Modulations between the different states are dependent upon the receipt of signals while in the initial orimmaturestate. The signals in question are derived from numer-ous sources, including pathogens, from healthy dying cells, from damaged cells and from inflammation. Each DC has the capability to combine the relative proportions of input signals to produce its own set of output signals. Input signals are categorised based on their origin:
PAMPs: Pathogenic associated molecular patterns are proteins
ex-pressed exclusively by bacteria, which can be detected by DCs and result in immune activation. The presence of PAMPS usually indicates an anomalous situation.
Danger signals: Signals produced as a result of unplanned
nec-rotic cell death. On damage to a cell, the chaotic breakdown of internal components form danger signals which accumu-late in tissue. DCs are sensitive to changes in danger signal concentration. The presence of danger signals may or may not indicate an anomalous situation, however the probablility of an anomaly is higher than under normal circumstances.
Safe signals: Signals produced via the process of normal cell death,
namely apoptosis. Cells must apoptose for regulatory reas-ons, and the tightly controlled process results in the release of various signals into the tissue. These ‘safe signals’ result in immune suppression. The presence of safe signals almost certainly indicate that no anomalies are present.
Inflammation: Various immune-stimulating molecules can be
re-leased as a result of injury. Inflammatory signals and the pro-cess of inflammation is not enough to stimulate DCs alone, but can amplify the effects of the other three categories of signal. It is not possible to say whether an anomaly is more or less likely if inflammatory signals are present. However, their presence amplifies the above three signals.
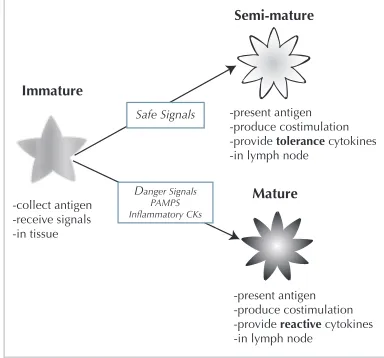
Dendritic cells act as natural data fusion agents, producing vari-ous output signals in response to the receipt of differing combin-ations of input signal. The relative concentration of output signal is used to determine the exact state of differentiation, expressed by the production of two molecules, namely IL-12 and IL-10. In their immature state, dendritic cells collect antigen within the tis-sue compartment. During this phase they are exposed to varying concentrations of the input signals. Exposure to PAMPs, danger signals and safe signals causes the increased production of costim-ulatory molecules, and a resulting removal from the tissue and mi-gration to a local lymph node.
back to the tissue to seek out any entity displaying a matching an-tigen. Conversely, if the DC is exposed to predominantly safe sig-nals, antigens are presented in a safe context, as little damage is evident when the antigen is collected. This induced state of dif-ferentiation is termed semi-mature. In this state the DC produces IL-10 which has the ability to de-activate T-cells. . If the match-ing T-cell encounters an entity expressmatch-ing this antigen, no response is mounted. The balance between the signals is translated via the signal processing and correlation ability of these cells. The over-all immune system response is based on the systemic maturation state average of the whole DC population. An abstract view of this process is presented in Figure 1.
Semi-mature
Mature Immature
-collect antigen -receive signals -in tissue
-present antigen -produce costimulation -provide tolerance cytokines -in lymph node
-present antigen -produce costimulation -provide reactive cytokines -in lymph node
Safe Signals
[image:3.612.353.519.122.369.2]Danger Signals PAMPS Inflammatory CKs
Figure 1: An abstract view of DC maturation and signals re-quired for differentiation. CKs denote cytokines, molecular messengers between immune system cells.
2.3
The Dendritic Cell Algorithm
The Dendritic Cell Algorithm (DCA) was first introduced by Greensmithet al[4] in 2005. It has since been applied to two-class classification of a static machine learning dataset[4], the detection of small-scale port scans, under both off-line conditions[5] and in real-time experiments [6]. It represents a shift in focus within the field of AIS, from algorithms based solely on the adaptive immune system function to those incorporating metaphors derived from the innate immune system. This has paralleled similar trends in im-munology, where for decades it was believed that the immune sys-tem used a pattern based syssys-tem to identify pathogens. Opposition to this theory in the light of volumes of opposing evidence stim-ulated research of the innate driven mechanism demonstrated via DC behaviour and how this integrates with the concepts of clas-sical immunology. In a similar manner, the DCA abandons the use of pattern matching to classify antigen, as previously used in the Negative Selection algorithm [7]. As a result it does not suffer the scaling problems outlined for negative selection. A brief descrip-tion of the algorithm follows below, with a detailed descripdescrip-tion and its implementation given in Greensmithet al[5].
The DCA is a population based system, with each agent in the system represented as a cell. Each cell has the capacity to collect data items, termed antigen, and the processing of values of input signal. The combination of the input signals forms cumulative out-put signals of the DCs. The population of cells is used to correl-ate co-occurring and disparcorrel-ate data sources, effectively combining the ‘suspect’ data (antigen) with ‘evidence’ in the form of signals.
The algorithm uses the notion of tissue, which supports the initial processing of data, as implicated in Twycross and Aickelin [16]. Two ‘compartments’ are necessary, one for data collection and pro-cessing termed tissue, and one for the analysis of antigen termed a ‘Lymph node’. A diagram of the DCA is presented in Figure 2.
‘Tissue’
S1
S2
S3
Sn
... ...
Ag1
Ag2
Ag3
Agn
- Storage area for data
Signal Matrix
‘Mature’ ‘Semi-Mature’
Antigen
Maturation Phase
Analysis Data Sampling
Phase
Input Data
Immature Dendritic Cell Population
collected data (process IDs)
more danger signals more safe
signals behavioural signals
(network flow)
Figure 2: Illustration of the DCA showing data input, continu-ous sampling, the maturation process and antigen analysis.
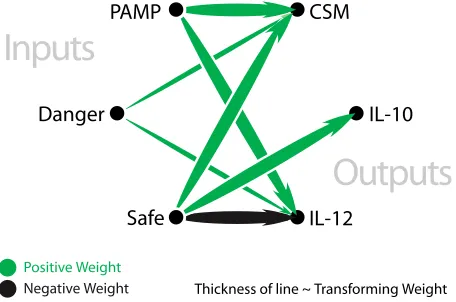
In the tissue compartment, input data is stored for collection by the DC population. Antigens are stored in an antigen vector, with signals stored in a signal matrix. The population of DCs is stored as an array of objects. Multiple signals of different categories can be used as input and stored in the matrix. The signal matrix facil-itates the representation of signals within the system, providing the interface between raw values of input data and signal values for the use of the DC population. Signals and antigen are streamed to the tissue, with both storage data structures updated upon the arrival of new data. Cells in the sampling population are updated once per second. During this update, each cell selects 10 indices within the antigen vector, and transfers any antigen contained within the vector to the cell’s own antigen store. Once the antigen vector has been sampled, values from the signal matrix are copied to the cells internal signal store. Cumulative output signal values are updated each time the signal matrix is visited. A schematic representation of the signal processing equation is shown in Figure 3.
[image:3.612.76.268.193.372.2]PAMP
Danger
CSM
IL-10
IL-12
Safe
Inputs
Outputs
Thickness of line ~ Transforming Weight Positive Weight
[image:4.612.59.287.83.234.2]Negative Weight
Figure 3: A schematic diagram of the signal processing equa-tion used by every DC to fuse input signals and derive output signals.
Assessment of the output signals of DCs (either 10 or IL-12) in the lymph node is used to form the context of the collected antigen. The two remaining output cytokines are assessed. A high value of collected PAMPs and danger signals with a low value of safe signal is likely to result in an increase in mature output signal. Conversely a high value of safe signal will result in a high value of semi mature output signal. The values for semi mature and mature output signals are compared. The context of the DC is given by the output signal with the greatest value, with the assignment of context of 0 for semi-mature and 1 for mature. In the event of a tie, the cell is given a context of 0.
Antigens collected by the DC are printed to a log file, in combin-ation with the context of the cell. An average context can be calcu-lated for antigens of identical value or structure (type of antigen). The total fraction of mature antigen, per type of antigen, is derived forming the mature context antigen value orMCAV coefficient. The nearer a MCAV is to 1, the more likely the antigen is anomalous, as it was frequently collected in a context with high values of danger signals and PAMPs repeatedly. A confidence metric for the MCAV is derived using the total number of antigen presented per type of antigen. The higher the confidence value, the greater the probabil-ity of the MCAV being an accurate representation of the processed data. The uses of the antigen confidence indicator are shown in Section 5.
3.
SYN PORT SCAN DETECTION
Previous use of the DCA involved the detection of a short and simple ping scan, based on the ICMP ‘ping’ protocol. To challenge the capability of the DCA, in this paper the algorithm is applied to the detection of the more complicated port scan, the TCP SYN scan. This is a commonly used type of scan, which leaves no trace in the normal system logs. Port scans form an ideal model of an in-trusion, and techniques applied to scan detection can also be used to detect scanning worms. Early detection of scanning can prevent more serious attacks, as it is a tool crucial to the information dis-covery stage of intrusions. In this paper, we aim to detect a SYN scan launched from a victim machine, where the DCA is used to monitor the behaviour of the victim. This forms a scenario repres-enting a scan performed by an insider, namely a legitimate user of the system who uses the system in an unauthorised manner.
The SYN scan itself is used to determine which ports are open and which services are running on specified hosts. Unlike the de-fault TCP Connect scan, the SYN scan leaves no trace in normal system logs, as the TCP ‘3-way handshake’ is left incomplete. SYN scans involve sending TCP packets to IP addresses specified at the command line of the scan program. The scanning machine sends a SYN packet to each address, and uses the information retrieved from the scanned remote machines to characterise the network. If a SYN packet is sent to a closed port, the remote machine responds by sending a TCP reset (RST) packet back to the scanning machine. Conversely, if the port is open, the remote machine responds with a TCP SYN-ACK packet. The scanning machine then terminates the potential TCP connection by sending a RST packet to the re-mote machine. As the 3 way handshake is not completed, no actual connection is made to the remote machine.
3.1
Signals
In vivo, DCs combine input signals in the form of concentra-tion of molecules, translated through a network of receptors, signal transduction mechanisms and gene regulatory processes. Natural DCs are sensitive to changes in their environment, described as the chemical content of tissue which the DCs can sense through their expressed receptors. In a similar manner, the DCs used in the DCA are sensitive to changes of value within the signal matrix. This system relies on correct mapping of signals through examining the nature of the input data, and the assignment of correct weight-ings. To assist the signal selection process, a set of general rules for correct mapping are defined. Previous experiments have shown that modifications to the mappings of the different signals can lead to the generation of false positive errors [5], though robustness is shown if PAMPs and danger signals are incorrectly mapped. Input signals are abstracted from the general biological principles out-lined in the previous section:
• PAMPs: A signature of abnormal behaviour, e.g. errors per second. An increase in this signal is associated with a high confidence of abnormality.
• Danger Signal: A measure of an attribute which increases in value to indicate an abnormality e.g. number of network packets per second. Low values of this signal may not be anomalous, giving a high value a moderate confidence of in-dicating abnormality.
• Safe Signal: A measure which increases value in conjunction with observed normal behaviour e.g. a low rate of change of packet sending. This is a confident indicator of normal, predictable or steady-state system behaviour. This signal is used to counteract the effects of PAMPs and danger signals.
• Inflammation: A general signal of system distress, which is insufficient to cause any maturation in the absence of other signals e.g. many users logged into a system remotely. Used to amplify the effects of the other signals.
the changes are small in magnitude. The inflammatory signal is simplified as a binary signal i.e. inflammation present or not. All PAMPs, dangers and safe signals are normalised within a range of 0 and 100 to facilitate further processing.
PAMP-1 is the number of ICMP ‘destination unreachable’ er-ror messages received per second. Scanning IP addresses which are not attached to a running machine or machines which are fire-walled against ICMP packets generate these error messages. This signal was proved useful in detecting ping scans, and may also be useful in the detection of SYN scans, as an initial ping scan is performed to find running hosts. In this experiment, the number of ICMP messages generated was significantly less than observed with a ping scan. To account for this, normalisation of this signal includes multiplying the raw signal value by 5, capped at a value of 100.
PAMP-2 is the number of TCP reset packets sent and received per second. Due to the nature of the scan, a volume of RST packets are created in both port status cases; they are generated from the scanning machine if ports are open, and are generated by the remote machines if ports are closed. RST packets are not usually present in any considerable volume, so their increased frequency is a likely sign of scanning activity. This signal is normalised linearly, with a maximum cap set at 100 RSTs per second.
The first danger signal (DS-1) is derived from the number of network packets sent per second. Previous experiments with this signal [5] indicate it is useful for the detection of outbound scans. A different approach is taken for the normalisation of this signal. A sigmoid function is used to emphasise the differences in observed rate, making the range of 100 to 700 packets per second more sens-itive. This function makes the system less sensitive to fluctuations under 100 packets per second, whilst keeping the sensitivity of the higher values. A cap is set at 1000 packets per second. The result-ing signal range is between 0 and 100.
DS-2 is derived from the ratio of TCP packets to all other packets processed by the network card of the scanning machine. This signal is used as during SYN scans there is a burst of traffic comprised of almost entirely TCP type packets. The ratio is noramlised through multiplication by 100, to give this signal the same range as DS-1.
Safe signals are implemented to counteract the effects of the other signals, hopefully reducing the number of false positive an-tigens. The first safe signal (SS-1) is applied as described in [5] and encapsulates the rate of change of sending of network packets. High values of this signal are achieved if the rate of change is small and vice versa. This implies that a large volume of packets can be legitimate, as long as the rate at which the packets are sent remains constant.
The second safe signal (SS-2) is based on the observation that during SYN scans the average network packet size drops to a size of 40 bytes. Observations under normal conditions show that the av-erage packet size is within a range of 70 and 90 bytes. A step func-tion is implemented to derive this signal, with raw values between 40 and 45 bytes given a SS-2 value of 0, 46-50 bytes a value of 10, 51-60 bytes a value of 50, and over 61 bytes a value of 100. Pre-liminary experiments showed that a moving average is needed to increase the sensitivity of this signal. This average is created over a 60 second period.
The inflammatory signal is binary and is based on remote root log-ins. If a remote root log-in is detected this signal equals one, acting as a multiplier for the other signals.
3.2
Antigen
The signals have been selected for the detection of SYN scans, based on observed changes in machine behaviour during a scan.
Hence, the signals chosen in this paper differ from those in our previous research. However, the antigen used for ping scan de-tection is also suitable for the dede-tection of SYN scans. Process identification numbers (PIDs) generated each time a system call is made form the antigen. All remote sessions facilitated by ssh are monitored for this experiment. Using multiple system calls with identical PIDs allows for the aggregate antigen sampling method, described in Section 2. This allows for the detection of exactly which process was active when changes in signal values are ob-served. This technique is a form of process anomaly detection, but the actual structure of the PID is not important in terms of its classification, i.e. no pattern matching is performed, PIDs simply represent labels to identify processes.
4.
EXPERIMENTS
The aim of this experiment is to apply the DCA to the detection of a SYN scan, launched from the machine which the algorithm is monitoring. Two datasets are used for this purpose: passive normal and active normal. The passive normal dataset emulates a ‘night time’ scan, while the machine is not being actively used. It should be relatively easy to detect anomalous behaviour in this data set. The active normal dataset includes simultaneous web-traffic and scanning processes.
The active normal dataset is 7000 seconds in duration, with ‘nor-mal’ antigen generated by running Firefox over a remote SSH ses-sion. During browsing, multiple downloads, chat sessions and the receipt of e-mail occurred representing different patterns of net-work behaviour. The passive normal dataset comprises of a nmap scan and its pts-ssh demon parent. Both datasets contain processes which were invoked as a result of running a remote SSH session to run the scan, logged in using a root password. Both datasets contain a SYN scan of all ports using 254 IP addresses. Approx-imately 70 hosts were available at any time during the scan. As the scanned machines are part of a university network and the availab-ility of the machines is beyond our control. The scan performed in both datasets is a stealth SYN scan, with a fast probe sending rate ( <0.1 sec per probe), facilitated through the use of the popular
scanning tool,nmap[12]. The command used is “nmap -sS -v
xxx.xxx.xxx.1-254. Once these initial datasets are created, a ‘replay client’ is used to process the same data repeatedly for dif-ferent experiments, even though the system is designed to and does work in real-time.
All experiments are performed on an AMD Athlon 1GHz Debian linux machine (kernel 2.4.10). The algorithm is implemented within
thelibtissue framework[15], implemented in C (gcc 4.0.2)
with interprocess communication facilitated by the SCTP protocol. All signals are derived using signal collection scripts, with values taken from the ‘proc’ filesystem (PAMP-1, DS-1, SS-1, I), the tcp-stat linux utility (D2, SS-2) and a custom developed packet sniffer (PAMP-2).
4.1
Results
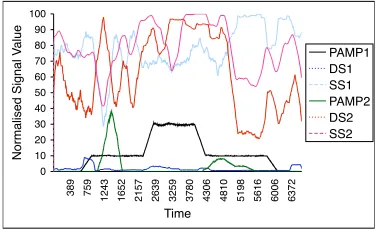
Figures 4 and 5 show the input signals for the active normal (AN) and passive normal (PN) datasets respectively. In reality, both sets of signals are extremely noisy, and the figures depicted are smoothed representations of the actual signal values used in the experiments. Inflammation is a binary signal an is not represen-ted on these figures. The AN signals are more variable than the PN signals, as many more processes run during the AN session. In the AN session, the duration of the nmap scan is approximately 6000 seconds, with the scan initiating at 651s. Signals PAMP-1, PAMP-2 and DS-2 clearly change for the duration of the scan. The remaining signals are less clear, though some evidence of changes throughout the scan duration is shown. The changes are transient and localised in particular to the beginning of the scan, when the majority of probes are sent to other hosts.
The signals of the PN dataset are less noisy. Analysis of in-put antigen confirms nearly 99% of these antigens belong to the anomalous pts and nmap processes. PAMP-1 and PAMP-2 are re-sponsive to the scan, as shown by their rapid decline towards the end of the scanning period, at 5500s. Changes in DS1 are more pronounced in the PN dataset, yet the magnitude of this signal is smaller than expected. DS-2 appears to be highly correlated with the scan, yielding values of over 20 throughout the scan duration. SS-1 performs poorly, and only decreases in response to the scan in a few select places. SS-2 falls sharply in the middle of the scan, as predicted, but otherwise remains at a constant level of 60 even after the scan has finished.
0 0 1
0 2
0 3
0 4
0 50 6
0 7
0 8
0 9
0 0 1
389 759 1243 1652 2157 2639 3259 3780 4306 4810 5198 5616 6006 6372 e
m i T
Normalised Signal
Value PAMP1
1 S D
1 S S
2 P M A P
2 S D
2 S S
Figure 4: Simplified sketch of the input signals comprising the active normal dataset. Inflammation is not represented.
The antigen log file for the output of the DCA in both experi-ments (AN and PN) is partitioned and MCAVs recalculated after
0 0 1
0 2
0 3
0 4
0 5
0 6
0 7
0 8
0 9
0 0 1
0
382 734 1095 1455 1819 2213 2575 2937 3299 3663 4010 4359 4705 5053 5388 5720 6051 6383
e m i T
Normalised Signal
Values PAMP1 1 S D
1 S S
2 P M A P
2 S D
2 S S
Figure 5: Simplified sketch of the input signals comprising the passive normal dataset. Inflammation is not represented.
every 10000 antigens. In Figures 6 and 7 each point represents the MCAV over 10000 antigens per process, for each process of in-terest. Figure 6 shows the MCAV output for PN. High values of over 0.5 are shown consistently for both nmap and pts in this ex-periment. This is evident for the first 40000 antigens. The MCAV values for the remainder of the scan are low, as at this point the scan slows to such extent that the behaviour of the machine remains con-stant, causing little change in signals and resulting in low MCAV values.
0 20 40 60 80 100 120
0.0
0.2
0.4
0.6
0.8
1.0
Partition
MCAV Coefficient
[image:6.612.326.554.449.598.2]Nmap Pts/ssh
[image:6.612.79.273.489.604.2]Figure 6: MCAV per 1000 antigens for the passive normal data-set. Nmap and Pts processes detected and represented.
processes, with identical standard deviations of 0.31. It appears that it is not possible to separate the two active processes if normal and attack processes run concurrently.
0 20 40 60 80 100
0.0
0.2
0.4
0.6
0.8
1.0
Partition
MCAV Coefficient
Nmap Pts/ssh
[image:7.612.358.542.96.253.2]Firefox
Figure 7: MCAV per 1000 antigens for the active normal data-set. Nmap, Pts and parent Firefox browser processes detected and represented.
5.
ANALYSIS
The results presented in Figure 6 show that the DCA can be used to detect large scale port-scans over an extended duration. It is im-portant to note that the input data is both noisy and voluminous. The number of input antigen for both datasets is in excess of 1.3 million in total with the the actual input signal data also very noisy, with events such as network availability highly variable. Under ‘night time’ conditions, which are ideal, the algorithm performs re-markably well, compressing 1.3 million data items to a resultant 130,000 antigens (for PN), over the 7000s duration. The perform-ance in terms of detection is also exemplary, indicating that the DCA is successful when applied to a ‘real-world’ scenario.
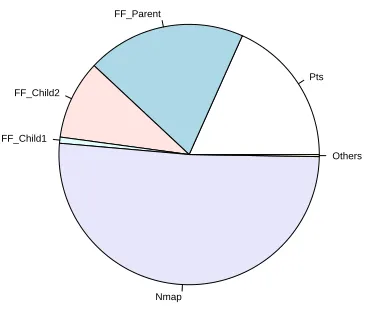
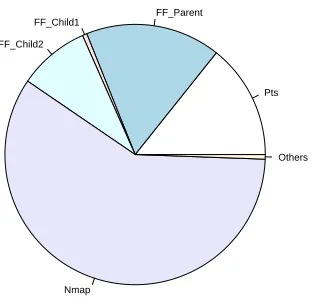
A number of false positives are shown through high MCAVs for the firefox process in the AN session, as shown in Figure 7. This in-dicates that the DCA has difficulty in separating concurrent normal and anomalous processes, when the analysis is based on the value of the MCAVs alone. However, the MCAV can be combined with the antigen confidence indicator. For example, in the AN experi-ment a total of 130,000 antigens are presented for analysis. Some 67000 of those antigens belong to the nmap process over the entire session, and can account for nearly 90% of the antigens produced when the nmap scan is highly active. In contrast, during periods of high nmap activity, the relative proportion of antigen presented belonging to the firefox process is under 10%. A combination of MCAV and antigen confidence indicatior can show not only how anomalous a process is deemed to be, but the level of confidence in the assessment. The greater the antigen input, the more times the antigen is sampled and the more accurate the MCAV. Charts repres-enting the relative proportions of antigen input and antigen output are shown in Figures 8 and 9 respectively. Combining the relative proportion of antigen output per process with the MCAVs may lead to fewer false positives and effective anomaly detection.
Additionally, reduction of false positives may be achieved through exploring the facets of the number of antigens used to derive the MCAVs per process. In these experiments 10000 antigens were
Pts FF_Parent
FF_Child2
FF_Child1
Nmap
Others
Figure 8: Proportionate chart of antigen per processes as input data for the active normal dataset
used for the calculation, but could be based on time or some other metric of system activity. As explored previously [4] the sampling DCs are sensitive to the length of time spent receiving signals in the tissue compartment. Longer sampling windows during low activity and shorter windows during high activity may make the detection more fine grained. Moving averages applied to the MCAV values over time may also alleviate this problem.
6.
CONCLUSIONS AND FURTHER WORK
The DCA is a new development in AIS, and as yet has not been extensively tested. This paper presents work towards understand-ing the behaviour of the algorithm when applied to larger realistic problems. Its unique methods of combining multiple signals and correlating the combined values with a separate antigen data-stream works well for the detection of SYN scans over a long duration. However, some impairments in performance were shown when at-tempting to classify a scanning process when run concurrently with other active user-driven processes. Due to the nature of the input data and the methods of correlation employed, it is difficult to com-pare the algorithm with other standard methods, though in future network packet analysis may be performed for the sake of com-parison. Additionally, individual signals alone are insufficient to produce successful classification based on both the volume of data and the amount of noise present in the input signals.
[image:7.612.63.292.118.265.2]ra-Pts FF_Parent
FF_Child1 FF_Child2
Nmap
[image:8.612.122.278.96.248.2]Others
Figure 9: Proportionate chart of antigen per processes as out-put data for the active normal dataset
dio data from space, or to mobile robotics. The results presented in this paper have shown that the DCA is capable of performing scan detection under difficult conditions through a unique form of immune inspired data fusion.
7.
ACKNOWLEDGMENTS
This project is supported by the EPSRC (GR/S47809/01). Graphic design by Mark Hammonds.
8.
REFERENCES
[1] U Aickelin, P Bentley, S Cayzer, J Kim, and J McLeod. Danger theory: The link between ais and ids. InProc. of the Second Internation Conference on Artificial Immune Systems (ICARIS-03), pages 147–155, 2003.
[2] U. Aickelin, J. Greensmith, and J. Twycross. Immune system approaches to intrusion detection - a review. InProc. of the Second Internation Conference on Artificial Immune Systems (ICARIS-03), pages 316–329, 2004.
[3] Stephanie Forrest, Steven A. Hofmeyr, Anil Somayaji, and Thomas A. Longstaff. A sense of self for Unix processes. In
Proceedinges of the 1996 IEEE Symposium on Research in Security and Privacy, pages 120–128. IEEE Computer Society Press, 1996.
[4] J. Greensmith, U. Aickelin, and S. Cayzer. Introducing dendritic cells as a novel immune-inspired algorithm for anomaly detection. InICARIS-05, LNCS 3627, pages 153–167, 2005.
[5] J. Greensmith, U. Aickelin, and J. Twycross. Articulation and clarification of the dendritic cell algorithm. In
ICARIS-06, LNCS 4163, pages 404–417, 2006.
[6] J. Greensmith, J. Twycross, and U. Aickelin. Dendritic cells for anomaly detection. InIEEE Congress on Evolutionary Computation(CEC 2006), pages 664–671, 2006.
[7] S Hofmeyr.An immunological model of distributed detection and its application to computer security. PhD thesis, University Of New Mexico, 1999.
[8] J Kim and P J Bentley. Towards an artificial immune system for network intrusion detection: An investigation of clonal selection with a negative selection operator. InProceeding of the Congress on Evolutionary Computation (CEC-2001), Seoul, Korea, pages 1244–1252, 2001.
[9] M.B. Lutz and G. Schuler. Immature, semi-mature and fully mature dendritic cells: which signals induce tolerance or immunity?Trends in Immunology, 23(9):991–1045, 2002. [10] P. Matzinger. Tolerance, danger and the extended family.
Annual Reviews in Immunology, 12:991–1045, 1994. [11] T.R. Mosmann and A.M. Livingstone. Dendritic cells: the
immune information management experts.Nature Immunology, 5(6):564–566, 2004.
[12] nmap. http://www.insecure.org.
[13] M. Roesch. Snort - lightweight intrusion detection for networks. InLISA ’99: Proceedings of the 13th USENIX conference on System administration, pages 229–238, Berkeley, CA, USA, 1999. USENIX Association. [14] T Stibor, P Mohr, J Timmis, and C Eckert. Is negative
selection appropriate for anomaly detection? InProceedings of Genetic and Evolutionary Computation Conference (GECCO)Washington DC. USA., pages 321–328, 2005. [15] J. Twycross.Integrated Innate and Adaptive Artificial
Immune Systems Applied to Process Anomaly Detection. PhD thesis, University Of Nottingham, 2007.
[16] J. Twycross and U. Aickelin. libtissue - implementing innate immunity. InCongress on Evolutionary Computation (CEC-2006), pages 499–506, 2006.