Manuscript version: Author’s Accepted Manuscript
The version presented in WRAP is the author’s accepted manuscript and may differ from the published version or Version of Record.
Persistent WRAP URL:
http://wrap.warwick.ac.uk/107530
How to cite:
Please refer to published version for the most recent bibliographic citation information. If a published version is known of, the repository item page linked to above, will contain details on accessing it.
Copyright and reuse:
The Warwick Research Archive Portal (WRAP) makes this work by researchers of the University of Warwick available open access under the following conditions.
© 2018, Elsevier. Licensed under the Creative Commons Attribution-NonCommercial-NoDerivatives 4.0 International http://creativecommons.org/licenses/by-nc-nd/4.0/.
Publisher’s statement:
Please refer to the repository item page, publisher’s statement section, for further information.
On the investigation of thermal/cooling-gel biphasic systems
1based on hydroxypropyl methylcellulose and hydroxypropyl
2starch
34
Yanfei Wanga,b,c, Long Yub,*, Fengwei Xied,e,f,†, Sheng Lic, Qingjie Suna, Hongsheng Liub, Ling 5
Chenb 6
7
aCollege of Food Science and Engineering, Qingdao Agricultural University, Qingdao, Shandong 266109,
8
China
9
bCollege of Food Science and Engineering, South China University of Technology, Guangzhou, Guangdong
10
510640, China
11
cCSIRO, Manufacturing Flagship, Bayview Avenue, Clayton, Vic 3168, Australia
12
d Institute of Advanced Study, University of Warwick, Coventry CV4 7HS, United Kingdom 13
e International Institute for Nanocomposites Manufacturing (IINM), WMG, University of Warwick, Coventry 14
CV4 7AL, United Kingdom
15
f
School of Chemical Engineering, The University of Queensland, Brisbane, Qld 4072, Australia
16
17
18
Abstract
19
This work investigates the rheology, structure, and properties of novel thermal/cooling-gel 20
biphasic systems formed by hybridization of hydroxypropyl methylcellulose (HPMC) as a thermal 21
gel and hydroxypropyl starch (HPS) as a cooling gel. Due to the different gelation properties, HPS 22
became the dispersed phase in the other continuous phase at low temperatures, and so did HPMC at 23
high temperatures. However, the dispersed phase could play a dominant role in the viscosity, 24
thixotropy, and gel properties of the blends, and subsequently affect the crystalline structure, fractal 25
structure, mechanical properties, oxygen permeability, and thermal stability of the blend films. 26
Moreover, the rheological properties and the film structure and performance could also be varied by 27
the chemical modification of starch. Hydroxypropylation could break the starch intermolecular 28
hydrogen bonding, disrupt its ordered structure, inhibit the molecular rearrangement, and result in a 29
softer gel texture that was more compatible with HPMC. With a higher degree of hydroxypropyl 30
substitution, the resultant blend films were more amorphous and flexible but exhibited decreased 31
mechanical properties and oxygen permeability. The knowledge obtained from this work could 32
provide guidance to further developing various thermal/cooling-gel multi-phasic systems with 33
desired properties and functionality. 34
35
Keywords: hydroxypropyl methylcellulose; hydroxypropyl starch; rheological properties; films;
36
mechanical properties; oxygen barrier property 37
1
Introduction
39
The blending of two or more polymers has been considered as one of the most cost-effective 40
methods to modify the bulk properties of individual polymers, achieve enhanced and/or new material 41
properties, reduce costs, and to expand the applications of polymer materials (Taguet et al., 2014; 42
Wang et al., 2016a; Wang et al., 2016b). 43
Hydroxypropyl methylcellulose (HPMC), a derivative of cellulose, the richest natural polymer on 44
the Earth, has good water solubility and biodegradability, and excellent film-forming, mechanical 45
and barrier properties. Therefore, HPMC has been extensively used in food packaging, medicinal 46
capsules, and other drug delivery systems (Imran et al., 2014; Zhang et al., 2017a; Zhang et al., 2015; 47
Zhang et al., 2017b). However, the high prices of HPMC limit its general applications, even for use 48
in therapeutic delivery systems (Wang et al., 2016a; Wang et al., 2016b; Zhang et al., 2013b; Zhang 49
et al., 2013c). Regarding this, starch, which is widely used in food industry, can be a cheap material 50
to decrease the price of HPMC. Native starch is a storage carbohydrate of plants and usually 51
modified by chemical or physical methods to improve its processability and properties and to widen 52
its applications (Adak and Banerjee, 2016; Lee and Yoo, 2011; Luallen, 2004; Masina et al., 2017). 53
Hydroxypropyl starch (HPS) is a typical chemically modified starch and is an inexpensive material 54
being widely used in the food industry (Wang et al., 2016a; Zhang et al., 2015). Therefore, the 55
commercial potential of HPMC/HPS is foreseeable for a broad range of applications such as food 56
packaging, food, and medicines. 57
Edible materials from natural polymers can be easily produced via a wet process (Cuq et al., 58
1998). It is based on a film-forming solution or dispersion where polymers are first solubilized or 59
dispersed into a liquid phase, which is then concentrated with the removal of the liquid (usually by 60
drying at a higher temperature). This process is generally preferred to form edible pre-formed films, 61
or to apply coatings in the liquid form directly onto products by dipping, brushing, or spraying. The 62
film-forming solutions or dispersions, which play an important role in controlling the defects in the 64
thin films after coating (Peressini et al., 2003). 65
It is well known that both HPMC and HPS can form hydrogels, but their gelation behaviors are 66
quite different. HPMC is a thermal gel that forms a hydrogel at a higher temperature and its gel 67
disaggregates at a lower temperature, which is distinctly different from the conventional hydrogels 68
such as gelatin (Dhillon and Seetharaman, 2011; Haque et al., 1993; Liu et al., 2008). The widely-69
accepted gelation mechanism of HPMC regards the intermolecular association of hydrophobic 70
groups on the polymer chains, leading to crosslinking and gel formation (Haque and Morris, 1993; 71
Haque et al., 1993; Li, 2002; Viriden et al., 2010). As the film-forming solutions need to be dried at a 72
higher temperature, the thermal-gelation property can cause much difficulty in fabricating HPMC 73
films. Regarding this issue, HPS has shown to be able to decrease the gelation point of HPMC since 74
it has a cooling-gelation property (Zhang et al., 2015). The mechanism of the gelation of HPS relates 75
to the formation of a three-dimensional network by interchain hydrogen bonding during the cooling 76
process. Meanwhile, research has shown that HPMC can also influence the gelation property of 77
starch (Correa et al., 2010; Kadokawa et al., 2009; Rosell et al., 2011). Therefore, for practical 78
applications, it is fundamentally important to thoroughly understand the gelation and rheological 79
properties of the thermal/cooling-gel bi-phasic systems based on HPMC/HPS. 80
It is known that a small change in chemical structure of starch can result in dramatic changes in 81
their rheological properties. Thus, chemical modification further provides the possibilities to improve 82
and control the rheological properties of the final bi-phasic systems involving starch (Chun and Yoo, 83
2007). In turn, the understanding of the changes in rheological properties of starch caused by 84
chemical modification is helpful in understanding the structural properties and can also assist in the 85
design of modified starches with improved properties (Lee and Yoo, 2011). HPS is generally 86
prepared by etherification of native starch with propylene oxide in the presence of an alkaline 87
the starch chains, they weaken or disrupt the internal hydrogen bonding that maintains the whole 89
granule structure. Therefore, the physicochemical properties of starch could be influenced by 90
hydroxypropylation depending on the molar substitution (MS) (Lee and Yoo, 2011; Moin et al., 91
2017; Schmitz et al., 2006; Woggum et al., 2015). 92
While the physicochemical properties of HPS with different MS has been concerned in many 93
studies (Han et al., 2005; Kaur et al., 2004; Lawal et al., 2008; Schmitz et al., 2006), much less 94
attention (Chun and Yoo, 2007; Lee and Yoo, 2011; Ren et al., 2017) has been paid to the 95
rheological and gel properties of HPS, as well as the material structure properties of the blends that 96
contain HPS. In this work, HPS with different MS was added to HPMC to prepare HPMC/HPS 97
blends. The rheological properties and the film structure and performance of HPMC/HPS blends 98
were examined as a function of MS. The knowledge obtained from this work would be vital to 99
understanding the mechanistic relationship between structural modification and properties of the 100
novel thermal/cooling-gel bi-phasic systems. 101
102
2 Materials and method
103
2.1 Materials 104
A commercially available pharmaceutical-grade HPMC (HT-E15, from HopeTop Pharmaceutical 105
Company, China: viscosity (2%), 6.3 mPa·s; pH 6.0; methoxyl content on the dry basis, 29%; 106
hydroxypropyl oxygen content on dry basis 8.4%) was used in this work. Three food-grade 107
hydroxypropylated corn starches (G80, A939, and A1081) with different MSs (the average amount 108
of hydroxypropyl per unit mole of glucose) (0, 0.04, and 0.11, respectively) were supplied by 109
Penford (Australia). 110
2.2 Film preparation 112
For rheological measurement, solutions of 15 wt.% concentration containing HPMC/HPS of 113
different ratios (100/0, 50/50, 0/100) were prepared. For the preparation of these solutions, HPMC 114
and HPS (dry powder) were firstly mixed. Then, the mixtures were dispersed in hot water (70 °C) 115
with stirring for 30 min to ensure a proper distribution of HPMC in the solutions. Afterwards, the 116
solutions were heated to 95 °C and maintained for 1 h to gelatinize HPS in a water bath. For G80, the 117
solutions were gelatinized in a high-pressure reactor at 1500 psi (103 bar) and 110 °C for 30 min 118
instead, since its gelatinization temperature is higher than 100 °C (Liu et al., 2006). The solutions 119
were cooled down to room temperature to dissolve HPMC under stirring before testing. 120
For film preparation, solutions of 8 wt.% concentration were added with 2.4% PEG as a 121
plasticizer. Solutions were kept at 70 °C for 40 min with slow continuous stirring before film casting. 122
For film casting, 20 g of solutions were poured onto a Petri dish (15 cm diameter) and then dried at 123
37 °C. The dry films were peeled off from the dishes and kept under 75% RH at 25 °C for at least 124
three days before further characterization. 125
126
2.3 Rheological measurement 127
The rheological properties of samples were investigated using a Discovery HR-2 rheometer (TA 128
Instruments, New Castle, DE, USA). A parallel-plate geometry (60 mm diameter) with the gap set at 129
1.0 mm was used for the measurements. 130
Flow patterns were used to understand the steady rheological properties and thixotropy. At a 131
constant shear treatment, the viscosity of a polymer may vary with time before a stable value could 132
be achieved (Tajuddin et al., 2011). As a result, pre-shearing with a shear rate of 800 s−1 at room 133
temperature (25 °C) for 1000 s was performed to ensure all the samples to achieve a stable state 134
increased from zero to 1000 s−1 for 1 min, then kept at 1000 s−1 for 1 min, and finally decreased to 136
zero for another 1 min. The curve of shear stress (τ) vs. shear rate (𝛾̇) corresponds to the equation: 137
138
𝜏 = 𝐾𝛾̇𝑛 (1)
139
140
From this equation, the fluid consistency index (K) and flow behavior index (n) can be calculated. 141
Small-amplitude oscillatory shear tests were used to explore the dynamic rheological properties. 142
To obtain the linear range of viscoelasticity, strain sweep measurements were performed from 0.01% 143
to 100% at a frequency of 1 Hz at 25 °C. Temperature sweeps involved heating from 5 °C to 85 °C, 144
holding at 85 °C for 5 min, and then cooling to 5 °C. A heating/cooling rate of 2 °C/min was used. 145
The frequency was set at 1 Hz and the strain at 0.1% (to be in the linear range of viscoelasticity). The 146
sample was placed between the parallel plates, and then a small amount of silicone oil was applied to 147
the periphery of the sample to prevent moisture evaporation. Frequency sweeps from 1 rad/s to 148
100 rad/s were also performed after isothermal equilibration for 5 min at both 5 °C and 85 °C. The 149
strain was set at 0.1% (to be in the linear range of viscoelasticity). Storage modulus (G′), loss 150
modulus (G″), and tan δ were recorded. The frequency-dependence of G′ and G″ can be shown in the 151
following power-law equations: 152
153
𝐺′ = 𝐺0′𝜔𝑛′ (2) 154
𝐺′′ = 𝐺 0′′𝜔𝑛
′′
(3)
155
156
From these equations, the slopes (n′ and n″) and intercepts (G0′ and G0″) of log G′–log ω and log G″–
157
log ω can be calculated. 158
The thixotropy was probed with three-interval thixotropic tests. The tests were carried out at 159
kept at 1000 s−1 for 20 s, then a structural recovery stage with shear rate kept at 1 s−1 for 250 s. The 161
structural recovery ratio (DSR) can be defined by the equation: 162
163
𝐷𝑆𝑅 = 𝜂𝑡⁄ × 100%𝜂 (4) 164
165
Here, ηt is the viscosity in the structural recovery stage at a certain time (t) and η is the final viscosity 166
in the first stage. 167
168
2.4 Synchrotron small/wide angle X-ray scattering (SAXS/WAXS) 169
Synchrotron small/wide-angle X-ray scattering (SAXS/WAXS) measurements were carried out 170
on the SAXS/WAXS beamline (flux, 1013 photons per second) at the Australian Synchrotron 171
(Clayton, Vic, Australia) at a wavelength λ = 1.47 Å. The 2D scattering patterns were collected using 172
a Pilatus 1M camera (active area, 169 × 179 mm; and pixel size, 172 × 172 μm). The scatterBrain 173
software was used to acquire the one-dimensional (1D) data from the 2D scattering pattern, and the 174
data in the angular range of 0.015 < q < 0.15 Å−1 and 0.095 < q < 2 Å−1 were used as the SAXS and 175
WAXS pattern, respectively, where q = 4πsinθ/λ, in which 2θ is the scattering angle and λ is the X-176
ray wavelength. All data were normalized, and the background intensity and smeared intensity were 177
removed for further analysis. 178
179
2.5 Mechanical properties 180
Tensile properties were evaluated in accordance with the ASTM D5938 standard using an Instron 181
tensile testing apparatus (5565). Tensile strength (σt), elongation at break (εb) and Young’s modulus
182
(E) were measured at a crosshead speed of 10 mm/min. Seven specimens were tested for each 183
185
2.6 Oxygen permeability (OP) 186
Oxygen transmission rates of the films were measured by Mocon OXTRAN® 2/21H Master 187
(MH) and Satellite (SH) systems (Mocon Inc., Minneapolis, MN) according to the ASTM D-3985 188
standard. The exposure area for testing was 50 cm2 for each sample. 189
190
2.7 Thermogravimetric analysis (TGA) 191
Thermal stability of the samples was evaluated using a PerkinElmer Pyris 1 TGA system. 192
Samples were heated from 30 °C to 700 °C at 10 °C/min in a nitrogen atmosphere. 193
194
3 Results and Discussions
195
3.1 Rheological properties of film-forming solutions 196
3.1.1 Steady rheological properties
197
The pre-shearing carried out before the real shearing test was to ensure the samples to achieve a 198
homogeneous and stable state so that the effect of time could be eliminated. Fig. 1 shows the effect 199
of shear rate on the viscosity of the HPMC/HPS solution with different MSs of HPS. It can be seen 200
that the viscosity of all the samples decreased with increasing shear rate and showed a shear-thinning 201
behavior. Under shear force, most polymer solutions of high concentrations will undergo significant 202
disentanglement and molecule rearrangement, showing a pseudoplastic behavior (Heyman et al., 203
2014; Zhang et al., 2015). For pure HPS, the viscosity was higher and the shear-thinning behavior 204
was stronger than for the blends, whereas pure HPMC showed the lowest viscosity and the least 205
viscosity was much lower than that of HPS. The addition of HPMC decreased the shear-thinning 207
behavior of HPS. Besides, with a higher MS of HPS, the viscosity of the HPMC/HPS solution at a 208
fixed blend ratio displayed a reduced viscosity. This can be explained by the reduced intermolecular 209
hydrogen bonding because of hydroxypropylation. In the low-shear stage, there was a stable-value 210
region in the samples containing HPS with a high MS, and the stable-value region was narrowed 211
with the addition of HPMC. 212
213
214
10-1
100
101
102
103 10-1
100 101 102 103
A939 A1081 A939-HPMC A1081-HPMC HPMC
V
is
co
sit
y (
P
a
.s
)
Shear rate (1/s)
[image:11.595.62.290.289.463.2]215
Fig. 1. Viscosity vs. shear rate curves for the solutions of HPMC, HPSs with different MSs, and 216
HPMC/HPS blends with the different HPSs at 25 °C (with pre-shearing) 217
218
219
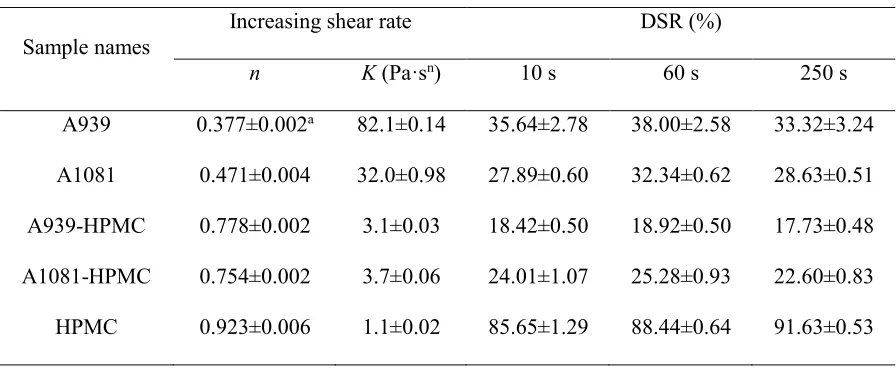
Table 1 lists the n (flow behavior index) and K (fluid consistency index) values for the different 220
samples calculated in the shear rate range of 10−1–103 1/s. For all the samples, n was less than 1, 221
indicating that they are all pseudoplastic fluids. With a higher HPMC content, HPMC/HPS blends 222
displayed a higher n value, suggesting an enhanced Newtonian behavior. However, K (proportional 223
to viscosity) was decreased with a higher amount of HPMC. For pure HPS, both n and K were 224
decreased with a higher MS of HPS, meaning hydroxypropylation can improve the pseudoplasticity 225
with the increased MS of HPS, which shows the effect of starch hydroxypropylation on the overall 227
rheological behavior of the blends. 228
According to blending principle, the smaller the difference in viscosity between two phases, the 229
greater is the compatibility between two components (Larson, 1999). HPMC showed a Newton-like 230
liquid (n close to 1) at low temperatures. Therefore, in this study, a higher n value of HPS suggests 231
better compatibility in the blends. 232
233
3.1.2 Dynamic rheological properties
234
3.1.2.1 Linear viscoelastic regions 235
It is well known that for a hydrogel, G′ is controlled by the hardness, junction zone strength, and 236
bonds quantities of effective molecular chains. In addition, G″ is contributed by the friction energy 237
consumption in a liquid state, which involves the mobility, movement and friction of small 238
molecules, and the vibration and rotation of functional groups. The crossover of G′ and G″ (tan δ = 239
1) indicates the sol-gel transition. G′ and G″ can be used to detect the gelation behavior, the speed of 240
gel network formation, and structural characteristics (Clark and Ross-Murphy, 1987). They also 241
reflect the inner structural development and molecular interactions during the gel network formation 242
(Musampa et al., 2007). 243
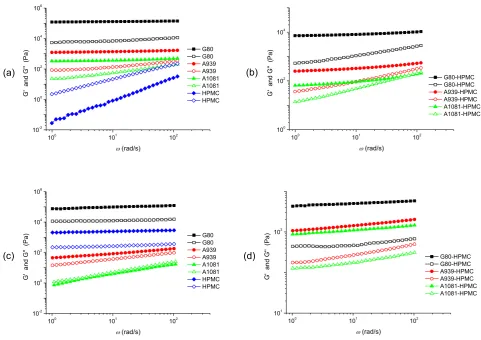
Fig. 2 shows the results from strain sweep measurements performed over a strain range of 0.01– 244
100% at a frequency of 1 Hz. It can be seen that at low strains (0.01–1%), all the samples except 245
HPMC were gel (G′ > G″). For HPMC, G′ was always lower than G″ in the test range, indicating 246
HPMC was a solution. Besides, different samples had viscoelasticity that had different degrees of 247
dependence on strain. For G80, this dependence was more apparent — when the strain was higher 248
increase in tan δ. Moreover, a crossover of G′ and G″ was observed for G80 at a strain of 1.7%. This 250
means that G80 became a solution when the strain was over 1.7%. 251
252
253
254
[image:13.595.48.534.187.550.2]255
Fig. 2. Strain sweep curves for the solutions of HPMC, HPSs with different MSs, and HPMC/HPS 256
blends with the different HPSs at a frequency of 1 Hz at 25 °C. In (a) and (b), the solid and hollow 257
symbols represent G′ and G″, respectively. 258
259
260
For HPS, the linear viscoelastic region was narrowed with a lower MS. In other words, with the 261
increased MS, the sudden change in tan δ occurred at a higher strain. G80 had the smallest 262 10-2 10-1 100 101 102 103 100 101 102 103 104 105 (a) G80 G80 A939 A939 A1081 A1081 HPMC HPMC G' an d G'' (P a) 10-2 10-1 100 101 102 103 100 101 102 103 104 105
(b) G80-HPMC
viscoelastic range among all the samples. This value was taken into consideration for the choice of 263
strain in the following studies. 264
For HPMC/HPS blends, the linear viscoelastic region was also narrowed with a lower MS, 265
although this MS-induced narrowing of the linear viscoelastic region became less apparent. 266
267
3.1.2.2 Viscoelastic property during heating and cooling 268
Fig. 3 shows the dynamic viscoelastic properties of HPMC, HPS samples with different MSs, 269
and HPMC/HPS blends with different HPSs. It can be seen that for HPMC, there were four regions 270
during heating, namely a plateau, two structural formation stages, and then another plateau. During 271
the first plateau, G′ was below G″ and both of them were very small and decreased slowly with 272
increasing temperature. This indicates a common viscoelastic behavior of a liquid. The thermal 273
gelation of HPMC had two distinct stages of the structural formation and the divide was the 274
crossover of G′ and G″ (i.e., the sol-gel transition at ca. 49 °C), which was consistent with other 275
reports (Haque and Morris, 1993; Haque et al., 1993). At higher temperatures, due to the association 276
of hydrophobic groups and that of hydroxyl groups, a crosslinked network was gradually formed 277
(Chen, 2007; Dziesak, 1991; Schmitz et al., 2006). The last plateau with higher G′ and G″ indicates 278
the eventual formation of a gel network. 279
280
282
283
284
0 20 40 60 80 10-2
100
102
104
106
80 60 40 20 0
G' an d G'' (P a)
Temperature (o
C) Tan G'' G' 10-2 10-1 100 101 102 103 HPMC Ta n
0 20 40 60 80 10-2
100
102
104
106
80 60 40 20 0 Tan G ' and G '' (P a)
Temperature (o
C) G'' G80 G' 10-2 10-1 100 101 102 103 Ta n
0 20 40 60 80 10-2
100
102
104
106
80 60 40 20 0 Tan G'' G' G' an d G '' (P a)
Temperature (oC)
10-2 10-1 100 101 102 103 G80-HPMC Ta n
0 20 40 60 80 10-2
100
102
104
106
80 60 40 20 0
A939 G'' Tan G' G' an d G'' (P a)
Temperature (o
C) 10-2 10-1 100 101 102 103 Ta n
0 20 40 60 80 10-2
100
102
104
106
80 60 40 20 0
G' an d G'' (P a)
Temperature (oC)
285
Fig. 3. Storage modulus (G′), loss modulus (G″) and tan δ vs. temperature curves for the solutions of
286
HPMC, HPSs with different MSs, and HPMC/HPS blends with the different HPSs. 287
288
289
With decreasing temperature, the sequence of these regions was reversed. The crossover of G′ 290
and G″ shifted to a lower temperature of about 32 °C during cooling. This shift could be due to 291
hysteresis (Haque and Morris, 1993) and/or the condensation of chains at a lower temperature (Chen, 292
2007; Zhang et al., 2015). Like HPMC, most of the other samples displayed these four regions 293
during heating, which were reversed during cooling. However, we can see that G80 and A939 294
showed a simpler pattern with no crossover of G′ and G″. G80 even did not reach any plateau finally. 295
For HPS, a higher MS could shift both the starting and end temperatures for the structural 296
formation (gelation). Specifically, the starting temperatures of G80, A939 and A1081 were 61 °C, 297
62 °C and 54 °C, respectively. Besides, the higher the MS, the lower were both G′ and G″, which 298
was in agreement with other studies (Kim et al., 1992a; Kim et al., 1992b). This suggests that the gel 299
texture became softer with the increased MS. Regarding this, the ordered structure of starch was 300
disrupted, and its hydrophilicity was increased when native starch was hydroxypropylated 301
(Morikawa and Nishinari, 2000). 302
0 20 40 60 80 10-2
100
102
104
106
80 60 40 20 0
G' an d G'' (P a)
Temperature (o
C) G' G'' Tan 10-2 10-1 100 101 102 103 A1081 Ta n
0 20 40 60 80 10-2
100
102
104
106
80 60 40 20 0 Tan G'' G' G ' and G'' (P a)
Temperature (o
For all the blends, both G′ and G″ were decreased with a higher MS of HPS, which was 303
consistent with results for pure starches. Also, the effect of MS on both G′ and G″ for the blends 304
became less apparent with the addition of HPMC. 305
All the blend samples showed a similar pattern of viscoelastic properties, which was parallel to 306
those for HPS at low temperatures and HPMC at high temperatures. In other words, HPS controlled 307
the viscoelastic property of the blends at low temperatures whereas HPMC dominated the behavior at 308
high temperatures. These results might be accounted for by the different gelation properties of HPS 309
and HPMC. Specifically, HPS is a cooling gel, shifting from gel to sol during heating. In contrast, 310
HPMC, as a thermal gel, congeals with increasing temperature. For HPMC/HPS blends, at low 311
temperatures, HPS mainly contributed to the gelation, while at high temperatures, HPMC was 312
responsible for the gel formation. 313
The blends had intermediate moduli between those for individual HPS and HPMC. Besides, G′ 314
was always higher than G″ during the whole temperature range. In this regards, both HPS and 315
HPMC could individually form intermolecular hydrogen bonding with water and with each other. 316
Furthermore, all the blends showed a tan δ peak at about 45 °C, suggesting a change of the 317
continuous phase in the matrix. 318
319
3.1.2.3 Dynamic mechanical properties 320
Fig. 4a and b show the moduli (G′ and G″) vs. frequency results at 5 °C for HPMC, HPSs with
321
different MSs, and HPMC/HPS blends with different HPSs. All the HPS samples showed a typical 322
like behavior (G′ > G″), whereas HPMC was fluid-like (G′ < G″). All the blends had a solid-323
like behavior. For most of the samples, a higher frequency led to higher G′ than G″, indicating the 324
materials were more solid-like. 325
326
100 101 102
100
102
104
(b) G80-HPMC
G80-HPMC A939-HPMC A939-HPMC A1081-HPMC A1081-HPMC G' an d G'' (P a) (rad/s) 328
100 101 102
101
103
(d) G80-HPMC
[image:18.595.51.533.84.424.2]G80-HPMC A939-HPMC A939-HPMC A1081-HPMC A1081-HPMC G' an d G'' (P a) (rad/s) 329
Fig. 4. Storage modulus (G′) and loss modulus (G″) vs. frequency curves for HPMC, HPSs with
330
different MSs, and HPS/HPMC blends with the different HPSs at 5 °C (a and b) and 85 °C (c and d). 331
The closed and open symbols correspond to G′ and G″, respectively. 332
333
334
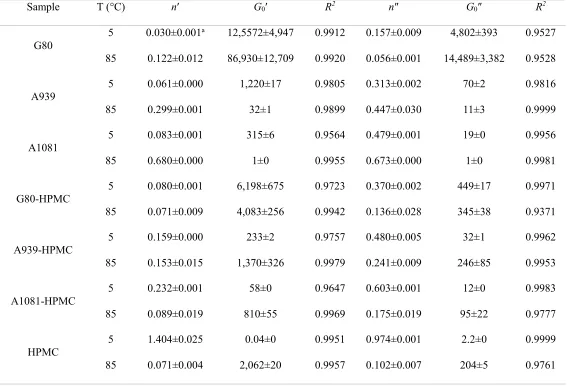
Table 2 lists the n′, n″, G0′ and G0″ values for different samples at 5 °C. For all the HPS samples,
335
n′ was close to 0, and G0′ was much higher than G0″, confirming their solid- like behavior
(Ortega-336
Ojeda et al., 2004). HPMC showed clearly a fluid-like behavior since the slopes were close to 1. For 337
the blends, n′ and n″ were slightly higher than those for HPSs, suggesting that the blends behaved 338
less like a solid than HPSs. 339
HPMC showed an apparent frequency-dependence, whereas such a dependence could hardly be 340
observed for HPSs. The blends showed some degree of dependence on frequency. For all the 341
100 101 102
samples containing HPS, n′ was much lower than n″, and G″ was more dependent on frequency than 342
G′, suggesting that these samples were more elastic and less viscous (Clark and Ross-Murphy, 1987; 343
Park et al., 2004; Rosalina and Bhattacharya, 2002). Therefore, the properties of the blends were 344
mainly contributed by HPS. This was especially true considering HPMC was a liquid with a lower 345
viscosity at a lower temperature. 346
Both n′ and n″ for HPS were increased with a higher MS, indicating that hydroxypropylation 347
reduced the solid-like behavior of the starch and increased the frequency-dependence at low 348
temperatures. This trend regarding the effect of hydroxypropylation was also evident in the blend 349
samples. For both HPSs and the blends, G0′ and G0″ were also decreased with the increased MS of
350
HPS, which may be attributed to the weakened viscoelasticity of HPS as the main contributing 351
component. 352
Fig. 4c and d show the moduli (G′ and G″) vs. frequency results for HPSs with different MS,
353
HPMC, and HPMC/HPS blends with different HPSs at 85 °C. All HPSs, except A1081, showed 354
typical solid-like behavior. For A1081, G′ was very close to but lower than G″, indicating a fluid-like 355
behavior. This might be ascribed to the gel-sol transition of A1081 as a cooling gel at a high 356
temperature. On the other hand, an increased MS could decrease n′, n″, G0′ and G0″ (Table 2),
357
indicating that hydroxypropylation made the starch behave less like a solid at 85 °C. Specifically, for 358
G80, both n′ and n″ were close to 0, indicating its solid-like behavior. In contrast, for A1081, n′ and 359
n″ were close to 1, showing its fluid-like behavior. These results of n′ and n″ were also in accordance 360
with the G′ and G″ data. Furthermore, it can be seen in Fig. 4c and d that a higher MS significantly 361
increased the frequency-dependence of HPS. 362
Fig. 4c and d show that at 85 °C, HPMC had a typical solid-like behavior (G′>G″), which could
363
be ascribed to its thermal-gelation property. In addition, for HPMC both G′ and G″ were not 364
For all the blends, both n′ and n″ were close to 0, and G0′ was much higher than G0″ (Table 2),
366
confirming their solid-like behavior at 85 °C. On the other hand, while a higher MS could change the 367
behavior of HPS from being solid-like to liquid-like (as discussed above), this phenomenon was not 368
observed in the blends. Besides, for the blends containing HPMC, both G′ and G″ remained stable 369
with increased frequency. Moreover, for all the blends, n′ and n″ were close to those for HPMC. All 370
these results suggest that it was HPMC that mainly contributed to the properties of the blend gels at a 371
high temperature (85 °C). 372
373
3.1.3 Thixotropic property
374
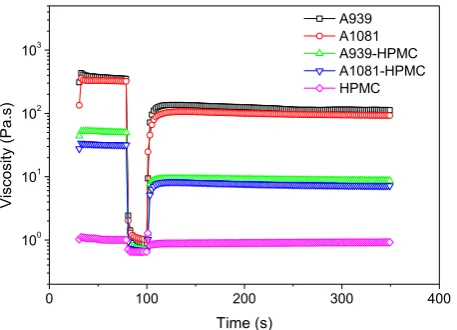
Fig. 5 shows a three-interval thixotropic behavior of the HPMC/HPS blend solutions with 375
different MSs of HPS. All the samples were thixotropic since the viscosity of the third stage (the 376
structural recovery stage) was lower than that of the first stage. At the low-shear stage (the first 377
stage), the solution viscosity was decreased with the increased content of HPMC and a higher MS of 378
HPS. These are consistent with the results of steady rheological properties. 379
380
382
Fig. 5. Three-interval thixotropic curves for the solution of HPMC, HPSs with different MSs, and 383
HPMC/HPS blends with the different HPSs at 5 °C. 384
385
386
The structural recovery data of three-interval thixotropic tests were listed in Table 2. A higher 387
structural recovery ratio (DSR) led to a weakened thixotropic behavior. The DSR values of pure 388
HPSs were obviously lower than that of pure HPMC in the same structural recovery time. Regarding 389
this, HPMC molecular chains were rigid with a short relaxation time, which means the structure 390
could recover within a short time. In contrast, HPS molecular chains were flexible and the relaxation 391
time was relatively long, thus the structural recovery of HPS was slow. For pure HPS, the DSR was 392
decreased with a higher MS, indicating that hydroxypropylation improved the flexibility of starch 393
molecular chains and prolonged the relaxation time of HPS. For the blend samples, the DSR values 394
were lower than those of pure ones, and increased with a higher MS of HPS. This result suggests that 395
the thixotropic behavior of the blends was weakened with the increased MS of HPS. 396
397
0 100 200 300 400
100 101 102 103
A939 A1081 A939-HPMC A1081-HPMC HPMC
V
is
co
sit
y (
P
a
.s
)
3.2 Characteristics of films 398
3.2.1 Crystalline structure
399
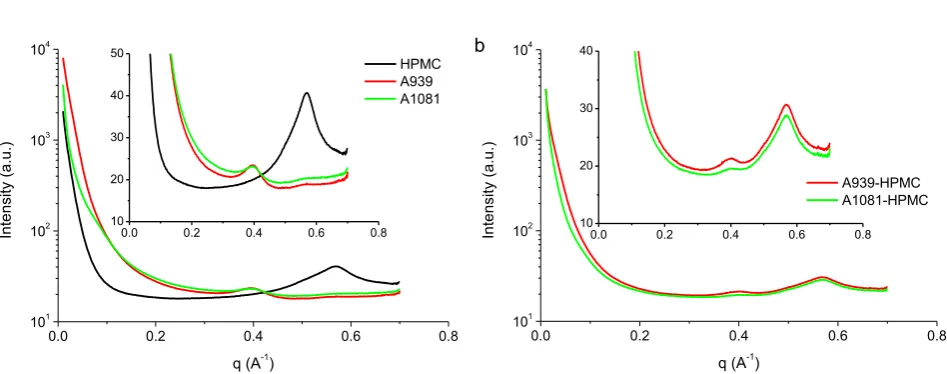
Fig. 6 shows the SAXS patterns of HPMC/HPS blend films. All the samples present apparent 400
characteristic peaks in a relatively larger scale range (q > 0.3 Å–1). From Fig. 6a, HPMC showed a 401
well-defined peak at about 0.569 Å–1, corresponding to its crystalline structure at 7.7°. In contrast, 402
HPSs showed a well-defined peak at about 0.397 Å–1, corresponding to the typical B-type crystalline 403
structure of starch at 5.3°. Besides, the characteristic peak area of A939 was higher than that of 404
A1081, suggesting that a higher MS led to a decreased characteristic peak area. Regarding this, the 405
incorporation of hydroxypropyl groups in the starch molecules may destroy the original crystalline 406
structure of starch, and make it less easy for intermolecular rearrangement and crosslinking, which 407
inhibit the recrystallization of starch. 408
409
410
[image:22.595.61.535.432.619.2]411
Fig. 6. SAXS patterns for the films of HPMC, HPSs with different MSs, and HPMC/HPS blends 412
with the different HPSs. 413
414
415
0.0 0.2 0.4 0.6 0.8
101 102 103 104 HPMC A939 A1081 In te n sit y ( a .u .)
q (A-1)
0.0 0.2 0.4 0.6 0.8
10 20 30 40 50 a
0.0 0.2 0.4 0.6 0.8
101 102 103 104 A939-HPMC A1081-HPMC In te n sit y ( a .u .)
q (A-1)
0.0 0.2 0.4 0.6 0.8
Fig. 6b shows the SAXS patterns of the blend films. All the blend samples showed two SAXS 416
peaks at about 0.569 Å–1 and 0.397 Å–1, corresponding to the characteristic peak of HPMC (at 7.7°) 417
and HPS (at 5.3°), respectively. The HPS characteristic peak area of HPMC/A939 was larger than 418
that of HPMC/A1081, attributed to the inhibition of orderly rearrangement between starch molecules 419
due to the increase of hydroxypropylation. This relationship between the peak area and the MS of 420
HPS corresponds to that in pure HPS. On the other hand, the area of the characteristic peak of HPMC 421
at 7.7° did not show apparent changes with the variation in MS. Moreover, compared with the 422
corresponding pure samples, both the HPMC and HPS characteristic peak areas for the blends were 423
smaller. This observation indicates that both HPMC and HPS could inhibit the recrystallization of 424
the other component to a certain degree in the blends. 425
426
3.2.2 Fractal structure
427
Fractal geometry has been used as a natural description for disordered objects possessing dilation 428
symmetry, meaning that they look geometrically self-similar under transformation of scale such as 429
changing the magnification of a microscope. The fractal dimension (D) can be calculated according 430
to the Porod equation: 431
432
I(q) ∝ 𝑞−𝛼 (5) 433
434
where I is the SAXS intensity and α is an exponent called the Porod slope. The relation between α 435
and D follows Dm = α (α < 3) representing a mass fractal, or Ds = 6 – α (3 < α < 4) indicating a
436
surface fractal. Dm is used to indicate the compactness while Ds can be regarded as an indicator of
437
the degree of smoothness (Zhang et al., 2013a). For polysaccharides such as starch and cellulose, the 438
work, the Porod slopes α of all samples are below 3 and thereby Dm = α, which we called D in the
440
following text. 441
Fig. 7 shows the lnI(q)–lnq patterns and its fit curves for HPMC/HPS blend films. All the 442
samples were seen to have a self-similar fractal structure within a certain limit. All the Porod slopes 443
were smaller than 3, indicating HPMC/HPS films had a smooth surface. The fractal structure 444
parameters of HPMC/HPS blend films were provided in Table 3. When pure HPS was concerned, 445
the D value of A939 was higher than that of A1081, suggesting the density of the self-similar 446
structure in the films decreased with a higher MS. Regarding this, the incorporation of 447
hydroxypropyl groups in starch molecules prevented the association of HPS chains and led to a self-448
similar structure with a lower density. The hydrophilic hydroxypropyl groups could form 449
intermolecular hydrogen bonding with water, thus the interaction between HPS chains was lessened. 450
The bulky hydroxypropyl groups could also limit the reassociation and crosslinking of starch 451
molecular chains. Therefore, the self-similar structure of HPS films became looser with the increased 452
MS of HPS. 453
454
456
Fig. 7. lnI(q)–lnq patterns and their fit curves for the films of HPMC, HPSs with different MSs, and 457
HPMC/HPS blends with the different HPSs. 458
459
460
The D value of pure A939 was higher than that of pure HPMC. This higher D value of pure A939 461
could be attributed to the starch recrystallization, the more ordered structure between starch 462
molecular chains, and a self-similar structure with a higher density that were formed in its films. The 463
D value of the HPMC/A939 blend was the lower than either pure A939 or pure HPMC, as blending 464
could hamper the chain association of individual components and reduce the density of the self-465
similar structure of the starch. 466
In contrast, for HPMC/A1081, the D value of A1081 was lower than that of HPMC. This might 467
be due to the inhibition of the starch retrogradation with the incorporation of hydroxypropyl groups, 468
thus the self-similar structure in the film became looser. The D value of the HPMC/A1081 blend was 469
higher than that of pure A1081, which is different from the case of the HPMC/A939 system. 470
Regarding this, the HPS with a high MS could possibly form a self-similar structure with larger 471
cavities, and the linear HPMC molecules could enter the cavities resulting in a higher density of the 472
self-similar structure. This also implies that a more homogeneous compound could be formed by 473
HPMC and HPS with a high MS. In agreement with this, the rheological results have shown that 474
-4 -3 -2 -1
2 4 6 8 10
HPMC A939 A1081
ln
I
(
a
.u
.)
ln q (A-1)
-4 -3 -2 -1
2 4 6 8 10
A939-HPMC A1081-HPMC
ln
I
(
a
.u
.)
hydroxypropylation could reduce the viscosity of starch and the viscosity difference between the two 475
components in the blends, which is favorable for forming more homogeneous blends. 476
477
3.2.3 Tensile properties
478
The E, σt and εb of HPMC/HPS films were listed in Table 4. For pure HPS films, a higher MS of
479
HPS led to lower E and σt and higher εb, indicating that hydroxypropylation reduced the film rigidity
480
and improved the flexibility. Given this, the hydroxypropyl groups might have resulted in a looser 481
film structure (as confirmed by the fractal structure results) and inhibited the starch retrogradation (as 482
shown by the crystallinity analysis). 483
For the blend films, increasing the MS of HPS led to decreased E and increased σt and εb. The
484
change in the MS of HPS could vary not only the properties (viscosity and mechanical properties) of 485
HPS itself but also the compatibility between the two polymers. A higher MS could result in a lower 486
viscosity of the HPS, which could improve the compatibility between HPS and HPMC. On the other 487
hand, for HPMC/A1081 blends, with the increased content of the starch, E and σt were decreased,
488
whereas εb was increased apparently. This result is in agreement with a previous study (Wang et al.,
489
2016a) and suggests that a higher degree of hydroxypropylation may decrease the intermolecular 490
interactions and thus the mechanical properties. 491
492
3.2.4 Oxygen permeability
493
Edible films with a good oxygen barrier property can help to improve food quality and extend 494
food shelf life since that the oxidation caused by oxygen is an initial stage of several forms of food 495
deterioration (Klangmuang and Sothornvit, 2016). Thus, we studied the oxygen permeability (OP) of 496
HPMC/HPS films with the varied MS of HPS and the results are provided in Table 5. It is seen that 497
the better oxygen barrier property of starch films (Ortega-Toro et al., 2014; Wang et al., 2016a). For 499
pure HPS films, the content of hydroxypropyl groups had a significant effect on the oxygen barrier 500
property. The OP of A1081 (0.64) was almost six times that of A939 (0.11). The OP increased with a 501
higher MS of HPS. Regarding this, as confirmed by the fractal structure results, the incorporation of 502
hydroxypropyl groups declined the density of films, which could enlarge the permeability channel 503
for oxygen in the film. 504
For the blend films, the OP was decreased with a higher MS of HPS, which is opposite to the 505
case of pure HPS. In the HPMC/HPS (5:5) blend, the HPS with a higher viscosity was dispersed in 506
the continuous phase of HPMC with a lower viscosity. Again, the viscosity of the HPS decreased 507
with a higher MS, and leading to better compatibility between the two polymers. There could be 508
competing effects of hydroxypropylation on expanding the oxygen permeation area and of blending 509
on enhancing the tortuosity of oxygen permeation channel. With a better compatibility, the latter 510
effect outperformed the former, leading to the decreased OP of the blend films. 511
512
3.2.5 Thermal degradation
513
Fig. 8 shows the TGA results of the pure HPMC film, pure HPS films, and HPS/HPMC blend 514
films. For all the films, there were two thermal degradation stages, namely the moisture evaporation 515
from the materials in the temperature range of 30–180 °C and the thermal decomposition of 516
polysaccharides in the temperature range of 300–400 °C. Pure HPS films displayed a similar peak at 517
310 °C (A939) and 305 °C (A1081), respectively. The pure HPMC film showed a higher thermal 518
stability, with its decomposition occurring at 365 °C. All the blend samples showed two 519
decomposition peak representing HPS and HPMC respectively. However, for the blends, the HPS 520
thermal decomposition occurred at a reduced temperature while the HPMC peak temperature was not 521
might be due to the interaction of HPMC with HPS and thus the further reduced intermolecular 523
interactions between HPS molecular chains and the reduced ordered structure in HPS. 524
525
526
[image:28.595.58.534.184.355.2]527
Fig. 8. TGA curves (a) and their derivative curves (b) of the films of HPMC, HPSs with different 528
MSs, and HPMC/HPS blends with the different HPSs. 529
530
3.2.6 Relationship between rheological properties, structure, and film performance
531
For the blends, the compatibility between and the physicochemical properties of the constituents 532
exert varying levels of influence on rheology (Chhabra and Richardson, 2008). However, the 533
rheological history and structure ultimately determine the performance of the products. For each 534
product, there is a degree of its own complexity and peculiarities, which need to be incorporated into 535
the structure-rheology link. 536
Basing on the rheology results, it is noticeable that the rheological properties showed an obvious 537
dependence on the MS of HPS. For pure HPS, a higher MS caused a lower viscosity and an enhanced 538
Newtonian-behavior, which reduced the different in viscosity between the two components and thus 539
induced a greater compatibility in the blends. The thixotropic property was increased with a higher 540
MS, attributed to the improved flexibility of starch chains by hydroxypropylation. Such changes 541
0 200 400 600
0 20 40 60 80 100 HPMC A939 A1081 A939-HPMC A1081-HPMC We ig h t (% ) Temperature (C) a
0 200 400 600
resulted in a much more flexible texture of the films, which conformed to the change in E and σt in the
542
tensile properties. The SAXS results clearly show that the fractal dimension (D) was strongly depended 543
on the MS of HPS. For pure HPS, a higher MS caused greater compactness of the self-similar structure. 544
Such changes induced larger permeable channels for oxygen in the films and the reduced rigidity of 545
the films, which correspond to the changes in oxygen permeability, E and σt. The WAXS results clearly
546
suggest that the crystalline structure strongly depended on the MS of HPS. A higher MS caused a 547
decreased characteristic peak area. This change was due to the inhibition of starch recrystallization, 548
and induced a much higher εb value.
549
The changes in the structure and rheological properties certainly affected the blend film 550
performance. The SAXS data show that a good compatibility between the two components caused a 551
much denser structure and better tensile properties of the films. Therefore, the film performance of the 552
blends could be largely affected by the changes in MS and the compatibility between the two 553
components. A higher MS caused larger permeable channels for oxygen in the films. Besides, an 554
increased MS also led to a better compatibility between two components, which resulted in increased 555
tortuosity of the oxygen permeation channels. The final OP of blends was determined by these two 556
competing factors. Regarding the tensile properties, both a higher MS of HPS and a better 557
compatibility induced higher εb; therefore, the εb value of the blends was increased with a higher MS.
558
The thixotropic behavior was also balanced by the MS of HPS and the storage modulus of the gel. 559
With a higher MS, the thixotropic property was declined due to the decreased storage modulus of HPS. 560
At a low temperature, HPS was the dispersion phase with a high viscosity, which was confirmed by 561
the changes in viscoelastic properties during heating and cooling. The competition between these two 562
aspects could reduce the influence of MS on the thixotropic behavior. 563
4 Conclusion
565
This work concerns the effect of hydroxypropylation of starch on the rheological properties and 566
the film structure and performance of a novel thermal/cooling-gel bi-phasic system. This system was 567
based on two natural biopolymer-based hydrogels, HPMC and HPS, which could form continuous 568
phases at low and high temperatures, respectively. The variation of this phase conformation 569
significantly influenced the rheological properties, thixotropy, and gel properties of the blend 570
systems, and subsequently affected the crystalline structure, fractal structure, mechanical properties, 571
OP, and thermal stability of the blend films. In particular, HPS at low temperatures, and HPMC at 572
high temperatures, play a dominant role in controlling these different properties. 573
The rheological and gel properties were also significantly affected by the starch chemical 574
modification. A higher MS of HPS decreased the viscosity and weakened the shear thinning behavior 575
of the blend solutions at low temperatures and also declined the G′ and G″ of the hybrid gels. 576
Regarding this, the hydroxypropylation of native starch could break the intermolecular hydrogen 577
bonding, disrupt its ordered structure, increase its hydrophilicity, and result in a softer gel texture. A 578
higher MS could also increase n′ and n″, indicating that hydroxypropylation reduced the solid-like 579
behavior and increased the frequency-dependence. However, blending HPS with HPMC made these 580
effects of the MS of HPS on the rheological and gel properties less apparent. On the other hand, the 581
film structure and performance was also significantly affected by the starch hydroxypropylation. 582
With a higher MS of HPS, the starch crystallinity was decreased and the elongation at break of films 583
was increased, indicating the hydroxypropylation of starch could inhibit the molecular rearrangement 584
and improve the flexibility of films. However, an increase in the MS of HPS also led to reduced 585
fractal structure and OP. This suggests that a higher film density could be linked to a better oxygen 586
barrier property. 587
Our results here have shown that the processability and performance of HPMC/HPS biphasic 588
starch and cellulose, new materials based on this kind of systems could be developed to suit the 590
needs of high-value applications such as biomedical materials, food, and coatings. 591
592
Acknowledgements
593
This work was financially supported by the National Natural Science Foundation of China 594
(NSFC) (Nos. 31130042 and 31571789) and the Special Funds for Taishan Scholars Projects of 595
Shandong Province. Y. Wang would like to acknowledge the China Scholarship Council (CSC) for 596
providing financial assistance for her visiting studies at the CSIRO in Australia. F. Xie acknowledges 597
the European Union’s Marie Skłodowska-Curie Actions (MSCA) and the Institute of Advanced 598
Study (IAS), University of Warwick for the Warwick Interdisciplinary Research Leadership 599
Programme (WIRL-COFUND). Part of this research was undertaken on the SAXS/WAXS beamline 600
at the Australian Synchrotron, Victoria, Australia. 601
602
References
603
Adak, S., Banerjee, R., 2016. A green approach for starch modification: Esterification by lipase and novel 604
imidazolium surfactant. Carbohyd. Polym. 150, 359-368. 605
Chen, H.H., 2007. Rheological properties of HPMC enhanced Surimi analyzed by small- and large-strain 606
tests: I. The effect of concentration and temperature on HPMC flow properties. Food Hydrocolloid. 21, 1201-607
1208. 608
Chhabra, R.P., Richardson, J.F., 2008. Newtonian Fluid Behaviour, in: Richardson, J.F. (Ed.), Non-609
Newtonian Flow and Applied Rheology:Engineering Applications. Elsevier Ltd, pp. 1-55. 610
Chun, S.Y., Yoo, B., 2007. Effect of molar substitution on rheological properties of hydroxypropylated rice 611
Clark, A.H., Ross-Murphy, S.B., 1987. Structural and Mechanical Properties of Biopolymer Gels, in: Abe, A., 613
Dusek, K., Kobayashi, S. (Eds.), Biopolymers. Springer, Berlin Heidelberg, pp. 57-192. 614
Correa, M.J., Anon, M.C., Perez, G.T., Ferrero, C., 2010. Effect of modified celluloses on dough rheology and 615
microstructure. Food Res. Int. 43, 780-787. 616
Cuq, B., Gontard, N., Guilbert, S., 1998. Proteins as agricultural polymers for packaging production. Cereal. 617
Chem. 75, 1-9. 618
Dhillon, S., Seetharaman, K., 2011. Rheology and texture of starch gels containing iodine. J. Cereal Sci. 54, 619
374-379. 620
Dziesak, J.D., 1991. A focus on gums. Food Technol.-Chicago. 45, 118-132. 621
Han, J.A., Lee, B.H., Lim, W.J., Lim, S.T., 2005. Utilization of hydroxypropylated waxy rice and corn 622
starches in Korean waxy rice cake to retard retrogradation. Cereal. Chem. 82, 88-92. 623
Haque, A., Morris, E.R., 1993. Thermogelation of methylcellulose .1. Molecular-structures and processes. 624
Carbohyd. Polym. 22, 161-173. 625
Haque, A., Richardson, R.K., Morris, E.R., Gidley, M.J., Caswell, D.C., 1993. Thermogelation of 626
methylcellulose .2. Effect of hydroxypropyl substituents. Carbohyd. Polym. 22, 175-186. 627
Heyman, B., De Vos, W.H., Depypere, F., Van der Meeren, P., Dewettinck, K., 2014. Guar and xanthan gum 628
differentially affect shear induced breakdown of native waxy maize starch. Food Hydrocolloid. 35, 546-556. 629
Imran, M., Klouj, A., Revol-Junelles, A.M., Desobry, S., 2014. Controlled release of nisin from HPMC, 630
sodium caseinate, poly-lactic acid and chitosan for active packaging applications. J. Food. Eng. 143, 178-185. 631
Kadokawa, J.I., Murakami, M.A., Takegawa, A., Kaneko, Y., 2009. Preparation of cellulose-starch composite 632
gel and fibrous material from a mixture of the polysaccharides in ionic liquid. Carbohyd. Polym. 75, 180-183. 633
Kaur, L., Singh, N., Singh, J., 2004. Factors influencing the properties of hydroxypropylated potato starches. 634
Carbohyd. Polym. 55, 211-223. 635
Kim, H.R., Eliasson, A.C., Larsson, K., 1992a. Dynamic rheological studies on an interaction between lipid 636
and various native and hydroxypropyl potato starches. Carbohyd. Polym. 19, 211-218. 637
Kim, H.R., Hermansson, A.M., Eriksson, C.E., 1992b. Structural characteristics of hydroxypropyl potato 638
Klangmuang, P., Sothornvit, R., 2016. Barrier properties, mechanical properties and antimicrobial activity of 640
hydroxypropyl methylcellulose-based nanocomposite films incorporated with Thai essential oils. Food 641
Hydrocolloid. 61, 609-616. 642
Larson, R.G., 1999. Foams, Emulsions, and Blends, in: Larson, R.G. (Ed.), The Structure and Rheology of 643
Complex Fluids. Oxford University Press, New York, pp. 388-437. 644
Lawal, O.S., Ogundiran, O.O., Adesogan, E.K., Ogunsanwo, B.M., Sosanwo, O.A., 2008. Effect of 645
hydroxypropylation on the properties of white yam (Dioscorea rotundata) starch. Starch-Starke. 60, 340-348. 646
Lee, H.L., Yoo, B., 2011. Effect of hydroxypropylation on physical and rheological properties of sweet potato 647
starch. LWT-Food Sci. Technol. 44, 765-770. 648
Li, L., 2002. Thermal gelation of methylcellulose in water: Scaling and thermoreversibility. Macromolecules. 649
35, 5990-5998. 650
Liu, H., Yu, L., Xie, F., Chen, L., 2006. Gelatinization of cornstarch with different amylose/amylopectin 651
content. Carbohyd. Polym. 65, 357-363. 652
Liu, S.Q., Joshi, S.C., Lam, Y.C., Tam, K.C., 2008. Thermoreversible gelation of 653
hydroxypropylmethylcellulose in simulated body fluids. Carbohyd. Polym. 72, 133-143. 654
Luallen, T., 2004. Utilizing starches in product development, in: Eliasson, A.C. (Ed.), Starch in Food: 655
Structure, Function and Applications. Woodhead Publishing, New York, pp. 393-424. 656
Masina, N., Choonara, Y.E., Kumar, P., du Toit, L.C., Govender, M., Indermun, S., Pillay, V., 2017. A review 657
of the chemical modification techniques of starch. Carbohydr Polym. 157, 1226-1236. 658
Moin, A., Ali, T.M., Hasnain, A., 2017. Characterization and utilization of hydroxypropylated rice starches 659
for improving textural and storage properties of rice puddings. International Journal of Biological 660
Macromolecules. 105, 843-851. 661
Morikawa, K., Nishinari, K., 2000. Rheological and DSC studies of gelatinization of chemically modified 662
starch heated at various temperatures. Carbohyd. Polym. 43, 241-247. 663
Musampa, R.M., Alves, M.M., Maia, J.M., 2007. Phase separation, rheology and microstructure of pea 664
protein-kappa-carrageenan mixtures. Food Hydrocolloid. 21, 92-99. 665
Ortega-Ojeda, F.E., Larsson, H., Eliasson, A.C., 2004. Gel formation in mixtures of amylose and high 666
Ortega-Toro, R., Jimenez, A., Talens, P., Chiralt, A., 2014. Properties of starch-hydroxypropyl 668
methylcellulose based films obtained by compression molding. Carbohyd. Polym. 109, 155-165. 669
Park, S., Chung, M.G., Yoo, B., 2004. Effect of octenylsuccinylation on rheological properties of corn starch 670
pastes. Starch-Starke. 56, 399-406. 671
Peressini, D., Bravin, B., Lapasin, R., Rizzotti, C., Sensidoni, A., 2003. Starch-methylcellulose based edible 672
films: rheological properties of film-forming dispersions. J. Food. Eng. 59, 25-32. 673
Ren, F., Yu, B., Dong, D., Hou, Z.-h., Cui, B., 2017. Rheological, thermal and microstructural properties of 674
whey protein isolate-modified cassava starch mixed gels at different pH values. Int. J. Food Sci. Tech. 52, 675
2445-2454. 676
Rosalina, I., Bhattacharya, M., 2002. Dynamic rheological measurements and analysis of starch gels. 677
Carbohyd. Polym. 48, 191-202. 678
Rosell, C.M., Yokoyama, W., Shoemaker, C., 2011. Rheology of different hydrocolloids-rice starch blends. 679
Effect of successive heating-cooling cycles. Carbohyd. Polym. 84, 373-382. 680
Schmitz, C.S., De Simas, K.N., Santos, K., Joao, J.J., Amboni, R.D.D.M.C., Amante, E.R., 2006. Cassava 681
starch functional properties by etherification-hydroxypropylation. Int. J. Food Sci. Tech. 41, 681-687. 682
Taguet, A., Bureau, M.N., Huneault, M.A., Favis, B.D., 2014. Toughening mechanisms in interfacially 683
modified HDPE/thermoplastic starch blends. Carbohyd. Polym. 114, 222-229. 684
Tajuddin, S., Xie, F., Nicholson, T.M., Liu, P., Halley, P.J., 2011. Rheological properties of thermoplastic 685
starch studied by multipass rheometer. Carbohyd. Polym. 83, 914-919. 686
Viriden, A., Larsson, A., Schagerlof, H., Wittgren, B., 2010. Model drug release from matrix tablets 687
composed of HPMC with different substituent heterogeneity. Int. J. Pharmaceut. 401, 60-67. 688
Wang, Y., Yu, L., Xie, F., Zhang, L., Liao, L., Liu, H., Chen, L., 2016a. Morphology and properties of 689
thermal/cooling-gel bi-phasic systems based on hydroxypropyl methylcellulose and hydroxypropyl starch. 690
Compos. Part B-Eng. 101, 46-52. 691
Wang, Y., Zhang, L., Liu, H., Yu, L., Simon, G.P., Zhang, N., Chen, L., 2016b. Relationship between 692
morphologies and mechanical properties of hydroxypropyl methylcellulose/hydroxypropyl starch blends. 693
Woggum, T., Sirivongpaisal, P., Wittaya, T., 2015. Characteristics and properties of hydroxypropylated rice 695
starch based biodegradable films. Food Hydrocolloid. 50, 54-64. 696
Zhang, B., Chen, L., Zhao, Y., Li, X., 2013a. Structure and enzymatic resistivity of debranched high 697
temperature–pressure treated high-amylose corn starch. J. Cereal Sci. 57, 348-355. 698
Zhang, J., Yang, W., Vo, A.Q., Feng, X., Ye, X., Kim, D.W., Repka, M.A., 2017a. Hydroxypropyl 699
methylcellulose-based controlled release dosage by melt extrusion and 3D printing: Structure and drug release 700
correlation. Carbohyd. Polym. 177, 49-57. 701
Zhang, L., Wang, Y., Liu, H., Yu, L., Liu, X., Chen, L., Zhang, N., 2013b. Developing hydroxypropyl 702
methylcellulose/hydroxypropyl starch blends for use as capsule materials. Carbohyd. Polym. 98, 73-79. 703
Zhang, L., Wang, Y.F., Yu, L., Liu, H.S., Simon, G., Zhang, N.Z., Chen, L., 2015. Rheological and gel 704
properties of hydroxypropyl methylcellulose/hydroxypropyl starch blends. Colloid. Polym. Sci. 293, 229-237. 705
Zhang, L., Zhao, Y., Qian, J.-Y., Jiang, S., Liu, J., He, X.-L., 2017b. Relationship between multi-scale 706
structures and properties of photophobic films based on hydroxypropyl methylcellulose and monosodium 707
phosphate. Carbohyd. Polym. 174, 572-579. 708
Zhang, N., Liu, H., Yu, L., Liu, X., Zhang, L., Chen, L., Shanks, R., 2013c. Developing gelatin-starch blends 709
for use as capsule materials. Carbohyd. Polym. 92, 455-461. 710
Tables
Table 1. Flow behavior index (n), fluid consistency index (K) during increasing shear rate and the degree of structural recovery (DSR) after a certain
recovery time for the solution of HPMC, HPSs with different MSs, and HPMC/HPS blends with the different HPSs at 25 °C.
Sample names
Increasing shear rate DSR (%)
n K (Pa·sn) 10 s 60 s 250 s
A939 0.377±0.002a 82.1±0.14 35.64±2.78 38.00±2.58 33.32±3.24
A1081 0.471±0.004 32.0±0.98 27.89±0.60 32.34±0.62 28.63±0.51 A939-HPMC 0.778±0.002 3.1±0.03 18.42±0.50 18.92±0.50 17.73±0.48 A1081-HPMC 0.754±0.002 3.7±0.06 24.01±1.07 25.28±0.93 22.60±0.83 HPMC 0.923±0.006 1.1±0.02 85.65±1.29 88.44±0.64 91.63±0.53
Table 2. n′, n″, G0′ and G0″ for the solution of HPMC, HPSs with different MSs, and HPMC/HPS blends with the different HPSs at 5 °C and 85 °C as
determined from Eqs. (2) and (3).
Sample T (°C) n′ G0′ R2 n″ G0″ R2
G80
5 0.030±0.001a 12,5572±4,947 0.9912 0.157±0.009 4,802±393 0.9527
85 0.122±0.012 86,930±12,709 0.9920 0.056±0.001 14,489±3,382 0.9528
A939
5 0.061±0.000 1,220±17 0.9805 0.313±0.002 70±2 0.9816
85 0.299±0.001 32±1 0.9899 0.447±0.030 11±3 0.9999
A1081
5 0.083±0.001 315±6 0.9564 0.479±0.001 19±0 0.9956
85 0.680±0.000 1±0 0.9955 0.673±0.000 1±0 0.9981
G80-HPMC
5 0.080±0.001 6,198±675 0.9723 0.370±0.002 449±17 0.9971
85 0.071±0.009 4,083±256 0.9942 0.136±0.028 345±38 0.9371
A939-HPMC
5 0.159±0.000 233±2 0.9757 0.480±0.005 32±1 0.9962
85 0.153±0.015 1,370±326 0.9979 0.241±0.009 246±85 0.9953
A1081-HPMC
5 0.232±0.001 58±0 0.9647 0.603±0.001 12±0 0.9983
85 0.089±0.019 810±55 0.9969 0.175±0.019 95±22 0.9777
HPMC
5 1.404±0.025 0.04±0 0.9951 0.974±0.001 2.2±0 0.9999
Table 3. Fractal structure parameters of the films of HPMC, HPSs with different MSs, and
HPMC/HPS blends with the different HPSs.
HPMC-HPS
Fractal dimension (D)
10:0 5:5 0:10
A939 2.36 2.20 2.60
Table 4. Tensile properties of the films of HPMC, HPSs with different MSs, and HPMC/HPS blends
with the different HPSs at 25 °C.
Sample names Young’s modulus (MPa) Tensile strength (MPa) Elongation at break (%)
A939 518.59±20.31a 13.63±0.48 26.77±3.54
A1081 27.37±1.85 10.11±0.47 135.33±3.38
A939-HPMC 319.83±23.78 8.04±0.44 4.64±0.35
A1081-HPMC 235.02±9.97 9.14±0.46 20.35±2.14
HPMC 270.28±9.27 15.05±0.51 24.86±1.43
Table 5. Oxygen permeability of the films of HPMC, HPSs with different MSs, and HPMC/HPS
blends with the different HPSs at 25 °C.
Sample names OP (cc/m2/day)
A939 0.19±0.01a
A1081 0.64±0.00
A939-HPMC 70.74±0.62
A1081-HPMC 39.25±0.53
HPMC 261.62±4.8