University of Warwick institutional repository: http://go.warwick.ac.uk/wrap
This paper is made available online in accordance with
publisher policies. Please scroll down to view the document
itself. Please refer to the repository record for this item and our
policy information available from the repository home page for
further information.
To see the final version of this paper please visit the publisher’s website.
Access to the published version may require a subscription.
Author(s): S E Lamb, H P Bartlett, A Ashley, W Bird
Article Title: Can lay-led walking programmes increase physical
activity in middle aged adults? A randomised controlled trial
Year of publication: 2002
Link to published article: http://dx.doi.org/10.1136/jech.56.4.246
PUBLIC HEALTH POLICY AND PRACTICE
Can lay-led walking programmes increase physical activity
in middle aged adults? A randomised controlled trial
S E Lamb, H P Bartlett, A Ashley, W Bird
. . . .
J Epidemiol Community Health 2002;56:246–252
Study objective:To compare health walks, a community based lay-led walking scheme versus advice only on physical activity and cardiovascular health status in middle aged adults.
Design:Randomised controlled trial with one year follow up. Physical activity was measured by ques-tionnaire. Other measures included attitudes to exercise, body mass index, cholesterol, aerobic capac-ity, and blood pressure.
Setting:Primary care and community.
Participants: 260 men and women aged 40–70 years, taking less than 120 minutes of moderate intensity activity per week.
Main results:Seventy three per cent of people completed the trial. Of these, the proportion increasing their activity above 120 minutes of moderate intensity activity per week was 22.6% in the advice only and 35.7% in the health walks group at 12 months (between group difference =13% (95% CI 0.003% to 25.9%) p=0.05). Intention to treat analysis, using the last known value for missing cases, demonstrated smaller differences between the groups (between group difference =6% (95% CI−5% to 16.4%)) with the trend in favour of health walks. There were improvements in the total time spent and number of occasions of moderate intensity activity, and aerobic capacity, but no statistically significant differences between the groups. Other cardiovascular risk factors remained unchanged.
Conclusions:There were no significant between group differences in self reported physical activity at 12 month follow up when the analysis was by intention to treat. In people who completed the trial, health walks was more effective than giving advice only in increasing moderate intensity activity above 120 minutes per week.
P
articipation in regular, moderate intensity physicalactiv-ity confers health benefit, particularly a reduction in risk
of cardiovascular disease.1
The suggested target for the UK is to decrease the proportion of people who are sedentary
by 10%, by the year 2005.2
Lay-led walking schemes are potentially a cheap and effective means of encouraging people to increase physical activity. Walking schemes known as “health walks” are being set up across the UK, and primary care trusts are being encouraged to use them as a method of
physical activity promotion.3The schemes use local footpaths,
emphasise walking at a brisk pace and provide the oppor-tunity to walk in company and with a guide. Lay people and volunteers run the programmes, and there is a strong sense of
community ownership.3
Previous studies of primary care physical activity pro-grammes have reported the benefits of using health or fitness
professionals, usually nurses or exercise officers.4–9
Most are comparatively expensive interventions. The aim of this study was to investigate if a lay-lead health walks scheme was more effective in encouraging middle aged people to increase their physical activity levels, than advice from a primary health care professional only, and to compare the physiological and behavioural consequences of the two approaches. The study had a pre-specified protocol, hypothesis, and sample size esti-mation.
METHODS Study design
A randomised controlled trial (RCT) comparing (1) advice given by a primary care health care professional and (2) the same advice and the opportunity to participate in a lay-led health walks programme. The follow up period was one year.
Sample
The inclusion criteria were (1) aged between 40 and 70 years
and (2) taking less than 120 minutes (approximating to 4×30
min) of moderate intensity exercise per week as we did not wish to include people who were already active. Current guidelines suggest that people should take 30 minutes of moderate intensity activity, on five but preferably all days of the week.1 2
Exclusion criteria were having a recent history of an illness likely to interfere with the ability to walk one mile safely, including serious cardiac or respiratory diagnoses, lower limb fractures in the last year, blindness, rheumatoid arthritis, chronic neurological, terminal or significant mental illness. If participants reported that a doctor had told them not exercise, they were excluded.
Interventions tested
Advice group
All participants attended a standardised advice session in the primary care setting, led by a physiotherapist. Sessions were conducted in groups of 10–20 people, and the topics covered were the health benefits of exercise, recommended levels of
exercise for adults using published guidelines,1 2
and tips on getting started and sticking to a physical activity programme. The key message was to take at least 120 minutes/week of moderate intensity activity per week, and to choose an activity that was enjoyable and convenient. Suggested activities included swimming, racquet sports, and aerobics. Walking was also suggested as an activity, but participants in the con-trol group were not referred to or contacted by the health walks scheme. Participants were advised that moderate inten-sity activity should result in at least a slight sweat or breathlessness. Participants were encouraged to ask questions and share experiences. The seminar lasted 30 minutes, and was supplemented by general written guidance. The health See end of article for
authors’ affiliations . . . .
Correspondence to: Professor S Lamb, Inter-disciplinary Research Centre in Health, Coventry University, Priory Street, Coventry CV1 5FB, UK; [email protected]
walks and advice group continued to receive any advice about exercise that they sought from their general practitioner.
Health walks group
People randomised to the health walks were treated in exactly the same manner as those in the advice only, but in addition, they were given verbal and written information about the local health walks programme and encouraged to consider this as an option for increasing physical activity. They were referred to the local walk coordinator who telephoned each person to explain the programme in more depth and extend an invitation to join a specified walk. People received a maxi-mum of three telephone calls. The first attempts to contact the participants were made within two weeks of the exercise seminar. The health walks programme ran in two forms. Accompanied walks were provided at several different times in the day and evening, during the week and at weekends, and were led by lay volunteers. Walk packs were available for those who might find it more convenient or preferable to walk inde-pendently. The packs included information on routes, calibrated times for each walk, and details of local points of interest. A maximum of three telephone calls was made dur-ing the year of the study to encourage people to join the scheme, each person was sent a local walk pack and promotional flyers through the post. Attendance on the walks was free of charge. Walks were designed with crèche facilities, car parking and access to public transport networks. Participants were encouraged to bring along other members of their family or friends.
Recruitment and randomisation
The recruitment process was two staged. Firstly, a random sample of 2000 people, aged between 40 and 70 years old, with no serious medical problems were identified from the list of a large general practice (list size 26 500). The practice comprised 14 general practitioners, serving almost entirely the popula-tion of Lower Earley, a large suburb of Reading, UK. The prac-tice manager identified the random sample from computer-ised records. Postal questionnaires were sent with a cover letter from general practitioners to ascertain whether people met the study criteria and to establish their willingness to participate in a trial of physical activity promotion. The response rate was 48%. Non-respondents tended to be younger (mean age 49 years (SD 6.9) versus 50.4 (SD 7.8), p<0.05) and female (52% versus 48%, p<0.05). Question-naires were returned to a research nurse who was responsible for recruiting and randomising participants. Of the people who returned questionnaires, 438 people were eligible and potentially willing to participate in a further study. In the sec-ond stage of recruitment eligible people, who had indicated willingness to participate, were sent a letter explaining the trial in more detail. They were advised that the researchers wanted to investigate different methods of encouraging physical activity, but there was no specific mention of walking. This was followed up by a telephone call from a research nurse to gain consent, register, and make arrangements for the baseline assessment. Before making telephone contact with participants, the research nurse contacted the randomisation centre, and was issued with a randomly allocated series of dates from which the participant could choose to attend. Seminars were conducted for groups of people allocated to the same experimental group. Ten dates were allocated randomly to advice only and health walks arm of the trial a priori and the research nurse was unaware of whether the dates pertained to health walks or advice only seminars.
Measures
Assessments were carried out before the advice session (base-line) and 6 and 12 months later. Physical activity was assessed
using a postal questionnaire,10
based on the well validated
Stanford 5 Cities physical activity questionnaire.11 12
It recorded the type, frequency and duration of physical activities undertaken in the past week. People were asked to identify moderate intensity activities, by the degree of sweat and breathlessness that resulted. The activities assessed were comprehensive, ranging from basic mobility tasks, activities of daily living through to high intensity structured exercise. Atti-tudes to exercise were also measured as part of the question-naire, using the validated stages of change for exercise
measure.13
Stage 1 was that they currently took no exercise, and were not thinking of taking up any exercise. Stage 2 was that they were thinking about exercising, but had done noth-ing about it in the past six months, stage 3 that they had started exercising in the past six months, and stage 4 that they were exercising regularly.
Cardiovascular fitness tests were also conducted in the gen-eral practice, at each assessment interval and took about 30 minutes to complete. Blood pressure was measured using a digital monitor (Model UA-702, A&D Ltd, Tokyo, Japan). Par-ticipants rested in the seated position (elbow at 90 degrees, legs uncrossed, hand at the level of the heart) for at least three minutes before the measure was taken. A non-fasting blood sample was taken for total cholesterol, and analysed under standard laboratory conditions. Weight was measured using a digital calibrated bathroom scale on a firm surface, with par-ticipants wearing light indoor clothing only. Height was measured using a wall mounted stadiometer, to the nearest 0.1 cm, in stocking feet, and body mass index (BMI)
calculated using the formula weight/height2
(kg/m2
). A sub-maximal step test was used to estimate age corrected VO2 maxfrom BMI, age, sex, resting and exercising pulse rate .
14
Walk leaders collected data on attendance on organised walks.
Blinding
An independent investigator measured outcomes at 6 and 12 months. This person was not involved in the recruitment or randomisation of participants, or in the organisation or deliv-ery of any of the advice or health walks interventions.
Sample size
The study was powered to detect a 10% difference in the pro-portion of people who moved from being sedentary to becom-ing active—that is, takbecom-ing more than 120 minutes of moderate intensity exercise per week. This threshold was chosen to reflect current opinion and proposed national targets for the
UK population2
and linked to the main message of the exercise seminars—that is, that people should aim to do more than 120 minutes per week of moderate intensity activity. Assuming a low level of uptake of exercise in the advice only group, an alpha of 0.05 and power of 90%, the sample size requirement
was 100 people for each group.15
An additional 30% were included to account for loss to follow up.
Statistical analysis
their activity. The second was a full intention to treat analysis, in which the last known value for all missing cases was used
as an imputed value.16
All people were analysed in the groups they were randomised to. Statistical significance was claimed at p<0.05. The analysis was undertaken using the statistical package SPSS for Windows version 8.5. Ethical approval was granted by West Berkshire Local Research Ethics Committee. All participants gave their informed written consent to participate in the study.
RESULTS
Flow through the trial
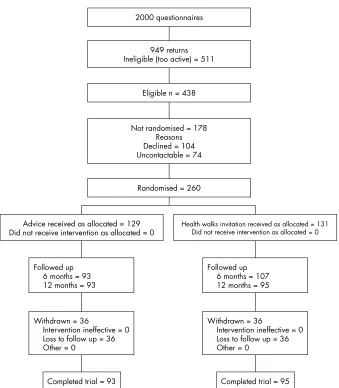
[image:4.612.141.475.77.239.2]Figure 1 shows the flow of subjects through the trial. Of the 438 potentially eligible people, 260 were randomised. The physical activity profile and demographic profile of eligible people who agreed and declined to enter the study are shown in table 1. The only statistically significant differences were that people who declined reported higher levels of physical activity. The study included seven people incorrectly identified Table 1 Differences between people who agreed to participate in the trial and
those who refused
Eligible but not
randomised n=178 Randomisedn=260 Statisticalsignificance
Age (years) 50.8 (7.7) 50.5 (7.8) p=0.8 Sex (% male) 47.7% 48.8% p=0.82 Physical activity profile
Total time (median minutes per week (IQR))
Activities MET value >3 60 (1 to 160) 30 (0 to 120) p=0.005 Activities sweat/breathless 0 (0 to 90) 0 (0 to 45) p=0.003 Frequency (median sessions per week (IQR))
Activities MET value >3 2 (0 to 5) 1 (0 to 3) p=0.03 Activities sweat/breathless 0 (0 to 4) 0 (0 to 2) p=0.01 Stages of change
Level 1 14.9% 16.9% Level 2 28% 34.3% Level 3 10.7% 11.8%
[image:4.612.73.412.347.735.2]Level 4 46.4% 37.0% p=0.281
Figure 1 Flow of participants through the trial.
2000 questionnaires
949 returns Ineligible (too active) = 511
Eligible n = 438
Not randomised = 178 Reasons Declined = 104 Uncontactable = 74
Randomised = 260
Advice received as allocated = 129 Did not receive intervention as allocated = 0
Followed up 6 months = 93 12 months = 93
Withdrawn = 36
Intervention ineffective = 0 Loss to follow up = 36 Other = 0
Completed trial = 93
Health walks invitation received as allocated = 131 Did not receive intervention as allocated = 0
Followed up 6 months = 107 12 months = 95
Withdrawn = 36
Intervention ineffective = 0 Loss to follow up = 36 Other = 0
as inactive but retained according to their random allocation. All people in the health walks group received a telephone call from the walk coordinator within a month of the exercise seminar, with the exception of three people who did not wish to be contacted.
Loss to follow up
Loss to follow up was approximately 27% in each group. There were no statistically significant baseline differences between
people who were lost to follow up and those who remained in the trial (shown in table 2).
Health walk and seminar attendance
[image:5.612.139.476.78.240.2]All participants attended the seminars. In the health walks group, the number of people who attended the accompanied walks was relatively low (33%, n=43). In those who did attend, the median number of accompanied walks attended was six (range 1–136) and total number attended was 672. People who Table 2 Differences between people lost to follow up and those who completed the
study at 12 months
Trial completers
n=188 Non-completersn=72 Statisticalsignificance
Age (y) 50.2 (8.1) 51.2 (7.7) p=0.19 Sex (% male) 48.9% 43.1% p=0.39 Physical activity profile
Total time (median minutes per week (IQR))
Activities MET value >3 30 (0 to 120) 37.5 (0 to 120) p=0.95 Activities sweat/breathless 0 (0 to 45) 0 (0 to 43.7) p=0.81 Frequency (median sessions per week (IQR))
Activities MET value >3 1 (0 to 4) 1 (0 to 3) p=0.92 Activities sweat/breathless 0 (0 to 2) 0 (0 to 2) p=0.79 Stages of change
Level 1 16.4% 20% Level 2 35.0% 31.4% Level 3 12.0% 11.4%
Level 4 36.0% 37.1% p=0.90
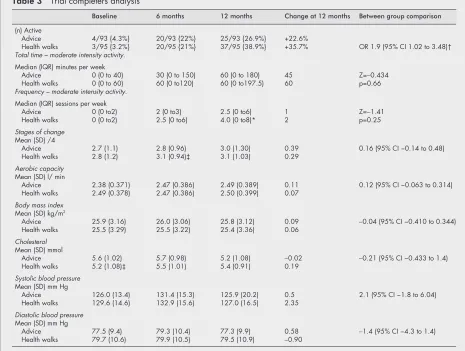
Table 3 Trial completers analysis
Baseline 6 months 12 months Change at 12 months Between group comparison
(n) Active
Advice 4/93 {4.3%} 20/93 {22%} 25/93 {26.9%} +22.6%
Health walks 3/95 {3.2%} 20/95 {21%} 37/95 {38.9%} +35.7% OR 1.9 (95% CI 1.02 to 3.48)† Total time – moderate intensity activity.
Median (IQR) minutes per week
Advice 0 (0 to 40) 30 (0 to 150) 60 (0 to 180) 45 Z=−0.434 Health walks 0 (0 to 60) 60 (0 to120) 60 (0 to197.5) 60 p=0.66 Frequency – moderate intensity activity.
Median (IQR) sessions per week
Advice 0 (0 to2) 2 (0 to3) 2.5 (0 to6) 1 Z=−1.41 Health walks 0 (0 to2) 2.5 (0 to6) 4.0 (0 to8)* 2 p=0.25 Stages of change
Mean (SD) /4
Advice 2.7 (1.1) 2.8 (0.96) 3.0 (1.30) 0.39 0.16 (95% CI −0.14 to 0.48) Health walks 2.8 (1.2) 3.1 (0.94)‡ 3.1 (1.03) 0.29
Aerobic capacity Mean (SD) l/ min
Advice 2.38 (0.371) 2.47 (0.386) 2.49 (0.389) 0.11 0.12 (95% CI −0.063 to 0.314) Health walks 2.49 (0.378) 2.47 (0.386) 2.50 (0.399) 0.07
Body mass index Mean (SD) kg/m2
Advice 25.9 (3.16) 26.0 (3.06) 25.8 (3.12) 0.09 −0.04 (95% CI −0.410 to 0.344) Health walks 25.5 (3.29) 25.5 (3.22) 25.4 (3.36) 0.06
Cholesterol Mean (SD) mmol
Advice 5.6 (1.02) 5.7 (0.98) 5.2 (1.08) −0.02 −0.21 (95% CI −0.433 to 1.4) Health walks 5.2 (1.08)‡ 5.5 (1.01) 5.4 (0.91) 0.19
Systolic blood pressure Mean (SD) mm Hg
Advice 126.0 (13.4) 131.4 (15.3) 125.9 (20.2) 0.5 2.1 (95% CI −1.8 to 6.04) Health walks 129.6 (14.6) 132.9 (15.6) 127.0 (16.5) 2.35
Diastolic blood pressure Mean (SD) mm Hg
Advice 77.5 (9.4) 79.3 (10.4) 77.3 (9.9) 0.58 −1.4 (95% CI −4.3 to 1.4) Health walks 79.7 (10.6) 79.9 (10.5) 79.5 (10.9) −0.90
[image:5.612.72.537.366.717.2]classed themselves as regular exercisers on the stages of change
measure were least likely to attend (χ2=7.29 p=0.06).
Trial completers analysis
The results for participants who attended the 12 month follow up are shown in table 3. By 12 months the proportion of active people in the advice only group increased by 22.6% (from 4.3% to 26.9%). In the health walks group, the proportion of active people increased by 35.7% (from 3.2% to 38.9%). The difference between the groups was 13% (95% CI 0.003% to 25.9%). Analy-sis of the continuously scaled physical activity items supported the trend of improvement in activity. People in the health walks arm of the trial increased the frequency of moderate intensity activity more than the advice only group, but there were no sta-tistically significant differences between groups in terms of total amount of activity. Improvements in physical activity levels took sometime to occur. At six months there were only small increases in physical activity, but motivation to exercise had improved more quickly in the health walks group (shown in
table 2,χ2=7.71 df=3, p=0.05). By 12 months, the advice only
group had “caught up” in their motivation level (between group
difference χ2
=1.63 df=3, p=0.65). Although there were modest, statistically significant improvements in aerobic capac-ity in both groups, there was no difference between the groups at 12 months. There were no statistically significant changes in body mass index, cholesterol, or blood pressure in either group.
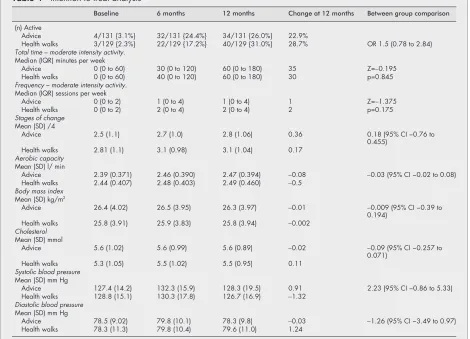
Intention to treat analysis
The result of the intention to treat analysis is shown in table 4. Imputing the last known value suggested smaller differences in physical activity gains between the advice only and health
walks group, with an overall trend in favour of the health walks groups. The difference between groups was 6% (95% CI
−5% to 16.4%). The trend of increased frequency of moderate
intensity activity in the health walks group remained in the intention to analysis.
Validity of the physical activity questionnaire
Further analysis demonstrated a statistically significant posi-tive association between the changes in moderate activity and changes in sub-maximal aerobic capacity (Spearman’s corre-lation coefficient 0.25 p=0.03), supporting the validity of the physical activity questionnaire.
DISCUSSION
Walking has been suggested as a particularly beneficial form
of moderate intensity activity.17
[image:6.612.72.542.384.723.2]Health walks have been designed so that they can link easily with primary care. The schemes are open to people of all levels of fitness, and cater for the beginner through to the advanced countryside walker. This trial focused on effectiveness in less physically active
Table 4 Intention to treat analysis
Baseline 6 months 12 months Change at 12 months Between group comparison
(n) Active
Advice 4/131 {3.1%} 32/131 {24.4%} 34/131 {26.0%} 22.9%
Health walks 3/129 {2.3%} 22/129 {17.2%} 40/129 {31.0%} 28.7% OR 1.5 (0.78 to 2.84) Total time – moderate intensity activity.
Median (IQR) minutes per week
Advice 0 (0 to 60) 30 (0 to 120) 60 (0 to 180) 35 Z=−0.195 Health walks 0 (0 to 60) 40 (0 to 120) 60 (0 to 180) 30 p=0.845 Frequency – moderate intensity activity.
Median (IQR) sessions per week
Advice 0 (0 to 2) 1 (0 to 4) 1 (0 to 4) 1 Z=−1.375 Health walks 0 (0 to 2) 2 (0 to 4) 2 (0 to 4) 2 p=0.175 Stages of change
Mean (SD) /4
Advice 2.5 (1.1) 2.7 (1.0) 2.8 (1.06) 0.36 0.18 (95% CI −0.76 to 0.455)
Health walks 2.81 (1.1) 3.1 (0.98) 3.1 (1.04) 0.17 Aerobic capacity
Mean (SD) l/ min
Advice 2.39 (0.371) 2.46 (0.390) 2.47 (0.394) −0.08 −0.03 (95% CI −0.02 to 0.08) Health walks 2.44 (0.407) 2.48 (0.403) 2.49 (0.460) −0.5
Body mass index Mean (SD) kg/m2
Advice 26.4 (4.02) 26.5 (3.95) 26.3 (3.97) −0.01 −0.009 (95% CI −0.39 to 0.194)
Health walks 25.8 (3.91) 25.9 (3.83) 25.8 (3.94) −0.002 Cholesterol
Mean (SD) mmol
Advice 5.6 (1.02) 5.6 (0.99) 5.6 (0.89) −0.02 −0.09 (95% CI −0.257 to 0.071)
Health walks 5.3 (1.05) 5.5 (1.02) 5.5 (0.95) 0.11 Systolic blood pressure
Mean (SD) mm Hg
Advice 127.4 (14.2) 132.3 (15.9) 128.3 (19.5) 0.91 2.23 (95% CI −0.86 to 5.33) Health walks 128.8 (15.1) 130.3 (17.8) 126.7 (16.9) −1.32
Diastolic blood pressure Mean (SD) mm Hg
Advice 78.5 (9.02) 79.8 (10.1) 78.3 (9.8) −0.03 −1.26 (95% CI −3.49 to 0.97) Health walks 78.3 (11.3) 79.8 (10.4) 79.6 (11.0) 1.24
Key points
• The importance of physical inactivity as a modifiable risk factor for cardiovascular disease is well recognised. • Lay-led walking programmes, which promote moderate
intensity activity, are potentially a cost effective method of health promotion in primary care.
people. The benefits of the health walks in fit, well motivated
people are predictability good.3
The vast majority of participants took no moderate intensity activity at all before the trial. In line with recent epidemiologi-cal evidence and national targets, we focused on the cumula-tive amount of activity over one week, and identified relevant changes using thresholds identified in a national priority set-ting exercise.2
Intensity can be defined either by the average caloric value of activities, or a more practical marker of whether people experience any minor sweat or breathlessness while active. The second approach accounts for variation between response to standardised activities that depends on fitness, and negates some of difficulties estimating physical
activity using caloric assessments.18
It also translated into a simple message about physical activity that was understood by the seminar participants, and was not activity specific.
The study was powered to detect differences using a dichotomous “active or not” variable, a larger trial would have been needed to demonstrate differences in the continuously scaled physical activity variables. A disadvantage to analysing the data in terms of a threshold of physical activity, is that no weight is given to the magnitude of change. It is possible, although unlikely given the trends in the continuously scaled activity data, that people changed their activity by only a few minutes to qualify as active. Using a threshold approach to data analysis introduces the possibility of misclassification bias, although with a randomised design such effects should be equally distributed across groups.
The primary outcome measure included all physical activi-ties encountered in daily life not just those relating to traditional perceptions of exercise or the health walks scheme. The health walk intervention comprises three components; attendance on organised walks, map packs, and telephone calls to encourage participation. We did not examine the effectiveness of the components separately, but took a pragmatic approach. We also considered that the health walks programme could stimulate activity more generally, and hence did not limit our assessment of activity to walking. A separate paper has been prepared on the physical activity transitions made as a result of the interventions. Attendance on organised walks was relatively low, suggesting that other components of the health walks programme may account for the observed effect. A supplementary qualitative study suggested that
people found the do it yourself walk packs useful.19We did not
report a subgroup analysis of the effects in those who attended the organised walks (sometimes called a treatment-received analysis) because the significant limitations and misleading
consequences of subgroup analyses are well documented.20
Although not as effective as health walks, giving verbal and written advice increased activity substantially. Unlike previous studies, we used a group setting to provide advice, and partici-pants seemed to enjoy and benefit from sharing experiences with one another. The response to group advice, supplemented by general written material was similar in magnitude but sus-tained for a longer period than in Australian trials of
individu-alised advice and tailored written materials.9 21As we did not
include a no-intervention arm in the trial, we cannot conclude that the advice was effective. Improvements of similar
magni-tude have been noted in non-interventional studies.22
Explana-tions for the general improvements are that people recruited into the trial were motivated to change their activity, and the trial provided a focus for them to do this. The cardiovascular fitness testing protocol could also have been a stimulant to the overall change in physical activity observed. The measures of physical activity could have suffered from regression to the
mean,22
or strong Hawthorne effects. Such effects would account for the overall trend of improved activity.
Analyses were undertaken to estimate the level of bias in the results. Ideally we should have sent reminders out at the first stage of sampling, but this was not possible within the time and financial frame of the study. People who, despite meeting the
study criteria, refused to participate in the trial tended to rate their exercise levels as higher, suggesting they had the perception that they were undertaking sufficient physical activ-ity. The loss to follow up rate was significantly lower than in previous trials of population based exercise interventions, with no evidence to suggest that those lost were different to those retained. People were encouraged strongly to attend follow up assessments even if they had not managed to increase their activity. Assessments were scheduled after work hours, or at the weekends, and were undertaken at the GP practice from which the sample was drawn. It is unusual for full intention to treat analyses to be reported in health promotion trials, the exception being Stevenset al6
and Smithet al.9
The recommended methods of intention to treat analysis are imputing the last known value,
an average, or the best or worst value.16
There may be a seasonal effect as the six month follow up occurred in the winter months. Future trials, particularly of outdoor physical activity promotion should consider a follow up period of sufficient length to estimate and account for possible seasonal variations in response, or recruitment staged randomly over one year.
With the exception of aerobic capacity, there were no changes in the physiological variables measured. This is
simi-lar to previous studies7 8
and there are several possible explanations. The study was not powered primarily to detect these differences. We used clinic based methods of measure-ment with inherent problems of sensitivity. It is also possible that the intensity of exercise undertaken was insufficient to change these variables, or that there is a delayed response.
There are concerns that self reported measures of physical activity are inaccurate.23 24
Alternatives such as accelerometry
are too expensive for large scale trials.18
Recent studies comparing accelerometry with seven day recall questionnaires have shown that although questionnaires may under or over estimate the total amount of activity, they provide more com-plete information, and superior properties for measuring
changes over time.24 25
The association between changes in activity and aerobic capacity that we observed was similar to
those reported by others,25 26
and supports the validity of the postal physical activity questionnaire as a measure that can capture relative changes in activity.
Lay-led walking programmes have the potential to offer cheap and effective physical activity promotion in primary care. Even the relatively modest effects demonstrated in this trial are likely to be worthwhile considering the importance and prevalence of physical activity as risk factor for cardiovas-cular disease. Health walks was more effective in people who completed the trial, and although we were unable to detect any statistically significant differences between completers and non-completers, it is possible that these groups differ in characteristics we did not measure. The effect of health walks compares favourably with other primary care based exercise schemes, including incentives, exercise on prescription and
behavioural counselling.4–8 19
A health walks programme is likely to be cheaper but this needs to be verified by a formal cost comparison. Future trials should examine whether send-ing map packs is as, or more, effective than accompanied health walks, as this would have significant implications for the design of health walking programmes.
ACKNOWLEDGEMENTS
Thanks are due to Ms Helen Timms, Dr Nigel McFeteridge and Mrs Sue Daniels (practice manager), and all patients and GPs at the Brookside Health Surgery who supported the study, Mrs Pat Knight coordinated the health walks programme and the anonymous referees who provided helpful feedback on the manuscript.
Funding: this work was funded by a grant from the British Heart Foundation and Countryside Agency.
. . . . Authors’ affiliations
S E Lamb,Inter-disciplinary Research Centre in Health, Coventry University, Coventry, UK
H P Bartlett, A Ashley,Oxford Centre for Health Care Research and Development, Oxford Brookes University, Oxford, UK
W Bird ,Sonning Common Health Centre, Sonning Common, Berkshire, UK
REFERENCES
1Pate RR, Pratt M, Blair SN,et al. Physical activity and public health. A recommendation from the Centers for Disease Control and Prevention and the American College of Sports Medicine.JAMA 1995;273:402–7. 2Fentem P, Walker, A. Setting targets for England: challenging,
measurable and achievable. In: Health Education Authority.Moving on. A report of the Health Education Authority symposium to agree health education messages for promoting physical activity in England. London: Health Education Authority, 1994:58–76.
3Bartlett H, Howells K, Ashley A.Evaluation of Sonning Common Health Walks Scheme. Oxford: Oxford Centre for Health Care Research and Evaluation, Oxford Brookes University, 1996.
4Harland J, White M, Drinkwater C,et al. The Newcastle exercise project: a randomised controlled trial of methods to promote physical activity in primary care.BMJ 1999;319:828–32.
5Steptoe A, Doherty S, Rink E,et al. Behavioural counselling in general practice for the promotion of healthy behaviour among adults at increased risk of coronary heart disease: randomised trial.BMJ 1999;319:943–7
6Stephens W, Hillsdon M, Thorogood M,et al. Cost-effectiveness of a primary care based physical activity intervention in 45–74 year old men and women: a randomised controlled trial.Br J Sports Med
1998;32:236–41.
7Taylor AH, Doust J, Webborn N. Randomised controlled trial to examine the effects of a GP exercise referral programme in Hailsham, East Sussex, on modifiable coronary heart disease risk factors.J Epidemiol Community Health 1998;52:595–601.
8Cooper AR, Moore LA, McKenna J,et al. What is the magnitude of blood pressure response to a programme of moderate intensity activity? Randomised controlled trial among sedentary adults with unmedicated hypertension.Br J Gen Pract 2000;50:958–62.
9Smith BJ, Bauman, AE, Bull, FC,et al. Promoting physical activity in general practice: a controlled trial of written advice and information materialsBr J Sports Med 2000;34:262–7.
10Lamb SE. A postal physical activity questionnaire for the UK population. http://www.hss.coventry.ac.uk/physical activity questionnaire.htm (2001).
11Sallis JF, Haskell Wl, Wood PD,et al. Physical activity assessment methodology in the Five-City project.Am J Epidemiol 1985;121:91– 106.
12Bonnefoy M, Normand S, Pachiandi C,et al. Simultaneous validation of 10 physical activity questionnaires in older men: a doubly labeled water study.J Am Geriatric Soc 2001;49:28–35.
13Marcus BJ, Simpkin C The stages of exercise behaviour.J Sports Med Phys Fitness 1993;33:83–8.
14Siconofi SF, Ewing Garber C, Lasater T,et al. A simple, valid step test for estimating maximal oxygen uptake in epidemiologic studiesAm J Epidemiol 1985;121:382–90.
15Pocock SJ. In:Clinical trials. A practical approach. Chichester: Wiley, 1983:125.
16Hollis S, Campbell F What is meant by intention to treat analysis? Survey of published randomised controlled trials.BMJ 1999;319:670–4. 17Hakin AA, Petrovich H, Birchfield CN,et al. Effects of walking on
mortality among non-smoking retired men.NEJM 1998;338:94–9. 18Tudor-Locke CE, Myers AM. Challenges and opportunities for
measuring physical activity in sedentary adults.Sports Med 2001;31:91–100.
19Ashley A, Bartlett H, Lamb S,et al. Evaluation of the Thames Valley Health Walks Scheme. Participant’s feedback survey. OCHRAD report 9. Oxford: Oxford Centre for Health Care Research and Development, 2000.
20Oxman AD, Guyatt GH. A consumers guide to sub-group analyses.Ann Intern Med 1992;116:78–84.
21Halbart JA, Silagy CA, Finucane PM,et al. Physicial activity and cardiovascular risk factors: effect of advice from an exercise specialist in Australian general practice.Med J Aust 2000;173:85–7.
22Yudkin PL, Stratton IM. How to deal with regression to the mean in intervention studies.Lancet 1996;347:241–3
23Dodd T, ed.All change? The Health Education Monitoring Survey one year on. London: The Stationery Office, 1998.
24Sarkin JA, Nichols JF, Sallis JF,et al. Self-report measures and scoring protocols affect prevalence estimates of meeting physical activity guidelines.Med Sci Sports Exer 2000;32:149–56
25Aller KM, Pivarnik JM. Stability and convergent validity of three physical activity assessments.Med Sci Sports Exer 2001;33:671–9.
26Philippaerts RM, Westerterp KR, Lefevre J. Comparison of two questionnaires with a tri-axial accelerometer to assess physical activity parameters.Int J Sports Med 2001;22:34–9.
www.jech.com
You can access the FULL TEXT of articles cited in the Journal of Epidemiology and Community Health online if the citation is to one of the more than 200 journals hosted by HighWire (http://highwire.stanford.edu) without a subscription to that journal.
There are also direct links from references to the Medline abstract for other titles.