University of Warwick institutional repository: http://go.warwick.ac.uk/wrap
This paper is made available online in accordance with publisher policies. Please scroll down to view the document itself. Please refer to the repository record for this item and our policy information available from the repository home page for further information.
To see the final version of this paper please visit the publisher’s website. Access to the published version may require a subscription.
Author(s): Jonathan P. Bradley, Sitaram P. Velaga, Oleg N. Antzutkin, and Steven P. Brown
Article Title: Probing Intermolecular Crystal Packing in γ-Indomethacin by High-Resolution 1H Solid-State NMR Spectroscopy
Year of publication: 2011 Link to published article:
http://dx.doi.org/10.1021/cg200277a
Publisher statement: “This document is the Accepted Manuscript version of a Published Work that appeared in final form in
Crystal Growth and Design, copyright © American Chemical Society after peer review and technical editing by the publisher.
To access the final edited and published work see
Probing Intermolecular Crystal Packing in
-Indomethacin by High-Resolution
1
H Solid-State
NMR Spectroscopy
Jonathan P. Bradley,1Sitaram P. Velaga,2Oleg N. Antzutkin,1,3Steven P. Brown*1
(1) Department of Physics, University of Warwick, Coventry CV4 7AL, UK, (2) Department of
Health Science, Luleå University of Technology, Luleå, S-97187, Sweden, (3) Chemistry of
Interfaces, Luleå University of Technology, Luleå, S-97187, Sweden
Email: [email protected]
RECEIVED DATE (to be automatically inserted after your manuscript is accepted if required
according to the journal that you are submitting your paper to)
Abstract
An NMR crystallography approach that combines experimental solid-state magic-angle-spinning
(MAS) NMR with calculation is applied to the polymorph of the pharmaceutical molecule,
indomethacin. First-principles calculations (GIPAW) for the full crystal structure and an isolated
molecule show changes in the 1H chemical shift for specific aliphatic and aromatic protons of over1 ppm that are due to intermolecular CH- interactions. For the OH proton, 1H double-quantum (DQ) CRAMPS (combined rotation and multiple-pulse spectroscopy) spectra reveal intermolecular H-H
proximities to the OH proton of the carboxylic acid dimer as well as to specific aromatic CH protons.
curves (as a function of the DQ recoupling time) to be extracted for the aromatic CH protons. Supported
by eight-spin density-matrix simulations, it is shown how the relative maximum intensities and rates of
build-up provide quantitative insight into intramolecular and intermolecular H-H proximities that
characterise the crystal packing.
1. Introduction
Solid-state NMR is an important method for pharmaceutical analysis.1-3 While 13C cross-polarisation (CP) MAS is an established workhouse technique, the power of high-resolution 1H solid-state NMR experiments is starting to be recognised:1H chemical shifts have been determined from one-dimensional fast-MAS spectra and two-one-dimensional1H-13C correlation spectra,4-13with H-H proximities being identified in two-dimensional 1H-1H DQ (double-quantum) MAS and DQ CRAMPS (combined rotation and multiple-pulse spectroscopy) spectra.10-12,14,15
The emerging field of NMR crystallography of organic solids employs experimental solid-state
NMR usually in combination with calculation to probe solid-state structures.16-20 In the context of organic molecules, a particular focus is upon the interactions that govern the adopted intermolecular
packing, notably hydrogen bonding and aromatic -effects.1H solid-state NMR is well suited to this challenge on account of the marked sensitivity of the 1H chemical shift to hydrogen bonding and aromatic ring current effects.21-23 In particular, 1H-1H double-quantum spectroscopy is a powerful method for identifying proton-proton proximities up to ~3.5 Å, be they intra- or intermolecular
proximities.24,25 By employing advances in homonuclear 1H decoupling that deliver high-resolution 1H spectra,26,27the 1H-1H DQ CRAMPS technique28-32 has been applied to the potassium salt of penicillin G,33 organometallic species formed on a silica surface,34,35 pharmaceutical molecules,12,14,15,36 and the disaccharide-maltose.37
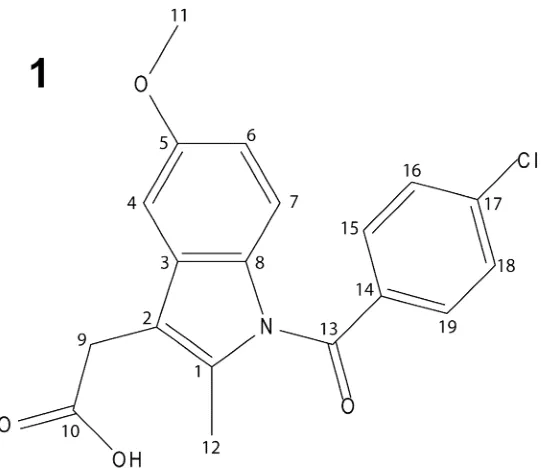
This paper considers the polymorph of indomethacin,
1-(4-chlorobenzoyl)-5-methoxy-2-methyl-1H-indole-3-acetic acid, 1, which is a non-steroidal drug with anti-inflammatory, anti-pyretic
characterised anhydrous polymorphs (that are labelled , and ) crystal structures are available for
theandforms.38,39 13C CP MAS spectra have been reported for the crystalline polymorphs as well as amorphous forms of indomethacin,13,40-42while a recent study has presented1H-13C and1H-1H DQ two-dimensional spectra for an indomethacin-polymer dispersion together with a 1H-1H DQ MAS spectrum of-indomethacin.13Amorphous forms, dispersions as well as co-crystals of indomethacin have and are being extensively studied on account of the poor solubility exhibited by indomethacin and hence its
limited bioavailability.43-47
The aim of this paper is, using-indomethacin as a case study, to show how quantitative insight
into intermolecular crystal packing is obtained from a combined approach that brings together advanced
high-resolution 1H solid-state NMR experiments with first-principles GIPAW (gauge-including projector augmented wave) chemical shift calculations and multi-spin density-matrix simulations.
2. Results
[image:4.595.164.437.261.496.2]2.1 Assignment and Crystal Structure Analysis of1H and13C Chemical Shifts
transfer) pulse-sequence elements ensures that each peak corresponds to a one-bond C-H correlation. As
such, note that no correlation peaks are observed for the carboxylic acid1H resonance (this region of the spectrum is not shown in Figure 1). With the exception of C15 and C19, separate peaks are resolved for
the distinct aliphatic and aromatic protonated 13C resonances, thus allowing the experimental determination of the 13C and 1H chemical shifts. The observed spectral resonances are assigned by means of GIPAW chemical shift calculations for the full periodic crystal structure (see Table 1)
-indomethacin crystallizes in the centrosymmetric triclinic P1 space group with one molecule in the
asymmetric unit. Note that the atom numbering system used here is that employed by Basavoju et al;44 various alternative numbering schemes have been used in the published single-crystal X-ray structure39 and other reports of solid-state NMR13C CP MAS data by Apperley et al.,40Masuda et al.,41Guilbaud et al.,42and Pham et al.13Interestingly, with the exception of H16, the aromatic1H resonances are grouped according to the two separate aromatic moieties (H4: 5.8 ppm, H6: 6.1 ppm, H7 5.8 ppm as compared to
H15: 7.3 ppm, H16: 5.7 ppm, H18: 7.2 ppm, H19: 7.3 ppm). The specific case of the H161H chemical shift is discussed below.
Figure 1. (a) 1H (500 MHz, 12.5 kHz MAS) single-quantum (SQ) (DUMBO, decoupling using mind-boggling optimisation)48 – 13C SQ refocused INEPT49 spectrum with skyline projections of -indomethacin, recorded with the INEPT spin-echo durations = ' = 1.12 ms. The experimental time
was 18 h. The base contour level is at 18% of the maximum peak intensity. (b-e) Representations of the
geometrically-optimised (CASTEP) crystal structure of-indomethacin showing the exposure of the (b)
C9 CH2protons, (c) C11 CH3protons and (d) C16 aromatic CH proton to intermolecular aromatic ring
currents, that lead tocrystmolchanges of at least1 ppm for the1H chemical shift (see Table 1) and (e) close C–H∙∙∙O contacts arising from how the discrete carboxylic acid dimer synthons form layers one
upon another (see discussion in the main text). In (e), the H∙∙∙O distances are indicated in blue, while the
Table 1. Experimentala and calculatedb (GIPAW) 13C and 1H isotropic chemical shifts for -indomethacin
(13C) (1H)
Site Expt. Calc.CRYST.c Calc.ISOL.dExpt. Calc.CRYST.c Calc.ISOL.d
1 134.5 140.0 140.2 - -
-2 112.7 115.2 114.9 - -
-3 132 132.4 131.5 - -
-4 97.7 95.6 92.6 5.8 5.8 6.3
5 156.7 158.4 158.9 - -
-6 112.4 111.1 111.3 6.1 6.1 5.8
7 115.5 115.4 113.6 5.8 5.9 5.8
8 131.1 131.0 130.4 - -
-9a
28.1 25.6 22.2 1.7e 1.4 3.3
9b 1.7 3.6
10 179 180.2 171.8 - -
-11 55.1 54.4 51.7 2.2 2.3f 3.5f
12 13.5 11.2 6.9 1.8 1.8f 2.1f
13 167.7 169.4 167.9 - -
-14 136.7 134.0 135.0 - -
-15 131.8 134.1 132.2 7.3 7.1 6.8
16 126.9 128.0 128.6 5.7 5.6 6.6
17 140.1 145.4 145.6 - -
-18 129.8 130.3 129.1 7.2 7.0 6.9
19 131.8 132.4 130.6 7.3 7.2 7.3
OH - - - 12.7 14.4 7.2
a
Determined from 13C CPMAS (Figure S2) and 13C-1H correlation (Figure 1) spectra. b REF = 169.5
ppm and 30.6 ppm for 13C and 1H, respectively. c Calculation for the full periodic crystal structure. d Calculation for an isolated molecule. e Only a single low-intensity peak is observed for the CH2
Valuable insight into intermolecular interactions, namely hydrogen bonding and aromatic
interactions, is provided by a comparison of calculations for the full crystal structure with those for
isolated molecules.20,50-52 As shown in Table 1, the largest isolated molecule to crystal change in the calculated1H chemical shift is for the OH proton (crystmol= 7.2 ppm) of the carboxylic acid group that forms an intermolecular hydrogen-bonded dimer: The two inversion related -indomethacin molecules
in the crystal structure form centrosymmetric discrete carboxylic acid homodimer synthons with an O–
H∙∙∙O angle of 173º and H...O and O...O distances of 1.75 and 2.66 Å, respectively (note that distances
are stated here and throughout the paper for the (CASTEP) geometry-optimised crystal structure).
Similarly large crystmol changes have been observed for the 1H chemical shifts of NH moieties in L-histidine.HCl.H2O,50uracil51and campho[2,3-c]pyrazole20that exhibit intermolecular NH…X hydrogen
bonding.
It is of particular interest to consider the other cases of crystmolchanges with magnitude of at least 1 ppm for the 1H chemical shift, namely,1.9 ppm for both of the C9 CH2protons,1.2 ppm for
the C11 CH3 protons and 1.0 ppm for the C16 aromatic CH proton. The origin of these significant
crystmol
changes is revealed by Figures 1b, 1c and 1d, which show CHinteractions, whereby these
protons are pointing into the aromatic moiety of a neighbouring molecule. Aromatic ring current effects
on1H solid-state NMR chemical shifts have been previously observed and quantified for more extreme cases of large hexabenzocoronenes53and host-guest interactions in molecular tweezers54-56or calixarene complexes.57The distance from the particular proton to the centre of the specific aromatic moiety is 2.72 Å (9b) and 3.12 Å (9a) for the C9 CH2protons, 2.68 Å for the nearest C11 CH3proton and 3.42 Å for
the C16 aromatic CH proton. The angles between the CH group and the centre of the specific aromatic
moiety are 133º (9b) and 118º (9a) for the C9 CH2protons, 142º for the nearest C11 CH3proton and 84º
for the C16 aromatic CH proton. Therefore, the magnitude of the crystmolchange is observed to be a direct measure of the strength of a CHinteraction (for the case of the C11 CH3 group, note that fast
emphasised that the comparison of the crystal and isolated molecule calculations has revealed how the
effect of the intermolecular aromatic ring current explains the evident deviation of the H16 CH 1H chemical shift from that of the other1H chemical shifts (H15, H18 and H19) for the same aromatic ring.
An analysis of the crystal structure reveals that the discrete carboxylic acid dimer synthons form
layers one upon another – see Figure S8 in the Supporting Information. Close C–H∙∙∙O contacts between
the layers are observed (see Figure 1e), suggesting weak C–H∙∙∙O (C15–H15∙∙∙OH: d(H15∙∙∙O) = 2.51 Å,
d(C15∙∙∙O) = 3.40 Å, θ = 138º) and bifurcated weak C–H∙∙∙O (C18–H18∙∙∙O=C: d(H18∙∙∙O) = 2.59 Å, d(C18∙∙∙O) = 3.22 Å, θ = 116º; C19–H19∙∙∙O=C: d(H19∙∙∙O) = 2.65 Å, d(C19∙∙∙O) = 3.25 Å, θ = 115º)
hydrogen bonds. However, Table 1 reveals thecrystmolchanges to be +0.3 ppm for H15 and +0.1 ppm and 0.1 ppm for H18 and H19, respectively. This compares to crystmolchanges of up to 2 ppm in uracil51 and maltose anomers,52 thus, indicating very weak or non-existent weak C–H∙∙∙O hydrogen bonding interactions in the -indomethacin crystal structure. Specifically, it is the significant deviation
from linearity for the C–H∙∙∙O angles in the -indomethacin crystal structure that reduces the interaction
strength – see Figure 2 of Ref.52for the maltose anomers that shows that thecrystmolchange and hence C–H∙∙∙O hydrogen bonding strength is sensitive to the C–H∙∙∙O angle. As here, the crystmol
changes are
negligible for C–H∙∙∙O angles of less than 135º.
2.21H-1H DQ-SQ CRAMPS NMR Experiments: Proton-Proton Proximities for the Resolved OH
Resonance
Two-dimensional 1H DQ spectroscopy is a powerful method for identifying proton-proton proximities in the solid state.25 A 1H (600 MHz) DQ CRAMPS30 spectrum of -indomethacin is presented in Figure 2. There are only four resolved resonances, corresponding to the aliphatic protons,
two resonances for the aromatic protons and the OH proton – the resolution is, however, much improved
of Ref.13 In Figure 2, in addition to Haliph-Haliph, Haliph-Harom, and Harom-Harom peaks, DQ peaks are
observed at DQ = 12.7 + 12.7 = 25.4 ppm and at DQ = 12.7 + 7.2 = 19.9 ppm, corresponding to the
proximity of an OH proton to another OH proton (DQ= 25.4 ppm) and to aromatic CH protons (DQ=
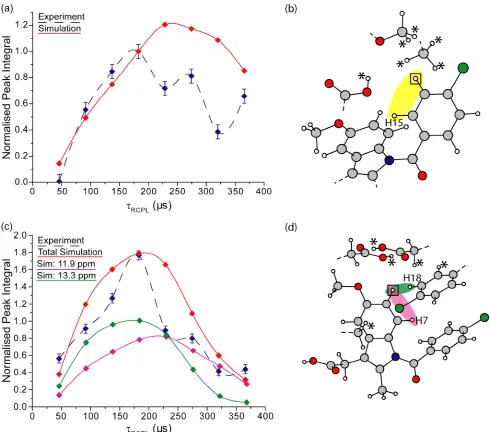
19.9 ppm). Figures 3a & 3b show how the 1H DQ integrated experimental intensity builds up (blue dashed lines) as a function of the total DQ recoupling time, rcpl, for these DQ peaks at the OH
single-quantum (SQ) resonance forDQ= 25.4 (Figure 3a) and 19.9 ppm (Figure 3b).
The experimental results are compared to SPINEVOLUTION58 eight-spin density-matrix simulations (red solid lines) for a cluster of 1H nuclei corresponding to the OH proton and the seven nearest protons (see Figure 3c and Table 2). For the OOH DQ peak in Figure 3a, there is only one
H-H proximity (2.38 Å) for the simulated cluster of eight spins (i.e., the intermolecular OH-H-OH-H proximity
for the hydrogen-bonded intermolecular carboxylic acid dimer highlighted in yellow in Figure 3c). In
contrast, the red solid line in Figure 3b corresponds to the summed intensity for separate simulated 1H DQ intensities due to proximities between the OH proton and 5 different aromatic protons: H18 (DQ=
12.7 + 7.2 = 19.9 ppm, 2.48 Å), H6 (DQ = 12.7 + 6.1 = 18.8 ppm, 2.89 and 3.18 Å) and H15 & H19
(DQ = 12.7 + 7.3 = 20.0 ppm, 3.33 and 3.38 Å). In the experimental 1H DQ CRAMPS spectra (see
Figure 2), it is not possible to resolve these separate 1H DQ peaks, and thus the integrated experimental intensity (blue dashed line) corresponds to a sum over the distinct DQCs (double-quantum coherences).
Separate 1H DQ peaks are, however, resolved in the simulations; for example, Figure 3b shows the separate contributions from the OH-H18 and OH-H6 proton pairs as green and pink solid lines,
respectively.
DQC corresponding to the shortest H-H distance. Comparing the red solid line in Figure 3a for the
OH-OH proximity of 2.38 Å to the green and pink lines in Figure 3b for the OH-OH-CH18 and OH-OH-CH6
proximities of 2.48 Å (CH18) and 2.89 and 3.18 Å (2 × CH6), it is evident that maximum simulated
intensity is indeed for the closer OH-OH proximity. (Note the different labelling of the vertical axes in
Figure 3a & 3b.) Experimentally, the OH-OH DQ peak is of lower intensity than the OH-CH aromatic
[image:11.595.118.470.254.575.2]DQ peak due to the contribution of multiple DQ coherences to the latter.
Figure 2. A 1H (600 MHz, 12.5 kHz MAS) DQ CRAMPS30 (with eDUMBO-122 1H homonuclear
decoupling59) spectrum of -indomethacin with skyline projections. The excitation and reconversion of
1
H DQ coherences is achieved using four elements of POST-C7 dipolar recoupling60 (total recoupling time of 183 µs) at a 1H nutation frequency of 87 kHz. The experimental time was 2 h. The F1 = 2F2
diagonal is shown as a dashed line, with horizontal lines indicating DQ peaks due to specific H-H
Figure 3. (a, b) 1H DQ build-up curves as a function of the total DQ recoupling time, rcpl, for the (a)
OH-OH DQ peak atDQ= 12.7 + 12.7 = 25.4 ppm and (b) the OH-CH aromatic DQ peak atDQ= 12.7
+ 7.2 = 19.9 ppm, in both cases, at the OH SQ frequency. Integrated experimental intensities extracted
from 1H DQ CRAMPS spectra (see Figure 2) are shown as blue dashed lines (normalised to the maximum intensity at rcpl = 229 µs for the OH-OH aromatic DQ peak). The experimental build-up is
compared to simulations (SPINEVOLUTION58) for the cluster of eight 1H nuclei shown in (c) corresponding to the OH proton (indicated by a square box in (c)) and the seven nearest protons (OH,
H18, 2×H6, and three other protons denoted by * in (c), see Table 2). While in (a), the red solid line
corresponds to the simulated peak intensity for the single OH-OH proximity for the simulated cluster of
eight spins (highlighted in yellow in (c)), the red solid line in (b) corresponds to the summed intensity
for separate simulated 1H DQCs due to proximities between the OH proton and 5 different aromatic protons: H18, 2×H6, H15 and H19. The separate simulated intensities for the OH-H18 (DQ= 12.7 + 7.2
= 19.9 ppm, 2.48 Å) and OH-H6 (DQ= 12.7 + 6.1 = 18.8 ppm, 2.89 and 3.18 Å) DQ peaks are shown
as green and pink solid lines, respectively. Simulated peak intensities are normalised with respect to the
intensity atrcpl= 229 µs for the OH-OH aromatic DQ peak. Note the different vertical axis labelling in
[image:13.595.47.526.593.751.2](a) and (b). Lines linking peak intensities are included as guides for the eye.
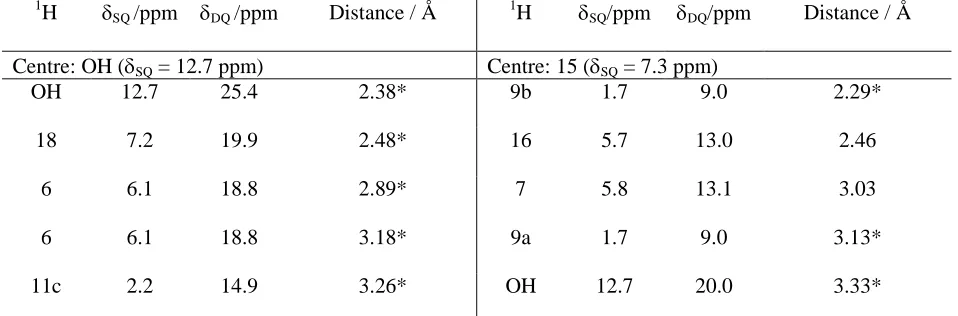
Table 2.DQ frequencies and H-H distancesafor the nearest seven1H nuclei to the OH and aromatic CH
1
H nuclei in the geometry-optimised (CASTEP) crystal structure of-indomethacin.
1
H SQ/ppm DQ/ppm Distance / Å 1H SQ/ppm DQ/ppm Distance / Å
Centre: OH (SQ= 12.7 ppm) Centre: 15 (SQ= 7.3 ppm)
OH 12.7 25.4 2.38* 9b 1.7 9.0 2.29*
18 7.2 19.9 2.48* 16 5.7 13.0 2.46
6 6.1 18.8 2.89* 7 5.8 13.1 3.03
6 6.1 18.8 3.18* 9a 1.7 9.0 3.13*
15 7.3 20.0 3.33* 18 7.2 14.5 3.93*
19 7.3 20.0 3.38* 4 5.8 13.1 4.02*
Centre: 4 (SQ= 5.8 ppm) Centre: 16 (SQ= 5.7 ppm)
11a,b,c 2.2 8.0 2.30, 2.35, 3.63 11b,c 2.2 7.9 2.44*, 2.65*
9b 1.7 7.5 2.55 15 7.3 13.0 2.46
12b,a 1.8 7.6 3.06*, 3.27* 12a,b,c 1.8 7.5
3.07*, 3.69*,
3.31*
11a 2.2 8.0 3.48* OH 12.7 18.4 3.40*
Centre: 6 (SQ= 6.1 ppm) Centre: 18 (SQ= 7.2 ppm)
18 7.2 13.3 2.22* 6 6.1 13.3 2.22*
7 5.8 11.9 2.47 19 7.3 14.5 2.48
OH 12.7 18.8 2.89* OH 12.7 19.9 2.48*
OH 12.7 18.8 3.18* 7 5.8 13.0 2.91*
9a 1.7 7.8 3.34* 12b 1.8 9.0 3.85*
11a 2.2 8.3 3.46* 15 7.3 14.5 3.93*
19 7.3 13.4 3.81* 11a 2.2 9.4 3.95*
Centre: 7 (SQ= 5.8 ppm) Centre: 19 (SQ= 7.3 ppm)
6 6.1 11.9 2.47 18 7.2 14.5 2.48
18 7.2 13.0 2.91* 11c 2.2 9.5 2.48*
15 7.3 13.1 3.03 12b,a 1.8 9.1 2.44*, 3.53*
12a 1.8 7.6 3.62* OH 12.7 20.0 3.38*
11a 2.2 8.0 3.67* 7 5.8 13.1 3.69
19 7.3 13.1 3.69 6 6.1 13.4 3.81*
12b 1.8 7.6 3.81*
a
Intermolecular proximities are indicated by *.
Importantly, Bradley et al. have further shown that the relative intensity of DQ peaks due to
sixth power.61Using this analysis, the intensity of the OH-CH aromatic DQ peak relative to that of the OH-OH DQ peak can be estimated as [(2.38)6/(2.48)6] + [(2.38)6/(2.89)6] + [(2.38)6/(3.18)6] + [(2.38)6/(3.33)6] + [(2.38)6/(3.38)6] = 1.52, i.e., in excellent agreement to both the summed simulated (red line) and experimental (dashed blue line) intensity in Figure 3b. Therefore, for the resolved OH
resonances in the 1H DQ CRAMPS spectrum of -indomethacin, the build-up of 1H DQ intensity is a rich source of quantitative information about intermolecular H-H proximities.
2.3 1H (DQ-DUMBO) –13C SQ refocused INEPT NMR Experiments: Proton-Proton Proximities
for the Aromatic CH Resonances
Even under eDUMBO-122 1H homonuclear decoupling,59 it is only possible to resolve two
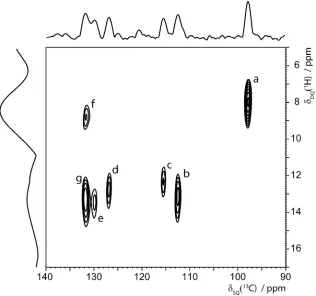
separate peaks for the seven distinct CH aromatic1H nuclei in-indomethacin. Thus, it is not possible to extract separate1H DQ build-up curves from 1H-1H DQ-SQ CRAMPS spectra, as was the case for the OH proton. Separate DQ peaks for the CH aromatic 1H nuclei can, however, be resolved using the 1H (DQ-DUMBO) –13C SQ refocused INEPT37pulse sequence shown in Figure 1c, taking advantage of the much better resolution in a13C as compared to a1H spectrum. Specifically, Figure 4 shows the aromatic region of a1H (DQ-DUMBO) –13C SQ refocused INEPT spectrum of-indomethacin recorded at a1H Larmor frequency of 850 MHz. As in the case of the 1H (SQ-DUMBO) – 13C SQ refocused INEPT spectrum of -indomethacin recorded at a 1H Larmor frequency of 600 MHz presented in Figure 1, separate 13C resonances are resolved in Figure 4 for six of the seven CH aromatic moieties (C15 and C19 overlap). The use of a short spin-echo duration, = ' = 1.6 ms, for the refocused INEPT transfer
Figure 4.The aromatic region of a 1H (850 MHz, 12.5 kHz MAS) (DQ-DUMBO) – 13C SQ refocused INEPT correlation spectrum of -indomethacin with skyline projections recorded using the pulse
sequence presented in Ref.37 employing eDUMBO-122 1H homonuclear decoupling59 and spin-echo
durations=' = 1.6 ms. The excitation and reconversion of1H DQ coherences is achieved using three elements of POST-C7 dipolar recoupling60 (total recoupling time,rcpl, of 137 µs) at a 1H nutation
frequency of 87.5 kHz. The experimental time was 29 h. The peaks are assigned in Table 3. (Columns
through the observed peaks are shown in Figure S4 in the Supporting Information.) The base contour
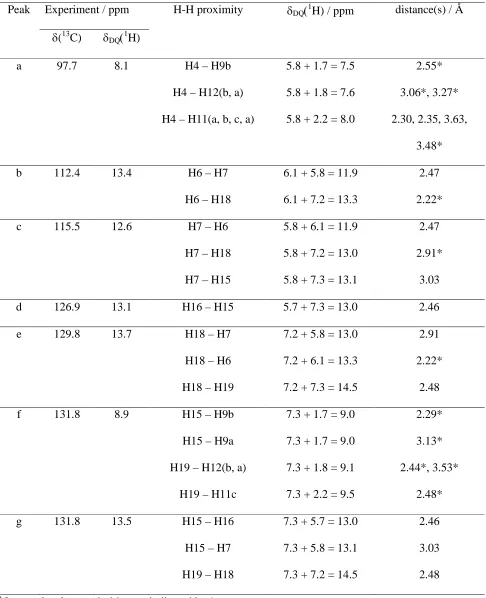
Table 3. Assignment of the DQ resolved peaks in the 1H (DQ-DUMBO) – 13C SQ refocused INEPT spectrum of-indomethacin in Figure 4 to specific H-H proximities.a
Peak Experiment / ppm H-H proximity DQ1H) / ppm distance(s) / Å
(13C) DQ1H)
a 97.7 8.1 H4 – H9b
H4 – H12(b, a)
H4 – H11(a, b, c, a)
5.8 + 1.7 = 7.5
5.8 + 1.8 = 7.6
5.8 + 2.2 = 8.0
2.55*
3.06*, 3.27*
2.30, 2.35, 3.63,
3.48*
b 112.4 13.4 H6 – H7
H6 – H18
6.1 + 5.8 = 11.9
6.1 + 7.2 = 13.3
2.47
2.22*
c 115.5 12.6 H7 – H6
H7 – H18
H7 – H15
5.8 + 6.1 = 11.9
5.8 + 7.2 = 13.0
5.8 + 7.3 = 13.1
2.47
2.91*
3.03
d 126.9 13.1 H16 – H15 5.7 + 7.3 = 13.0 2.46
e 129.8 13.7 H18 – H7
H18 – H6
H18 – H19
7.2 + 5.8 = 13.0
7.2 + 6.1 = 13.3
7.2 + 7.3 = 14.5
2.91
2.22*
2.48
f 131.8 8.9 H15 – H9b
H15 – H9a
H19 – H12(b, a)
H19 – H11c
7.3 + 1.7 = 9.0
7.3 + 1.7 = 9.0
7.3 + 1.8 = 9.1
7.3 + 2.2 = 9.5
2.29*
3.13*
2.44*, 3.53*
2.48*
g 131.8 13.5 H15 – H16
H15 – H7
H19 – H18
7.3 + 5.7 = 13.0
7.3 + 5.8 = 13.1
7.3 + 7.2 = 14.5
2.46
3.03
2.48
a
It is to be noted that the b and e peaks in Figure 4 at the C6 and C18 13C resonances are both centred close to DQ1H) = 6.1 + 7.2 = 13.3 ppm for the H6-H18 DQC and not at DQ1H) = 6.1 + 5.8 =
11.9 ppm for the H6-H7 DQC and DQ1H) = 7.2 + 7.3 = 14.5 ppm for the H18-H19 DQC. This
indicates that the H6-H18 distance is closer than the intramolecular proximity of two neighbouring CH
aromatic protons (H6-H7 and H18-H19). Specifically, the closest proximity between two aromatic
protons is indeed the intermolecular H6-H18 contact at 2.22 Å, with the three cases of intramolecular
proximity of two neighbouring CH aromatic protons (H6-H7, H15-H16, and H18-H19) at distances of
2.46-2.48 Å. Figure 4 also shows that only H4 does not have a close proximity to another aromatic CH
proton, as is apparent from the observation of a 1H DQ peak at 8.1 ppm (peak a) for the C4 13C resonance and the absence of a1H DQ peak at ~13 ppm.
Using the resolution provided by the 1H (DQ-DUMBO) –13C SQ refocused INEPT experiment, it is possible to extract1H DQ build-up curves for the separate aromatic carbon resonances. As examples of the structural insight into intra- and intermolecular H-H proximities inherent to such curves, Figures
5a & 5c present the experimental 1H DQ integrated intensity build up (blue dashed line) for the C16 (peak d) and C6 (peak b)13C resonances, respectively, together with simulated curves for the clusters of eight protons shown in Figures 5b & 5d (solid lines). (Experimental and simulated 1H DQ build-up curves for the other peaks in Figure 4 are shown in Figures S5 & S6 in the Supporting Information.)
Specifically, the C16 curve in Figure 5a constitutes a reference case, since this corresponds to a single
H-H proximity, namely an intramolecular proximity of two neighbouring CH aromatic protons,
H16-H15 at 2.46 Å. For CH6, as noted above, there are two H-H close proximities that contribute to the
observed experimental intensity, namely the intermolecular proximity (2.22 Å) of H6 to H18 atDQ1H)
= 6.1 + 7.2 = 13.3 ppm and the intramolecular proximity (2.47 Å) of H6 to H7 atDQ1H) = 6.1 + 5.8 =
11.9 ppm. Experimentally, the signal to noise is insufficient to resolve separate 1H DQ peaks at these close frequencies, and thus the integrated experimental intensity (blue dashed line) in Figure 5c
simulations, and thus Figure 5c shows the separate contributions from the H6-H18 and H6-H7 proton
[image:19.595.53.543.148.580.2]pairs as green and pink solid lines, respectively, together with their sum (red solid line).
Figure 5.(a, c)1H DQ build-up curves as a function of the total DQ recoupling time,rcpl, for (a) peak d
peak d (CH16)). Simulated (SPINEVOLUTION58) peak intensities for the clusters of eight 1H nuclei shown in (b) and (d) corresponding to the (b) H16 and (d) H6 proton (indicated by a square box) and the
seven nearest protons (labelled or denoted by *) are shown as red solid lines (normalised to the intensity
at rcpl = 183 µs for peak d (CH16)). In (c), the green and pink solid lines correspond to the separate
simulated DQ intensities for the H6-H18 (DQ1H) = 6.1 + 7.2 = 13.3 ppm, 2.22 Å) and H6-H7 (DQ1H)
= 6.1 + 5.8 = 11.9 ppm, 2.47 Å) proton pairs, respectively. Note the different vertical axis labelling in
(a) and (c). Lines linking peak intensities are included as guides for the eye.
A third important conclusion of the previous analysis of1H DQ build-up for a model dipeptide is that, comparing1H DQ build-up curves for DQCs corresponding to the closest H-H distance for specific protons, the rate of1H DQ up is a reliable indicator of the closest H-H distance, with faster build-up observed for a shorter H-H distance.61 The shorter closest H-H proximity of 2.22 Å for H6, as compared to 2.46 Å for H16, is thus reflected in slightly faster build-up observed in Figure 5c for the
solid green line in Figure 5c corresponding to the H6-H18 DQC: maximum intensity is observed atrcpl
equal to 183 s in Figure 5c as compared to 229 s in Figure 5a (corresponding to 4 or 5 elements of
POST-C7 recoupling at 12.5 kHz MAS). While the maximum experimental intensity is observed at the
samercpl of 183s in both cases, it is evident that there is a faster fall-off in1H DQ intensity in Figure
5c as compared to Figure 5a. Moreover, comparing the green and pink solid lines corresponding to the
separate simulated1H DQ build-up for the H6-H18 (DQ1H) = 6.1 + 7.2 = 13.3 ppm, 2.22 Å) and
H6-H7 (DQ1H) = 6.1 + 5.8 = 11.9 ppm, 2.46 Å) proton pairs, greater maximum intensity is again observed
for the closer H-H proximity, remembering the analogous observation above for the separate
contributions to the OH-CH aromatic1H DQ peak in Figure 3b. 3. Summary
Taking the polymorph of indomethacin as a case study, this paper has showcased two NMR
packing of organic molecules in the solid state. First, a comparison of 1H chemical shifts calculated using the GIPAW method for the full crystal structure and for an isolated molecule reveal changes of at
least 1 ppm for the CH9 CH2, CH11 CH3 and CH16 aromatic CH protons that are due to CH-
interactions. In particular, this explains the experimentally observed anomaly of the H16 aromatic 1H chemical shift being significantly different to that of the three other protons of the same aromatic
moiety. Second, a quantitative analysis of 1H DQ build-up curves based on the principles recently presented in Ref.61 has shown the power of this approach to probe subtle differences in H-H distances, be they intramolecular or intermolecular. For example, the closest proximity between two aromatic
protons in the crystal structure of-indomethacin is not the 2.5 Å intramolecular proximity between two
neighbouring aromatic protons, but rather a 2.2 Å intermolecular proximity between H6 and H18. This
is evident from the 1H DQ chemical shift corresponding to maximum intensity as observed in spectra obtained at natural abundance at 850 MHz using a recently presented 1H (DQ-DUMBO) – 13C (SQ) refocused INEPT experiment.37 By contrast, the resolution in a 1H-1H DQ CRAMPS spectrum is insufficient to resolve separate peaks for the aromatic protons. In this context, we note that, in his
Overview chapter to the recently published NMR Crystallography handbook, Harris identifies the 1H DQ experiment as a rare example of a solid-state NMR experiment that is capable of truly probing
intermolecular distances in organic solids (see page 12 of Ref.18).
Our work complements other recently published NMR crystallography approaches for organic
solids, namely proof-of-principle studies for the dipeptide -AspAla and thymol demonstrating the use
of 1H spin-diffusion experimental data (together with inputs from the known X-ray diffraction single-crystal structures, namely the unit-cell dimensions and space group) to determine the three-dimensional
packing arrangement,15,17,62 as well as a comparison of calculated and experimental1H chemical-shifts to identify the best-fit structure from an ensemble of trial structures generated by the1H spin-diffusion method for the dipeptide-AspAla63or by a crystal structure prediction approach for thymol.19 It is to be envisaged that such NMR crystallography approaches will find increasing application in the context
understanding of intermolecular interactions is very valuable for rationalising the observed physical
properties and behaviour of advanced pharmaceutical solids, e.g., co-crystals.
Acknowledgement.Funding from EPSRC and AstraZeneca is acknowledged. The UK 850 MHz
solid-state NMR Facility used in this research was funded by EPSRC and BBSRC, as well as the University
of Warwick including via part funding through Birmingham Science City Advanced Materials Projects 1
and 2 supported by Advantage West Midlands (AWM) and the European Regional Development Fund
(ERDF). The 500 MHz solid-state NMR spectrometer used in this research was funded through the
Birmingham Science City Hydrogen Energy project, with support from AWM. CASTEP calculations
were performed on the University of Warwick Centre for Scientific Computing cluster. We are grateful
to Accelrys for providing the Materials Studio Interface.
Supporting information available: (i) Experimental and simulation details, (ii) Additional solid-state
NMR spectra of -indomethacin: A 13C CP MAS spectrum; 1H MAS and CRAMPS spectra; columns through the distinct 13C resonances extracted from the 1H (DQ-DUMBO) – 13C SQ refocused INEPT spectrum; 1H DQ build-up curves for the resolved peaks in Figure 6, together with eight-spin SPINEVOLUTION simulated curves, (iii) Further discussion of experimental and simulated 1H DQ build-up curves, (iv) GIPAW-calculated chemical shift tensors for -indomethacin, (v) An analysis of
the crystal structure reveals that the discrete carboxylic acid dimer synthons form layers one upon
another (pdf), (vi) geometry-optimised (CASTEP) crystal structure of -indomethacin (.cif). This
(1) Harris, R. K.Analyst2006,131, 351.
(2) Geppi, M.; Mollica, G.; Borsacchi, S.; Veracini, C. A. Appl. Spectrosc. Rev.2008,43, 202. (3) Vogt, F. G.Future Med. Chem.2010,2, 915.
(4) Yates, J. R.; Dobbins, S. E.; Pickard, C. J.; Mauri, F.; Ghi, P. Y.; Harris, R. K. Phys. Chem. Chem. Phys.2005,7, 1402.
(5) Vogt, F. G.; Brum, J.; Katrincic, L. M.; Flach, A.; Socha, J. M.; Goodman, R. M.; Haltiwanger, R. C.Cryst. Growth Des.2006,6, 2333.
(6) Harris, R. K.; Cadars, S.; Emsley, L.; Yates, J. R.; Pickard, C. J.; Jetti, R. K. R.; Griesser, U. J. Phys. Chem. Chem. Phys.2007,9, 360.
(7) Zhou, D. H.; Rienstra, C. M.Angew. Chem.-Int. Edit.2008,47, 7328.
(8) Harris, R. K.; Hodgkinson, P.; Larsson, T.; Muruganantham, A.; Ymen, I.; Yufit, D. S.; Zorin, V. Cryst. Growth Des.2008,8, 80.
(9) Clawson, J. S.; Vogt, F. G.; Brum, J.; Sisko, J.; Patience, D. B.; Dai, W.; Sharpe, S.; Jones, A. D.; Pham, T. N.; Johnson, M. N.; Copley, R. C. P.Cryst. Growth Des.2008,8, 4120.
(10) Vogt, F. G.; Clawson, J. S.; Strohmeier, M.; Edwards, A. J.; Pham, T. N.; Watson, S. A. Cryst. Growth Des.2009,9, 921.
(11) Khan, M.; Enkelmann, V.; Brunklaus, G.J. Am. Chem. Soc.2010,132, 5254.
(12) Bettini, R.; Menabeni, R.; Tozzi, R.; Pranzo, M. B.; Pasquali, I.; Chierotti, M. R.; Gobetto, R.; Pellegrino, L.J. Pharm. Sci.2010,99, 1855.
(13) Pham, T. N.; Watson, S. A.; Edwards, A. J.; Chavda, M.; Clawson, J. S.; Strohmeier, M.; Vogt, F. G.Mol. Pharm.2010,7, 1667.
(14) Griffin, J. M.; Martin, D. R.; Brown, S. P.Angew. Chem.-Int. Edit.2007,46, 8036.
(15) Salager, E.; Stein, R. S.; Pickard, C. J.; Elena, B.; Emsley, L. Phys. Chem. Chem. Phys. 2009, 11, 2610.
(16) Harris, R. K.Solid State Sci.2004,6, 1025.
(17) Elena, B.; Pintacuda, G.; Mifsud, N.; Emsley, L.J. Am. Chem. Soc.2006,128, 9555.
(18) Harris, R. K.; Wasylishen, R. E.; Duer, M. J., Eds. NMR Crystallography; Wiley: Chichester, 2009.
(19) Salager, E.; Day, G. M.; Stein, R. S.; Pickard, C. J.; Elena, B.; Emsley, L. J. Am. Chem. Soc. 2010,132, 2564.
(20) Webber, A. L.; Emsley, L.; Claramunt, R. M.; Brown, S. P. J. Phys. Chem. A2010,114, 10435. (21) Brown, S. P.; Spiess, H. W.Chem. Rev.2001,101, 4125.
(22) Brown, S. P.Macromol. Rapid Commun.2009,30, 688. (23) Lesage, A.Phys. Chem. Chem. Phys.2009,11, 6876. (24) Schnell, I.; Spiess, H. W.J. Magn. Reson.2001,151, 153. (25) Brown, S. P.Prog. Nucl. Magn. Reson. Spectrosc.2007,50, 199. (26) Madhu, P. K.Solid State Nucl. Magn. Reson.2009,35, 2.
(27) Hodgkinson, P.Ann. Rep. NMR Spectrosc.2011,72, 185.
(28) Schnell, I.; Lupulescu, A.; Hafner, S.; Demco, D. E.; Spiess, H. W. J. Magn. Reson.1998, 133, 61.
(29) Madhu, P. K.; Vinogradov, E.; Vega, S.Chem. Phys. Lett.2004,394, 423.
(30) Brown, S. P.; Lesage, A.; Elena, B.; Emsley, L.J. Am. Chem. Soc.2004,126, 13230.
(31) Mafra, L.; Gomes, J. R. B.; Trebosc, J.; Rocha, J.; Amoureux, J. P. J. Magn. Reson.2009, 196, 88.
(32) Mafra, L.; Siegel, R.; Fernandez, C.; Schneider, D.; Aussenac, F.; Rocha, J. J. Magn. Reson. 2009,199, 111.
(34) Avenier, P.; Lesage, A.; Taoufik, M.; Baudouin, A.; De Mallmann, A.; Fiddy, S.; Vautier, M.; Veyre, L.; Basset, J. M.; Emsley, L.; Quadrelli, E. A.J. Am. Chem. Soc.2007,129, 176.
(35) Avenier, P.; Taoufik, M.; Lesage, A.; Solans-Monfort, X.; Baudouin, A.; de Mallmann, A.; Veyre, L.; Basset, J. M.; Eisenstein, O.; Emsley, L.; Quadrelli, E. A.Science2007,317, 1056. (36) Harris, R. K.; Hodgkinson, P.; Zorin, V.; Dumez, J.-N.; Elena-Hermmann, B.; Emsley, L.;
Salager, E.; Stein, R. S.Magn. Reson. Chem.2010,48, S103.
(37) Webber, A. L.; Elena, B.; Griffin, J. M.; Yates, J. R.; Pham, T. N.; Mauri, F.; Pickard, C. J.; Gil, A. M.; Stein, R.; Lesage, A.; Emsley, L.; Brown, S. P. Phys. Chem. Chem. Phys.2010,12, 6970. (38) Chen, X. M.; Morris, K. R.; Griesser, U. J.; Byrn, S. R.; Stowell, J. G. J. Am. Chem. Soc.2002,
124, 15012.
(39) Cox, P. J.; Manson, P. L.Acta Cryst.2003,E59, 986.
(40) Apperley, D. C.; Forster, A. H.; Fournier, R.; Harris, R. K.; Hodgkinson, P.; Lancaster, R. W.; Rades, T.Magn. Reson. Chem.2005,43, 881.
(41) Masuda, K.; Tabata, S.; Kono, H.; Sakata, Y.; Hayase, T.; Yonemochi, E.; Terada, K. Int. J. Pharm.2006,318, 146.
(42) Guilbaud, J.-B.; Cummings, L.; Khimyak, Y. Z. Macromol. Symp.2007,251, 41. (43) Crowley, K. J.; Zografi, G.J. Pharm. Sci.2002,91, 492.
(44) Basavoju, S.; Bostrom, D.; Velaga, S. P.Pharm. Res.2008,25, 530.
(45) Alleso, M.; Velaga, S.; Alhalaweh, A.; Cornett, C.; Rasmussen, M. A.; van den Berg, F.; de Diego, H. L.; Rantanen, J.Anal. Chem.2008,80, 7755.
(46) Alhalaweh, A.; Velaga, S. P.Cryst. Growth Des.2010,10, 3302.
(47) Jung, M. S.; Kim, J. S.; Kim, M. S.; Alhalaweh, A.; Cho, W.; Hwang, S. J.; Velaga, S. P. J. Pharm. Pharmacol.2010,62, 1560.
(48) Sakellariou, D.; Lesage, A.; Hodgkinson, P.; Emsley, L.Chem. Phys. Lett.2000,319, 253. (49) Elena, B.; Lesage, A.; Steuernagel, S.; Bockmann, A.; Emsley, L. J. Am. Chem. Soc.2005, 127,
17296.
(50) Schmidt, J.; Hoffmann, A.; Spiess, H. W.; Sebastiani, D.J. Phys. Chem. B2006,110, 23204. (51) Uldry, A. C.; Griffin, J. M.; Yates, J. R.; Perez-Torralba, M.; Maria, M. D. S.; Webber, A. L.;
Beaumont, M. L. L.; Samoson, A.; Claramunt, R. M.; Pickard, C. J.; Brown, S. P. J. Am. Chem. Soc.2008,130, 945.
(52) Yates, J. R.; Pham, T. N.; Pickard, C. J.; Mauri, F.; Amado, A. M.; Gil, A. M.; Brown, S. P. J. Am. Chem. Soc.2005,127, 10216.
(53) Ochsenfeld, C.; Brown, S. P.; Schnell, I.; Gauss, J.; Spiess, H. W.J. Am. Chem. Soc. 2001,123, 2597.
(54) Brown, S. P.; Schaller, T.; Seelbach, U. P.; Koziol, F.; Ochsenfeld, C.; Klarner, F. G.; Spiess, H. W.Angew. Chem.-Int. Edit.2001,40, 717.
(55) Ochsenfeld, C.; Koziol, F.; Brown, S. P.; Schaller, T.; Seelbach, U. P.; Klarner, F. G.Solid State Nucl. Magn. Reson.2002,22, 128.
(56) Schaller, T.; Buchele, U. P.; Klarner, F. G.; Blaser, D.; Boese, R.; Brown, S. P.; Spiess, H. W.; Koziol, F.; Kussmann, J.; Ochsenfeld, C.J. Am. Chem. Soc.2007,129, 1293.
(57) Brouwer, D. H.; Alavi, S.; Ripmeester, J. A.Phys. Chem. Chem. Phys.2008,10, 3857. (58) Veshtort, M.; Griffin, R. G.J. Magn. Reson.2006,178, 248.
(59) Elena, B.; de Paepe, G.; Emsley, L.Chem. Phys. Lett.2004,398, 532.
(60) Hohwy, M.; Jakobsen, H. J.; Eden, M.; Levitt, M. H.; Nielsen, N. C. J. Chem. Phys.1998, 108, 2686.
(61) Bradley, J. P.; Tripon, C.; Filip, C.; Brown, S. P.Phys. Chem. Chem. Phys.2009,11, 6941. (62) Elena, B.; Emsley, L.J. Am. Chem. Soc.2005,127, 9140.
For Table of Contents Use Only
Probing Intermolecular Crystal Packing in
-Indomethacin by High-Resolution
1H Solid-State NMR Spectroscopy
Jonathan P. Bradley, Sitaram P. Velaga, Oleg N. Antzutkin, Steven P. Brown
(Table of Contents graphic: 3.5 by 1.375 inches)
(Table of Contents text: less than 60 words)
NMR crystallography is applied to the polymorph of indomethacin. Specifically,
high-resolution 1H double-quantum magic-angle-spinning NMR experiments are combined with first-principles calculations of NMR chemical shifts and eight-spin density-matrix simulations to
quantitatively probe intermolecular hydrogen bonding and CH- interactions and intra- and