*Corresponding author: [email protected]
2017 UTHM Publisher. All right reserved. penerbit.uthm.edu.my/ojs/index.php/jst
Synthesis and Characterization of Nitrogen Doped with Titanium Dioxide
at Different Calcination Temperature by using Sol-Gel Method
Nur ‘Aliaa Razali and Siti Amira Othman*
Department of Physics and Chemistry, Faculty of Applied Sciences and Technology, Universiti Tun Hussein Onn Malaysia, Pagoh Educational Hub, 84600 Pagoh, Johor, Malaysia.
Received 30 September 2017; accepted 30 November 2017; available online 28 December 2017
1. Introduction
Research done proved that azo dyes is one example of dyes which widely used in many industries and one of them is the textile industry due to its vibrant and brilliant colors that turned out the fabrics become attractive. Other than textile industries, dyes also have been applied in cosmetic industries, food industries and pharmaceutical industries [1]. Many side effects were found caused by the textile industry sewage such as the effects towards living things such as the carcinogen content may cause the cell to become mutagenic and can lead to cancer. 40% of all the colorants used contained carcinogen substance, a type of organically bound chlorine. Chemicals that diffused into the air that we breathe or absorbed through the skin, a reaction of allergy may happened and can cause harm to children even when they are not born yet [2]. Excess dye colour that released into environment together with wastewater may contained between 10 and 200 mg/l of dye together with mixture of organic and inorganic substances, additives, acids and alkali compound and salt [3].
The discharged of these types of synthetic dye stuffs gives harm to environment safety. Fabric industries are considered to be the largest contributor of dyes production and lead to the water pollutants due to high utilization of water during the process of dyeing [4]. Other than causing pollution to the environment, some of dyes can lead to mutagenic as they contained high toxicity and carcinogenic characteristics [5]. Few methods have been found to remove dyes from the wastewater including adsorption, oxidation, reduction, precipitation, filtration, electrolysis, photo degradation and also using photocatalytic degradation. Some of these methods succeed in the dye treatment, however high cost is needed especially for the adsorption process on activated carbon. Besides, there are methods that inefficient or have limited condition in removing dyes [6].
There are some research on the method that have been conducted in the removal process of dyes in wastewater including flocculation, chemical coagulation and precipitation in order to achieve the target in the removal of dyes [7]. However, some consequences have been found
Abstract: Dyes have complex chemical structure and cannot be treated easily. Many industries applied dyes in their production, however the wastewater is not properly treated. This can lead to major water pollution if the problem is not overcome. One of the effective method is using photocatalytic degradation as it is environmental friendly and low cost. Sol-gel method used in order to produce the N-doped titanium dioxide photocatalyst with the presence of titanium isopropoxide (TTIP) and all the samples were calcined at different temperature of 300oC, 500oC and 700oC. At calcination temperature of 300oC and 500oC, pure anatase phase were shown and all rutile phase were shown when the samples were calcined at 700oC. This is due to the transformations of anatase phase to rutile and brookite happened at higher temperature. The crystallites size also affected by the calcination temperature which it was found that the size of N-doped TiO2 at 300oC is 7.4686nm, and at 500oC and 700oC showed crystallite size of 12.653nm and 54.7170nm respectively. The bandgap study showed that all samples were shifted from UV light region to visible light region which is normally <3.2 eV for commercial anatase titanium dioxide. The significant of the study is to enhance the sol-gel method to form effective photocatalyst in order to achieve higher degradation rate. The photocatalytic process shown at higher rate when N-doped TiO2 annealed at 300oC.
125
in the application of these physical and chemical treatments and as the consequences, the process can drive to the formation of other pollution due to the highly application of chemicals. This issue have been received many concern from the researcher as if no action taken to overcome the problem, they fear that the pollution would become extreme. A few studies by using photocatalytic have been conducted and the finding showed that photocatalytic may become the alternative and efficient method in degrading the dyes [8]. Besides, photocatalytic also an alternative of a low-cost and non-toxic method by oxidation process using photoactive surface that could terminate organic compounds [9].
Titanium dioxide is one of the popular photocatalyst that highly sensitive to the light, resistance to the corrosion and easy to obtain in the term of industrial material. Despite of all the advantages, there are also blind spots of this photocatalyst in term of application. Some of them are not easy to produce in their best quality and the truth that, in its basic form, only with the presence of the UV light will activate the TiO2 [10]. Next, the industry is having
problem to separate and recover this photocatalyst from the reaction medium due to the fine particle size of TiO2 [11].
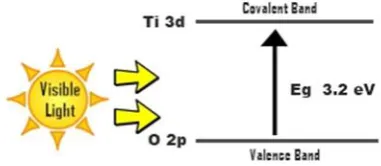
Basically, the band gap of TiO2 can be
altered in order to shift the sensitivity to visible light region from the Ultra-Violet light region. In Fig. 1 and 2 showed the differences of energy level of TiO2, where it can be seen that without
any modification, the band gap is wider which located in UV region and after modification, it is shown that the band gap is narrower. As the band gap becomes narrow, it can be conclude that the band gap already shifted to the visible light region. In this matter, it is very important to identify the effect of parameters that affecting the production of photocatalyst as eventually it will affect the photocatalytic activity.
The good benefit of using dopants is they are effective and efficient. Some of the parameters that could be identify such as the type of metal and non-metal dopant, the dopant concentration, loading of photocatalyst during photocatalytic activity, calcination temperature during the heating treatment, initial concentration of pollutant and others. In this study, the parameters that will be studied are including type of dopant (metal and non-metal
dopant), calcination temperature, and the dopant concentration.
Fig. 1 Energy level before modification of TiO2
Fig. 2 Energy level after modification of TiO2
In photocatalytic process of dye, some parameters that influence the effectiveness of the activity are pH of the dyes, initial concentration of substrates/wastewater, calcination temperature during the preparation of photocatalyst, amount of catalyst and also the method used to prepare the photocatalyst. In the attempt to make sure the dyes removal process at higher efficiency, faster and convenient to conduct, it is necessary to specify the impact of each element that will give impact to the degradation of dyes [7].
Thus, the significance of this study is to improve and synthesis a better and effective photocatalyst through sol gel method in order to achieve higher degradation rate of wastewater treatment especially in the dye industries. Besides, it is very important to find an effective way to ensure the water pollution can be overcome as the growth of dying industries may leads to severe water pollution and eventually will affect the living things.
2. Experimental apparatus and methodology
Photocatalytic Preparation. Nitrogen doped TiO2 were prepared through sol gel method by
126
acetic acid was mixed together and labeled as solution A. Solution B was mixed in another beaker by diluting 15 ml of TTIP with 5 ml of ethanol. Solution B is added drop wise into Solution A for 30 minutes, and then the solution will be stir vigorously within 3 hours in the room temperature. The sol gel left in room temperature for 12 hours as pre-aging process before aging in the oven at temperature of 110oC for 17 hours to remove excess solvents.
The powder obtained grounded finely using mortar pastel and calcinate at 300oC, 500oC and
700oC for 1 hour as heating treatment to
complete the preparation of photocatalyst.
Characterization. All samples were analyzed using Field Emission-Scanning
Electron Microscope (FE-SEM) for
morphology analysis. X-ray diffractometer (XRD) with a scan rate of 8o/s in a range of 2θ
range of 20o-80o for the phase and estimation of
crystal size formed. DR-UV Vis
spectrophotometer for the band gap analysis and also UV-Vis spectrophotometer in order to analyse the photocatalytic degradation of Reactive Black 5.
Photocatalytic Degradation. The photocatalytic degradation was done using Reactive Black 5 in order to test all the samples prepared. 60 ml of 70 ppm of RB 5 were prepared and 0.1g of photocatalyst added to the RB 5 solution and the solution were stirred vigorously in the dark for 1 hour to ensure reach the adsorption equilibrium. The photocatalytic degradation was run under visible light irradiation for 2 hours by using 2 Philips fluorescent lamps each contain 18 watt. Along the irradiation process, the solution were continuously stirred using magnetic stirrer. The aliquots of the reaction mixture were taken at every 15 minutes regularly in order to monitor the reaction progress. All the aliquots centrifuged for 10 minutes at 4000 rpm and then analyzed using UV-vis spectrophotometer.
3. Result and Discussions
Photocatalyst Characterization
XRD. The phase composite and estimation of crystallite size for all samples were analysed and evaluated using X-ray diffraction analysis.
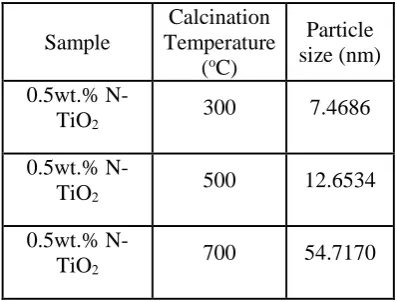
Average crystallite size of all samples (0.5wt. % N-TiO2) at calcination temperature of
300oC, 500oC and 700oC were calculated based
on Scherer’s (refer with Eq. 1).
𝐷 = 𝐾λ/βcosθ (1)
Where, K=0.9 is the Scherer constant, λ=154060 nm the X-ray wavelength, β, the peak width of half maximum, and θ is the Bragg diffraction angle.
As seen in Table 1, the particle size is increasing as the calcination temperature increasing. At 300oC the particle size
estimation is 7.4686nm, 12.6534nm was estimated at 500oC and 54.7170nm at 700oC
respectively.
Table 1 The estimation of particle size of samples at different calcination temperature.
Sample
Calcination Temperature
(oC)
Particle size (nm)
0.5wt.%
N-TiO2 300 7.4686
0.5wt.%
N-TiO2 500 12.6534
0.5wt.%
N-TiO2 700 54.7170
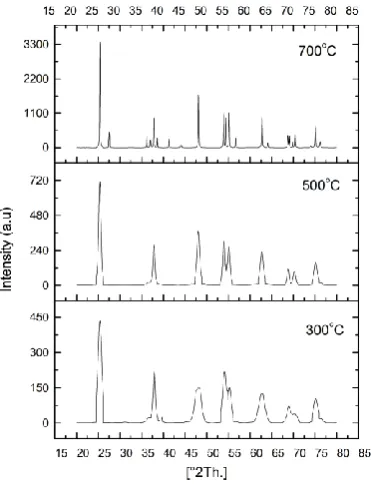
The different phase of photocatalyst can be seen on the XRD data of photocatalyst sample (refer Fig. 3) where each of them were calcined at temperature of 300oC, 500oC and 700oC
respectively. Absent diffraction peak corresponding to the N was detected. The reason could be due to the fact that the content of N might be too small to detect. All the samples at 700oC showed mostly sharp
diffraction peaks demonstrate that these samples have high crystallinity compare to samples at 300oC. From the graph, it can be
seen at calcination temperature of 300oC and
500OC, anatase phase were observed and at
700OC rutile phase can be observed from the
graph. At 300oC, the anatase phase can be seen
and at 500oC, defined peaks of anatase can be
127 Fig. 3 Comparison XRD analysis of sample
0.5wt. % N-TiO2, prepared at varying
temperatures from 300oC to 700oC
As the higher of calcination temperature were applied, the rutile peaks already formed at 500oC, where the peaks can be observed at
27.58, 36.22, 41.38, 54.46, 64.16, and 69.92o. A
research conducted by Nolan et al. [12] showed a result of XRD analysis of anatase phase starts to transform to rutile phase at a higher temperature of 600oC and above. Another
finding by Sikirman et al. [13] also found that the width of the anatase peaks became narrower as the calcination temperature increases which indicates the increasing of size particles. This statement can be related to the outcome of this study where, from the XRD graph also, at lower temperature, broad peaks can be seen at 48, 54, 55.2, 62.72, 68.8, 70.26 and 75.14°. As the calcination temperature getting higher, the peaks become narrower. The reason of the narrower peak might be due to the higher calcination temperature and also the bond between the existing elements becomes stronger. It also can be seen that the peak at 38o
started to disappear and minor lines started to form at peak 36.22o indicating that the anatase
phase started to shift to rutile phase. This showed that the transformations of anatase to rutile phase affected by the higher calcination temperature.
FESEM. All the samples (refer Fig. 4) that undergo the sol-gel process were analysed by using FESEM in order to identify the shape of the samples. From the analysis result, all samples (at different calcination temperature) were observed that the particles were not uniform in size and shape. The difference that can be observed from all the result is that as the calcination temperature increasing, the particles of the samples were found bigger and this might be due to the higher calcination temperature during the synthesis process.Sifontes et al. [14] have done a research on the effect of calcination temperature on the structural properties of nanocatalyst and found that at different calcination temperatures of 350oC, 650oC and
950oC, the particles grow bigger as the
temperature increasing.
At calcination temperature of 300oC, the
FESEM analysis showed some sphere shapes of the grain, and as the calcination temperature was increased to 500oC, the particle of the
sample become slightly bigger, congregated together more densely and closer to each other and this event may explained the effect of heat treatment applied on the sample indicate stronger bonds form between particles. At 700oC, the sample particles become slightly
smaller as it may be appeared to be the optimum temperature. However the particles also close to each other and showed slightly sphere shape at temperature at 700oC.
Research conducted by Muneer et al. [15], showed that the FESEM analysis of TiO2 and
claimed that as the calcination increasing, the
particles size grow bigger and the
agglomeration of particles become significant. At 600oC, the bigger size of particles compared
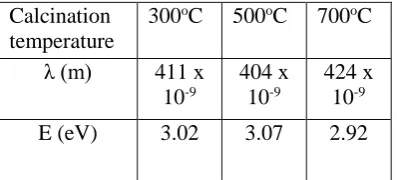
to lower temperature of 400oC and 500oC. DR-UV Vis. The samples were analysed using DR-UV Vis for the band gap study. In order to find the band gap, the band gap energy formula is applied as Eq. 2,
Band gap energy (E) = h (C/λ) (2)
From the data (refer Table 2), it can be observed that band gap of the samples doped with TiO2 have been shifted lower that the pure
TiO2 which is 3.2eV. Basically, TiO2 can only
be activated by using UV light (λ <380 nm) due to their wide band gap. However, by using doping technique, the TiO2 can be activated by
128 Fig. 4 FE-SEM image of 0.5% N-TiO2
powders calcined at: (1) 300 oC (2) 500 oC (3)
700 oC
Table 2 Wavelength and band gap of samples at calcination temperature of 300oC, 500oC and
700oC.
h = Plank constant =6.626 × 10⁻³⁴ Joules sec
C = Speed of light = 3.0 × 10⁸ meter/sec
λ = Cut off wavelength (m)
Where 1eV = 1.6 × 10⁻¹⁹ Joules (conversion factor)
Photodegradation of Reactive Black 5. The effectivity of photocatalyst was analysed by measuring the photodegradation of RB5 in aqueous solution under visible light. From the analysis, it was found that the highest
photodegradation occurred when the
calcination temperature at 300oC which is
85.87%. The photocatalytic degradation also found to be decrease as the calcination temperature increase which agreed with the statement claimed by Kumar et al. [16], as the calcination temperature increasing, the photodegradation rate will increasing. Based on the finding of the study, it is found that higher photodegradation rate achieved when the photocatalyst produced at 400oC compare to
600oC. There were few factors that may affect
the degradation activity such as the phase
structure of photocatalyst, size of particle and also the area surface of photocatalyst.
As stated before, highest photodegradation is 85.87%, this is due to the anatase phase structure present in the photocatalyst, large surface area and also the reduced bandgap that occur on the photocatalyst. As the bandgap is smaller, the photodegradation become more efficient. The large surface area also helps in the photodegradation as smaller particles ensure larger surface area. At calcination temperature of 700oC, the photodegradation
become ineffective due to the presence of rutile phase. A research done by Sikirman et al. [13], showed that higher photodegradation rate of 69.7% when the photocatalyst prepared at 600oC compared to 450oC and 750oC. From the
research also found that the crystallite size increased as the calcination temperature increased.
Fig. 5 Graph of absorbance of RB5 against wavelength during the photodegradation activity
4. Conclusion
The preparation of photocatalyst N-TiO2 at different calcination temperature by using sol-gel method and TTIP as the precursors was successfully done. Calcination temperature was found to have the important affect towards the morphology and the phase structure of the photocatalyst. It was found that as the temperature increases, the surface may decrease, however, the rutile phase appeared at the higher calcination temperature.
Besides, it was also found that the doping technique may shifted the bandgap from UV region to the visible light region which will cause the efficiency of photocatalyst to be activated using visible light is increasing. The results from the experiment showed that the highest photodegradation occur as the Calcination
temperature
300oC 500oC 700oC
λ (m) 411 x
10-9
404 x 10-9
424 x 10-9
129
calcination temperature at 300oC which is at
85.7%, in 2 hours irradiation under visible light with the presence of anatase phase and fine structure morphology of photocatalyst.
Acknowledgements
The authors would like to thank Universiti Tun Hussein Onn Malaysia for facilities provided that makes the research possible.
References
[1] Panja, J., Raybarman, U., Sarkar, S. & Bhattacharjee, S. (2016). “Removal of Reactive Black 5 Dye from Aqueous Solution using Photo Catalysis” in International Journal for Innovative Research in Science & Technology, pp. 284-289.
[2] Khan, M., Gul, S. R., Li, J., Cao, W. & Mamalis, A. G. (2015). “Preparation, characterization and visible light photocatalytic activity of silver, nitrogen co-doped TiO2 photocatalyst” in Materials
Research Express, Vol. 2, pp.1-6.
[3] Chengalroyen, M. D., & Dabbs, E. R. (2012). “The Microbial Degradation of Azo Dyes : Minireview” in World J Microbiol Biotechnol, pp. 389-399. [4] Saratale, R. G., Saratale, G. D., Chang, J.
S., & Govindar, S. P. (2011). “Bacterial Decolorization and Degradation of Azo Dyes” in Journal of the Taiwan Institute of Chemical Engineers, pp. 138-157.
[5] Jadhav, J. P., Parshetti, G. K., Kalme, S. D., & Govindwar, S. P. (2006). “Decolorization of azo dye methyl red by Saccharomyces cerevisiae MTCC 463” in Chemosphere (Elsevier), pp. 394-400. [6] Ali, H. (2010). “Biodegradation of
Synthetic Dyes- A Review” in Water Air Soil Pollution, pp. 251-273.
[7] Akpan, U. G. & Hameed, B. H. (2009). “The Advancements in sol-gel Method of Doped TiO2 in Photocatalyts” in Applied
Catalysis A: General 375, pp. 1-11. [8] Harikumar, PS., Joseph, L., & Dhanya, A.
(2013). “Photocatalytic Degradation of
Textile Dyes by Hydrogel Supported Titanium dioxide Nanoparticles” in Journal of Environmental engineering & Ecological Science, pp. 1-9.
[9] Tezza, V.B., Scarpato, M., Oliveira, L. F., & Bernardin, A. M. (2014). “Effect of firing temperature on the photocatalytic activity of anatase ceramic glazes” in Powder Technology, pp. 60-65.
[10]Tan, Y. N, Wong, C. L & Mohamed, A. R.
(2011). “An Overview on the
Photocatalytic Activity of Nano- Doped- TiO2 in the Degradation of Organic
Pollutants” in International Scholarly Reasearch Network, Vol. 2011 pp. 1-18. [11]You Ji, L., MingYuan, M., Yu Zhu, O. &
Wenbin, Y. (2009). “Preparation of TiO2/activated carbon with Fe ions doping
photocatalyst and its application to photocatalytic degradation of reactive brilliant red K2G” in Science in China Series B: Chemistry, Vol. 52. No. 8 pp. 1113-1119.
[12]Nolan, N. T., Synott, D. W., Seery, M. K., Hinder, S.J., Wassenhovwn, A. V. & Pillai, S. C. (2011). “Effect of N-doping on the photocatalytic activity of sol–gel TiO2”
in Journal Hazard. Materials, Vol 211-212. pp. 88-94.
[13]Sikirman, A., & Krishnan, J. (2014). “Effect of Calcination Temperature on Synthesis of N-Fe-TiO2 for Photocatalytic Degradation of Methylene Blue under Visible Light” in Applied Mechanics and Materials, Vol. 575. pp. 55-59.
[14]Sifontes, A. B., Rosales, M., Mendez, F. J., Ovledo, O. & Zoltan, T. (2013). “Effect of Calcination Temperature on Structural Properties and Photocatalytc Activity of
Ceria Nanoparticles Synthesized
Employing Chitosan as Template” in Hindawi Publishing Corporation, Journal of Nanomaterials, pp. 1-9.
[15]Muneer, M. B., Kadhum, A. A. H., Mohamad, A. B., Takriff, M. S. & Sopian, K. (2012). “Synthesis and Catalytic Activity of TiO2 Nanoparticles for
130
Chlorophenols under Direct Solar
Radiation” in International Journal of electrochemical science, pp. 4871-4888. [16]Kumar, M., Gupta, A. K., & Kumar, D.
(2016). “Annealing temperature Effects on Structural and Hydrophilic Properties of Magnesium-Doped TiO2 Thin Films” in