A. Banu1, M. A. Bakar2, M. Y. Ali1 and Y. T. A. Erry1
1Department of Manufacturing and Materials Engineering, International Islamic University Malaysia, PO Box 10, 50728 Kuala Lumpur, Malaysia
2Department of Mechanical Engineering, Politeknik Sultan Haji Ahmad Shah
Analysis of WEDM Process Parameters on Surface Roughness and Kerf using
Taguchi Method
Asfana Banu, Mazilah Abu Bakar, Mohammad Yeakub Ali and Erry Y. T. Adesta
Received: 12 October 2017
Accepted: 13 November 2017
Published: 10 December 2017
Publisher: Deer Hill Publications
© 2017 The Author(s)
Creative Commons: CC BY 4.0
ABSTRACT
In obtaining the best quality of engineering parts, the quality of machined surface plays an essential role. The fatigue strength, wear resistance, and corrosion of workpiece are some of the aspects of the qualities that can be improved. This paper investigates the effect of wire electrical discharge machining (WEDM) process parameters on surface roughness and kerf on stainless steel using distilled water as dielectric fluid and brass wire as tool electrode. The selected process parameters are voltage open, wire speed, wire tension, voltage gap, and off time. Empirical models using Taguchi method were developed for the estimation of surface roughness and kerf. The analysis revealed that off time has major influence on surface roughness and kerf. The optimum machining parameters for minimum surface roughness and kerf were found to be 10 V open voltage, 2.84 µs off time, 12 m/min wire speed, 6.3 N wire tension, and 54.91 V voltage gap.
Keywords: WEDM, Surface roughness, Kerf, Process parameters, Taguchi method, ANOVA, S/N ratio
1 INTRODUCTION
Wire electrical discharge machining (WEDM) is a specialized thermal machining process used to machine complex shape components with high accuracy using a thin single-strand metal wire (0.1 or 0.25mm diameter) as an electrode. It is a technique used in industry for high-precision machining of all types of conductive materials such as metals, metallic alloys, graphite [1-3]. It is also known as an electro-erosion machining process. When the gap voltage is sufficiently large (i.e reaches the breakdown voltage of dielectric fluid), high power spark is produced, where the temperature increases up to 10,000 °C and allows the material to be removed from the machining area [3-4]. WEDM is particularly valuable for applications involving manufacture of stamping dies, extrusion dies, aerospace parts such as micro gas turbine blades, and electronic components [5-6]. Without WEDM, the fabrication of precision workpiece requires many hours of manual grinding and polishing [5].
In WEDM, the performance measures are the indicators used to observe the quality of the finished parts, whereas, the process parameters are the variables that influence the machining process. The most significant performance measures in WEDM are surface finish, material removal rate, and kerf. All of these performance measures are usually affected by the process parameters such as pulse on-time, open voltage, servo voltage, wire feed, dielectric pressure, and wire tension. These parameters have the ability to produce better quality machined surface with less cracks and surface damages [7]. Surface roughness is used to control the quality of the finished part while kerf is used to determine the accuracy of dimension. According to previous studies, the surface roughness improves when the pulse duration and the discharge current decreases [8].
[5]. Hence, the objective of this paper is to investigate the effect of WEDM process parameters on surface roughness and kerf of stainless steel using distilled water as the dielectric fluid and brass wire as the tool electrode.
2 METHODOLOGY
The experimental investigation was performed using the Mitsubishi FX10K CNC Wire EDM. The workpiece material, which was stainless steel S304, was prepared in desired dimension of 150 mm × 8 mm ×10 mm with flat surface finish. Stainless steel is commonly used almost in all industrial applications and it accounts for approximately 50% of the world’s steel production and consumption. This is because of its aesthetic view in architectures, resistance against corrosion and chemicals, high hardenability, and well mechanical property. As a result, it has become the most preferred material [8, 12]. Brass wire with 0.2 mm diameter was used as the tool electrode whereas distilled water as the dielectric fluid. The experimental parameters are listed in Table 1.
The parameters were selected based on the type of machining material, tool material, height of the workpiece, and the capability of the machine. The controlled parameters were voltage open, wire speed, wire tension, voltage gap, and off time. Mitutoyo Surftest (SV-514) was used to measure the surface roughness (Ra). The tester used a cut-off length of 2 mm and evaluation length of 0.8 mm with a Surfpak V4.10 (2) software having a resolution of 0.01
μm and stylus speed of 0.10 mm/sec. Measurements of Ra were repeated three times and the average of Ra were calculated. On the other hand, scanning electron microscope, SEM (Jeol JSM-5600) was used to measure the kerf of the workpiece. The measurements of kerf were taken at three different places and the average of the kerf was calculated.
The experiments were based on the Taguchi’s L16 orthogonal array design. The experimental results in Table 2 are analysed using signal-to-noise (S/N) ratio and analysis of variance (ANOVA) approach. The S/N ratio is used as a measurable value instead of standard deviation. This is because of the fact that as the mean decreases, the standard deviation also will decrease and vice versa. The S/N ratio depends on the type of characteristic, where the higher value that represents a better machining performance such as MRR is known as higher is better. On the other hands, the characteristic that have lower value that represents a better machining performance, such as surface roughness and kerf is called lower is better as shown in Eqn. 1 [13-14].
𝑆𝑆
𝑁𝑁= −10log ( 1
𝑛𝑛∑𝑛𝑛𝑖𝑖=1𝑦𝑦𝑖𝑖2) (1)
Where, 𝑛𝑛 is the number of iteration and 𝑦𝑦 is the experimental result.
3 RESULTS AND DISCUSSION
3.1 Surface Roughness, Ra
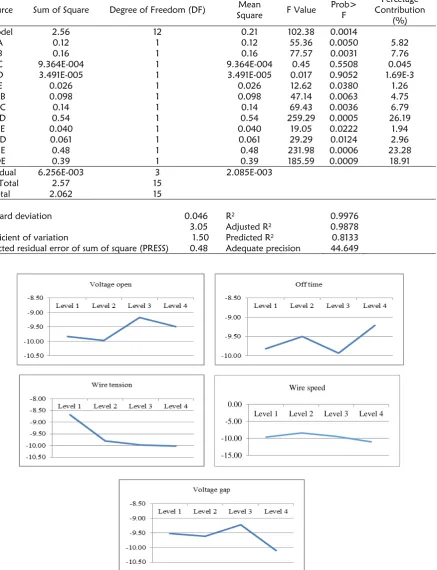
Signal-to-Noise (S/N) ratio. The S/N ratio according to Taguchi method is the ratio of signal to noise where signal represents the desirable value and noise represents the undesirable value. The S/N ratio for the experiments conducted is shown in Table 2 meanwhile the mean of S/N ratio for Ra is presented for four levels are tabulated in Table 3. Figure 1 shows the effects of process parameters on mean S/N ratio for Ra. According to Taguchi method, minimizing average Ra would be better for precision manufacturing. Hence, “smaller-the better” type problems would give a smaller values for average Ra in order to get a better quality of finish parts [15]. Based on Table 3 and Figure 1, it was found that S/N ratio for Ra decreases when the wire speed, wire tension, and voltage gap are at level 4. The wire vibration tends to reduce when the wire tension increases which helps the surface roughness to improve [16]. However, the S/N ratio for Ra increases when the off time is at level 4 and level 3 for voltage open. Voltage open should be kept as low as possible in order to get a better surface roughness. It is to avoid powerful explosion to occur which can cause deep crater on the machined surface and resulting to poor surface quality at the machined area [16].
where the ratio greater than 4 is desirable. The ratio of 44.649 indicates that the signal is adequate. This model can be used to navigate the design space.
𝑅𝑅𝑎𝑎= 3.755 + 0.831𝐴𝐴 − 1.063𝐵𝐵 + 1.949𝐶𝐶 − 2.314𝐷𝐷 − 0.199𝐸𝐸 − 0.096𝐴𝐴𝐵𝐵 − 0.058𝐴𝐴𝐶𝐶 + 0.206𝐵𝐵𝐷𝐷 +
0.011𝐵𝐵𝐸𝐸 − 0.035𝐶𝐶𝐷𝐷 − 0.019𝐶𝐶𝐸𝐸 + 0.044𝐷𝐷𝐸𝐸 (2)
Where, Ra = surface roughness (µm), A = voltage open (V), B = off time (µs), C = wire speed (m/min), D = wire tension (N), and E = voltage gap (V).
Table 1: Experimental parameters of WEDM
Control Parameters Level
Factors I II III IV
Voltage open (V) A 10 12 14 16
Off time (µs) B 1 2 3 4
Wire speed (m/min) C 6 8 10 12
Wire tension (N) D 6 7 8 9
Voltage gap (V) E 40 45 50 55
Fixed Parameters:
Workpiece material Stainless steel S304
Tool electrode Brass wire (Ø 0.2 mm)
Dielectric fluid Distilled water
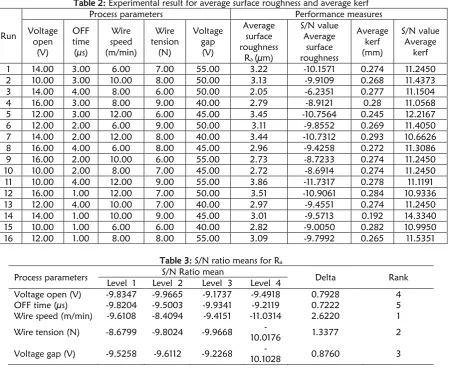
Table 2: Experimental result for average surface roughness and average kerf
Run
Process parameters Performance measures
Voltage open
(V)
OFF time (µs)
Wire speed (m/min)
Wire tension
(N)
Voltage gap
(V)
Average surface roughness
Ra (µm)
S/N value Average
surface roughness
Average kerf (mm)
S/N value Average
kerf
1 14.00 3.00 6.00 7.00 55.00 3.22 -10.1571 0.274 11.2450
2 10.00 3.00 10.00 8.00 50.00 3.13 -9.9109 0.268 11.4373
3 14.00 4.00 8.00 6.00 50.00 2.05 -6.2351 0.277 11.1504
4 16.00 3.00 8.00 9.00 40.00 2.79 -8.9121 0.28 11.0568
5 12.00 3.00 12.00 6.00 45.00 3.45 -10.7564 0.245 12.2167
6 12.00 2.00 6.00 9.00 50.00 3.11 -9.8552 0.269 11.4050
7 14.00 2.00 12.00 8.00 40.00 3.44 -10.7312 0.293 10.6626
8 16.00 4.00 6.00 8.00 45.00 2.96 -9.4258 0.272 11.3086
9 16.00 2.00 10.00 6.00 55.00 2.73 -8.7233 0.274 11.2450
10 10.00 2.00 8.00 7.00 45.00 2.72 -8.6914 0.274 11.2450
11 10.00 4.00 12.00 9.00 55.00 3.86 -11.7317 0.278 11.1191
12 16.00 1.00 12.00 7.00 50.00 3.51 -10.9061 0.284 10.9336
13 12.00 4.00 10.00 7.00 40.00 2.97 -9.4551 0.274 11.2450
14 14.00 1.00 10.00 9.00 45.00 3.01 -9.5713 0.192 14.3340
15 10.00 1.00 6.00 6.00 40.00 2.82 -9.0050 0.282 10.9950
16 12.00 1.00 8.00 8.00 55.00 3.09 -9.7992 0.265 11.5351
Table 3: S/N ratio means for Ra
Process parameters Level 1 Level 2 S/N Ratio mean Level 3 Level 4 Delta Rank
Voltage open (V) -9.8347 -9.9665 -9.1737 -9.4918 0.7928 4
OFF time (µs) -9.8204 -9.5003 -9.9341 -9.2119 0.7222 5
Wire speed (m/min) -9.6108 -8.4094 -9.4151 -11.0314 2.6220 1
Wire tension (N) -8.6799 -9.8024 -9.9668 10.0176 - 1.3377 2
Table 4: ANOVA for average Ra
Source Sum of Square Degree of Freedom (DF) Square Mean F Value Prob>F
Percetage Contribution
(%)
Model 2.56 12 0.21 102.38 0.0014
A 0.12 1 0.12 55.36 0.0050 5.82
B 0.16 1 0.16 77.57 0.0031 7.76
C 9.364E-004 1 9.364E-004 0.45 0.5508 0.045
D 3.491E-005 1 3.491E-005 0.017 0.9052 1.69E-3
E 0.026 1 0.026 12.62 0.0380 1.26
AB 0.098 1 0.098 47.14 0.0063 4.75
AC 0.14 1 0.14 69.43 0.0036 6.79
BD 0.54 1 0.54 259.29 0.0005 26.19
BE 0.040 1 0.040 19.05 0.0222 1.94
CD 0.061 1 0.061 29.29 0.0124 2.96
CE 0.48 1 0.48 231.98 0.0006 23.28
DE 0.39 1 0.39 185.59 0.0009 18.91
Residual 6.256E-003 3 2.085E-003
Cor Total 2.57 15
Total 2.062 15
Standard deviation 0.046 R2 0.9976
Mean 3.05 Adjusted R2 0.9878
Coefficient of variation 1.50 Predicted R2 0.8133 Predicted residual error of sum of square (PRESS) 0.48 Adequate precision 44.649
Figure 1: Effects of process parameters on mean S/N ratio for Ra -15.00
-10.00 -5.00 0.00
Level 1 Level 2 Level 3 Level 4
3.2 Kerf
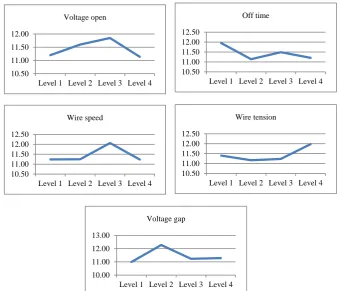
Signal-to-Noise (S/N) ratio. The equation used to calculate the average kerf is the same used for the average Ra in order to attain better accuracy for the finish parts. Figure 2 shows the effects of process parameters on mean S/N ration for kerf while Table 5 shows the S/N ratio means for kerf. Based on Table 5 and Figure 2, it shows that S/N ratio for kerf decreases when the level of voltage open and wire speed are at level 4 while wire tension is at level 2. However, according to previous research studies, it is inferred that kerf decreases when the wire tension increases. This is because wire vibration is expected to reduce with the increase of wire tension which will lead to reduction of kerf (16). Conversely, the S/N ratio for kerf increases when the levels of off time and voltage gap are at level 1 and level 2 respectively.
Analysis of variance (ANOVA). An empirical model as expressed in Eqn. 3 is developed by ANOVA. Based on Table 6, the model F-value of 68.71 implies the model is significant. There is only a 0.25% chance of noise that could occur in the model F-value. Values of prob > F less than 0.0500 indicate model terms are significant. In this case B (off time), C (wire speed), D (wire tension), E (voltage gap), AB (voltage open and off time), AC (voltage open and wire speed), AD (voltage open and wire tension), BD (off time and wire tension), BE (off time and voltage gap), CE (wire speed and voltage gap) are significant model terms. Values greater than 0.1000 indicate the model terms are not significant. If there are many insignificant model terms (not counting those required to support hierarchy), then the model reduction may improve the model. Factor A (voltage open) is the most uninfluenced factor and factor B (off time) is the most influenced factor. However, when factor A (voltage open) interact with factor B (off time), then it is significant. It is the same concept for AC (voltage open and wire speed) and AD (voltage open and wire tension). Thus, it means that factor A (voltage open) cannot be removed as it is significant when there is an interaction with B (off time), C (wire speed), and D (wire tension) even though it is not significant if it is stand-alone. The Predicted R2 and PRESS are not defined. Adequate precision measures the S/N ratio, where the ratio greater than 4 is desirable. The ratio of 36.342 indicates that the signal is adequate. This model can be used to navigate the design space.
𝐾𝐾𝐾𝐾𝐾𝐾𝐾𝐾 = 1.596 − 0.151𝐴𝐴 − 0.193𝐵𝐵 − 0.089𝐶𝐶 − 0.089𝐷𝐷 + 0.015𝐸𝐸 + 0.012𝐴𝐴𝐵𝐵 + 0.010𝐴𝐴𝐶𝐶 +
4.125 × 10⁻³𝐴𝐴𝐷𝐷 + 0.016𝐵𝐵𝐷𝐷 − 7.547 × 10⁻⁴𝐵𝐵𝐸𝐸 + 1.238 × 10⁻³𝐶𝐶𝐷𝐷 − 8.481 × 10⁻⁴𝐶𝐶𝐸𝐸 (3)
Where, Kerf = kerf (mm), A = voltage open (V), B = off time (µs), C = wire speed (m/min), D = wire tension (N), and E = voltage gap (V).
Figure 2: Effects of process parameters on mean S/N ratio for kerf 10.00
11.00 12.00 13.00
Level 1 Level 2 Level 3 Level 4 Voltage gap
10.50 11.00 11.50 12.00
Level 1 Level 2 Level 3 Level 4 Voltage open
10.50 11.00 11.50 12.00 12.50
Level 1 Level 2 Level 3 Level 4 Off time
10.50 11.00 11.50 12.00 12.50
Level 1 Level 2 Level 3 Level 4 Wire speed
10.50 11.00 11.50 12.00 12.50
Table 5: S/N ratio means for kerf
Process parameters S/N Ratio mean Delta Rank
Level 1 Level 2 Level 3 Level 4
Voltage Open (Vo) 11.1991 11.6004 11.8480 11.1360 0.7120 5
OFF time (µs) 11.9494 11.1394 11.4890 11.2058 0.8100 4
Wire speed (m/min) 11.2384 11.2468 12.0653 11.2330 0.8323 2
Wire tension (g) 11.4018 11.1671 11.2359 11.9787 0.8116 3
Voltage gap (V) 10.9899 12.2761 11.2316 11.2860 1.2862 1
Table 6: ANOVA for average kerf
Source Sum of Square Degree of Freedom (DF) Mean Square F Value Prob>F
Percentage Contribution
(%)
Model 7.838E-003 12 6.532E-004 68.71 0.0025
A 2.288E-005 1 2.288E-005 2.41 0.2186 0.16
B 2.700E-003 1 2.700E-003 284.05 0.0005 18.37
C 1.031E-003 1 1.031E-003 108.43 0.0019 7.01
D 1.232E-003 1 1.232E-003 129.62 0.0015 8.38
E 9.236E-004 1 9.236E-004 97.16 0.0022 6.28
AB 1.399E-003 1 1.399E-003 147.15 0.0012 9.52
AC 2.641E-003 1 2.641E-003 277.79 0.0005 17.97
AD 1.742E-004 1 1.742E-004 18.33 0.0234 1.19
BD 3.356E-003 1 3.356E-003 353.01 0.0003 22.83
BE 1.817E-004 1 1.817E-004 19.12 0.0221 1.24
CD 7.827E-005 1 7.827E-005 8.23 0.0641 0.53
CE 9.407E-004 1 9.407E-004 98.96 0.0022 6.39
Residual 2.852E-005 3 9.506E-006
Cor Total 7.866E-003 15
Total 0.0147 15
Standard deviation 3.083E-003 R2 0.9964
Mean 0.27 Adjusted R2 0.9819
Coefficient of variation 1.15 Predicted R2 N/A
Predicted residual error of sum of square (PRESS) N/A Adequate precision 36.342
4 MULTIPLE OPTIMIZATIONS
The ANOVA-based optimization was done in order to get the optimum values of the process parameters for minimum Ra and kerf. Minimum Ra (2.56 µm) and kerf (0.212 mm) can be achieved at 10 V voltage open, 2.84 µs off time, 12 m/min wire speed, 6.3 N wire tension, and 54.91 V voltage gap. Experiments were conducted to validate the results obtained from the optimization. Based on the experiment, the actual Ra (2.76 µm) and kerf (0.23 mm) were higher compared to the optimize Ra and kerf with maximum error of 7.81% and 8.49% respectively. The percentage error for minimum Ra and kerf are relatively small which shows the empirical equations are valid.
5 CONCLUSIONS
In this paper, process parameters of WEDM on surface roughness and kerf were analysed using stainless steel (S304) as the workpiece, brass wire as the tool electrode, and distilled water as the dielectric fluid. All of the process parameters that have been used for the investigation were found to have influence on the surface roughness and kerf. The following conclusions are drawn from the experimental study:
1. From S/N ratio, it can be inferred that wire speed, wire tension, and voltage gap should be at the highest level, which is level 4 while voltage open and off time should be at level 3 and 4 respectively to obtain low surface roughness. As for the kerf, it can be concluded that to get minimum kerf, voltage open and wire speed should be at level 4 while off time, wire tension, and voltage gap should be at level 2, level 2, and level 1 respectively.
REFERENCES
1. Singh, H., & Garg, R. (2009). Effects of process parameters on material removal rate in WEDM. Journal of Achievements in Materials and Manufacturing Engineering, 32(1), 70-74.
2. Ali, M. Y., Khamarruzaman, S. N. Z., & Banu, A. (2017). Investigation of kerf in micro wire electro discharge machining. In IOP Conference Series: Materials Science and Engineering, 184(1), 012033.
3. Ali, M. Y., Karim, A. M., Adesta, E. Y. T., Ismail, A. F., Abdullah, A., & Idris, M. N. (2010). Comparative study of conventional and micro WEDM based on machining of meso/micro sized spur gear. International Journal of Precision Engineering and Manufacturing, 11(5), 779-784.
4. Durairaj, M., Sudharsun, D., & Swamynathan, N. (2013). Analysis of process parameters in wire EDM with stainless steel using single objective taguchi method and multi objective grey relational grade. Procedia Engineering, 64, 868-877.
5. Nihat, T., Can, C., & Gul, T. (2004). A study on kerf and material removal rate in wire electrical discahrge machining based on Taguchi method. Journal of Materials Processing Technology, 152(3), 316-322.
6. Kumar, K. & Ravikumar, R. (2013). Modeling and optimization of wire EDM process. International Journal of Modern Engineering Research, 3(3), 1645-1648.
7. Ramli, R., Ahmad, R., & Ghani, J. A. (2012). Kerf width optimization in wire-cut electrical discharge machine by using Taguchi method. Journal Teknologi (Sciences and Engineering), 59(SUPPL. 2), 209-213.
8. Liao, Y. S., Huang, J. T., & Chen, Y. H. (2004). A study to achieve a fine surface finish in Wire-EDM. Journal of Materials Processing Technology, 149(1), 165-171.
9. Hoang, K. T. & Yang, S. H. (2015). Kerf analysis and control in dry micro-wire electrical discharge machining. International Journal of Advanced Manufacturing Technology, 78, 1803-1812.
10.Ghodsiyeh, D., Golshan, A., & Shirvanehdeh, J. A. (2013). Review on current research trends in wire electrical discharge machining (WEDM). Indian Journal of Science and Technology, 6(2), 4128-4140.
11. Di, S., Chu, X., Wei, D., Wang, Z., Chi, G., & Liu, Y. (2009). Analysis on kerf width in micro-WEDM. International Journal of Machine Tools & Manufacture, 49(10), 788-792.
12.Akkurt, A. (2009). Surface properties of the cut face obtained by different cutting methods from AISI 304 stainless steel materials. Indian Journak of Engineering & Materials Sciences, 16, 373-384.
13.Taguchi, G. (1993). Taguchi on robust technology development, bringing quality engineering upstream. New York: ASME Press.
14.Jugulum, R. & Samuel, P. (2010). Design for lean six sigma: A holistic approach to design and innovation. John Wiley & Sons.
15.Ali, M. Y., Mohamed, A. R., Khan, A. A., Asfana, B., Lutfi, M., & Fahmi, M. I. (2013). Empirical modelling of vibration in micro end milling of PMMA. World Applied Sciences Journal (Mathematical Applications in Engineering), 21, 73-78.