An Analysis for the Detection of Network Communities
in Dynamic Environments
K. Sendil Kumar
Assistant Professor
Department of Information Technology, SMVEC
K. S. Suganthi, C. Suchitra, S. Sharmili
Department of Information Technology, SMVEC
ABSTRACT
Community Detection basically refers to the discovery of the naturally occurring associations between vertices in a given network. Initial algorithms involved detecting communities in static networks. This slowly evolved into detecting communities in dynamic environments as the nature of the network itself, in general, is dynamic. This paper on community detection is based on the analysis of existing algorithms present for the detection in dynamic environments and we have proposed an idea involving the combination of two techniques: local community measurement of multi resolution applied in multi – objective immune algorithm.
General Terms
Communities, Detection, Modularity
Keywords
Community detection, dynamic environment, Similarity factor
1.
INTRODUCTION
Community Detection is sometimes also referred to as clustering, but this term is largely avoided to prevent confusion. Both Graph Partitioning and community detection refer to the division of vertices in a network into groups or clusters or communities. Such groups are tightly knit with many edges inside groups and only a few edges between the groups. The ability to discover groups or cluster within a network proves to be a useful tool for revealing the network’s structure and organization at a larger scale than of a single vector. Clusters can also be defined as the group of vertices having association between the vertices based on certain identified similarity. The association between the networks can be stated with the example as in Figure 1. In the figure, it represents the university structured as a network. IN this network, each node represents a teacher. The communities represent the association of the teachers in the university based upon the similarity that one teacher has published a paper in a journal with another teacher from the same community. But being in a community does not restrain a teacher from publishing a paper in a journal with a teacher from another community. This is because of the basic concept that, the edges or links or connectivity within vertices in a community is far denser than vertices outside the community. The edges or links represent the relations present between the vertices in a community.
The basic formation or the initial representation of communities was hierarchical clustering. The defect with hierarchical clustering was that they had overlapping communities in their clusters. This is a disadvantage because,
Fig 1: Community structure for a university
the idea of community detection was developed so as to provide better understanding of the network structure and organization when viewed by a network administrator for its activities. But this is possible only if the communities are non – overlapping. Non – overlapping communities refer to those communities in which the vertices of one community are present solely in that community. In hierarchical clustering the vertices are clustered together but they do not form a coherent network upon completion. As hierarchical clustering has overlapping communities, it is not efficient as its latter developments of graph partitioning and community detection. Hence the methods of graph partitioning and community detection of networks came into existence.
2.
GRAPH PARTITIONING
partitioning and community detection algorithms. These two are differentiated from one another by examining the number and size by which the network has to be grouped is specified or unspecified. Graph partitioning is a classic problem of dividing the vertices of a network into non – overlapping groups of given sizes so that number of edges between groups is minimized. The main disadvantage in graph partitioning is that we have to specify the number of nodes that a community can accumulate and the number of communities into which a network can be divided. The two well known methods for graph partitioning are Kernighan – Lin algorithm and Spectral Partitioning.
2.1
Kernighan – Lin algorithm
The Kernighan – Lin algorithm was one among the early algorithms. It was proposed by Brian Kernighan and Shen Lin in 1970. According to this algorithm, divide the network vertices into two groups of the required sizes. Then, for each pair of vertices ( i, j ) such that ‘i’ lies in one group and ‘j’ lies in the other, calculate the difference in the cut sizes of actual positioning and the cut size once ‘i’ and ‘j’ are interchanged. ( i. e. ) placing ‘i’ and ‘j’ in each other’s group. From among various (i, j) pairs available, the pair that reduces the cut size to the minimum is found or, if none of the pair reduces it, the converse of the pair that increases the value of the cut size by a small value is found. This method preserves the sizes of the vertices of two groups, since one vertex leaves the group and another joins the group. The important point is that once a vertex has been swapped with another, it is not swapped again. The algorithm proceeds with the swapping until there are no pairs left to swap. When all swaps are completed we go back through every state that was passed by the network during the procedure and choose the state with least cut size value. Once a network can be divided into two pieces of a given size, then it can be divided into any number of pieces by the same process. The primary disadvantage of the Kernighan – Lin algorithm is its speed. Number of swaps performed during one round of algorithm is equal to the smaller of the sizes of two groups lying between zero and 1 / 2 n of ‘n’ vertices. Hence for a worst case scenario it has O (n) swaps. And for each such swap all pairs of vertices of different groups have to be examined. And also the change in cut size has to be examined for each of these if they are swapped.
2.2
Spectral Partitioning
The spectral partitioning method of Fiedler, which makes use of the matrix properties of the graph Laplacian. The spectral partitioning method is described as applied to the graph bisection problem, the problem of dividing a graph into two parts of specified sizes. As discussed in the previous section, division into more than two groups is typically achieved by repeated bisection, dividing and subdividing the network to give groups of the desired number and size.
An advantage of the spectral approach, however, is its speed. The time-consuming part of the algorithm is the calculation of the eigenvector v2, which takes time O(mn) using either the orthogonalization method or the Lanczos method, or O(n2) on a sparse network having m ∝ n. This is one factor of n better than the O(n3) of the Kernighan-Lin algorithm, which makes the algorithm feasible for much larger networks. Spectral partitioning can be extended to networks of hundreds of thousands of vertices, where the Kernighan-Lin algorithm is restricted to networks of a few thousand vertices at most.
3.
COMMUNITY DETECTION
Community Detection is a complementary method to that of graph partition in that it searches for naturally occurring groups in a network without any regard to their size or number. This is used as a tool for discovering and understanding the large scale structure of networks. One way to detect for communities in networks is to look for divisions that have highest modularity scores. The basic goal of community detection is similar to that of graph partitioning: to separate the network into groups of vertices that have few connections between them. The important difference is that the number or size of the groups is not fixed. Consider the problem of dividing a network into just two non-overlapping groups or communities, as previously, but now without any constraint on the sizes of the groups, other than that the sum of the sizes should equal the size n of the whole network. Thus, in this simple version of the problem, the number of groups is still specified but their sizes are not.
3.1
Division into more than two groups
Community refers to the natural grouping of vertices in network. The structure of the network fixes the number of communities in a network. One of the most widely used methods is simulated annealing. It works by treating the quantity of interest – modularity. The main drawback of this strategy is that it is slow. It takes longer time to reach the solution. Another general optimization method is genetic algorithm. It provides high quality results but is very slow. This method is applicable to a network of few 100 vertices. The third method is by using greedy algorithm and it is simple. In this approach, each vertex of or network is started out as a one vertex group of its own. Then it is successively combined together in grouped pairs. At each step the pair which gives the maximum increase in modularity or the smallest decrease is chosen. Ultimately all vertices are combined together into a single large community and ends there. Then the states through which the network passed during the course of algorithm are seen and the one with the maximum modularity value is selected. Initially the run time is of the order O(n2) but it can be improved to O(n log2n) using suitable devices. This gives a reasonable division of networks but the modularity values achieved are lower than those obtained by the previous methodologies. But the runtime is the best of any current algorithm.
4.
CURRENT METHODLOGIES
4.1
Betweenness based community
detection algorithm
Another way to find community of vertices in a network is to look for edge between communities. If the betweenness edges are found and removed we acquire isolated communities. A very common approach is to use betweenness centrality. It is the number of shortest paths in the network that pass through that particular vertex. Edge betweenness is what counts the number of geodesic paths that run along edges.
and counting how many such paths go along each edge. It can be calculated in time O[ n(m+n)].
Fig 2: Identification of between – group edges
In figure 2, this simple example network is divided into two groups of vertices (denoted by the dotted lines), with only two edges connecting the groups. Any path joining vertices in different groups (such as vertices u and v) must necessarily pass along one of these two edges. Thus for a set of paths between all pairs of vertices (such as geodesic paths, for instance), we expect the between-group edges to carry more paths than most. By counting the number of paths that pass along each edge we can in this way identify the between-group edges. As for detecting communities, it is as follows. The betweenness scores of all edges are calculated and the edge with the highest score is searched and removed. By removing the betweenness scores of certain edges are changed. Hence it has to be recalculated following the removal. And the removal process is continued. At the end of the process the network will split into two pieces and three and so on.
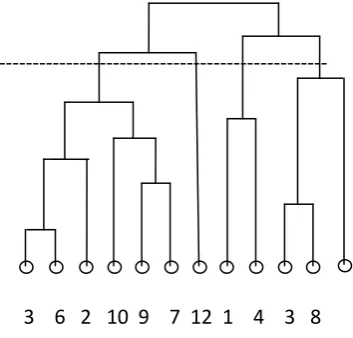
The progress of an algorithm is represented using a dendrogram. At the bottom of the dendrogram we have leaves representing one of the vertices of the network. As we move up, the leaves join together first in pairs and then in larger groups until they form a whole starting with a single network and splitting it till the leaves are reached, thus a dendrogram can capture in a single diagram the configuration of groups in a network at every stage.
---
3 6 2 10 9 7 12 1 4 3 8
Fig 3: A Dendrogram
The progressive fragmentation of edge removal in a network is represented by the successive branching of the tree. This algorithm does not give a single decomposition but different
possibilities for community structure in a network. It may range from coarse divisions with a few large partitions or fine divisions with many small divisions. But the disadvantage is that this algorithm is quite slow.
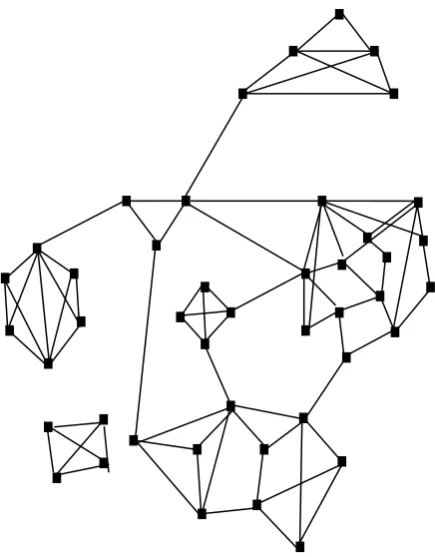
Fig 4: Partitioning the karate club network by average linkage hierarchical clustering
The dendrogram in figure 4 is the result of applying the hierarchical clustering method described in the section 4.2 to the karate club network. The shapes of the nodes represent the two known factions in the network.
4.2
Hierarchical Clustering
It is a technique where the individual vertices of a network are joined to form groups. They are clustered together but not coherent. The basic idea is to define a similarity measure between vertices based on network structures and then the most similar vertices are grouped. After choosing a similarity measure it is calculated for all pairs of vertices in the network.
5.
EXISTING TECHNIQUES
5.1
Multi – objective Immune Algorithm
it often results in community structure with high temporal variation.Detecting communities is becoming an important research topic in social network analysis, web community analysis, applied physics, computer vision, machine learning, etc. In recent years, many effective static network detection approaches have been proposed by researchers successively. Girvan and Newman proposed a divisive algorithm that uses edge betweenness as a metric to identify the boundaries of communities. The algorithm is most popular and historically important. However, the algorithm makes heavy demands on computational resources; afterwards Newman proposed another fast algorithm based on the greedy optimization of the quantity known as modularity.
The first algorithm that finds both overlapping communities and the hierarchical structure was proposed by Lancichinetti [1]. Recently,finding communities and their evolutions in dynamic networks has gained more and more attention. Kumar et al. studied the evolution of the blogosphere as a graph in terms of the change of characteristics, the change of communities, as well as the burstiness in blog community. Chakrabarti et al. proposed the first evolutionary clustering method as the problem of clustering data coming at different time steps to produce a sequence of clustering. It should take care of two potentially conflicting criteria: the current clustering should reflect as accurately as possible the data coming during the current time step; at the same time, the clustering should not shift dramatically from one time step to the successive. This framework assumes that the abrupt change of clustering in a short time period is not desirable, thus it smooth out each community over time by incorporating temporal smoothness at each time step. The detection of community structure with temporal smoothness can be formulated as a multi-objective optimization problem. The first objective is the maximization of the community quality, which measures how well the community structure found, represents the network at the current time. The second objective is the minimization of the temporal cost, which measures the distance between two community structures at consecutive time steps.
Experimental results on synthetic datasets and real-world networks demonstrate that our algorithm can obtain the better performance than the two compared methods. It can achieve better accuracy in community extraction and capture community evolution more faithfully. The results obtained by the algorithm DYN-LSNNIA are not only more accurate, but also more steady than the other two algorithms. However, the time-consuming problem should be dedicated to in our future work.
5.2
Online Multi – Resolution Community
Detection
Researchers have proposed several methods for identifying communities based on the local link structure of a network. A local community is found until the expansion rate falls below some predefined threshold. This approach works well only if the source vertex is enclosed in the middle of the module. The LWP algorithm proposed [2] defines a different local modularity measure, which is closely related to the idea of a weak community. However, like other density-based clustering methods, it is sensitive to a minimum similarity threshold parameter, and it provides no automated way to find the parameter. Another important feature of complex networks is the intrinsic hierarchical community structure. So
the revealed communities depend on the scale at which the network is examined. The proposed method is able to identify communities both overlapping and non-overlapping, and it is shown that it is fast and scalable in large-scale networks. Moreover, it is described that the algorithm is a multi - resolution solution that can be used freely to acquire communities at any resolution. Experimental results on the real-world and synthetic datasets show that the algorithm achieves good performance. In the future, it is believed to be beneficial to apply this method when analyzing large-scale online networks like mobile communication networks and/or Web graphs.
5.3
Detecting
the
overlapping
and
hierarchical Community Structures in
Complex Networks
Many networks today are characterized by their mesoscopic level of organization. In such organizations groups of nodes form tightly knit units called as communities or models. Uncovering this community structures is considered to be one of the most complex problem in the field of networks. To provide the most exhaustive information about the modular extract of graphs, a good algorithm should be able to detect both overlapping communities and the hierarchies between them. Such a framework [5] has been introduced to meet the two demands. It performs a local search on the network for a natural community of each node. During this, nodes can be visited any number of times, whether it has already been assigned to a community or not. The basic assumption is that communities involve nodes belonging to the modules themselves plus an extended neighbourhood. The algorithm proposed stops when all nodes have been given to at least one group. The nodes of communities may overlap or not. But a question may arise as to how to combine hierarchical communities with overlapping communities as the meaning seems incompatible with the existence of nodes shared among communities. It is hard to estimate the complexity of computing the algorithm, as it is dependent on the community and its size and the extent of its overlapping. This in turn strongly depends on the specific network taken under consideration. For hierarchical networks this procedure has a worst case computational complexity of n2logn. Besides for the local optimization of other fitness functions the processes may considerably lower the complexity of computing the algorithm which seems a promising research direction for the future.
5.4
Multiobjective Evolutionary Algorithm
for Dynamic Social Network Clustering
real world problems, extending research in various areas. In clustering social networks, the most important property that has been largely ignored is that they usually change very dynamically. Communities evolve over time rather than assembling or disbanding spontaneously. Also people tend to change their community infrequently and interact with the home community most of the time. Whenever the graph expands edges from new or old nodes are added to the existing clusters so that network remains stable but a non negligible fraction of the graph’s property changes.
The goal of Multiobjective optimization is to find a population of solutions approximating the front. MOEA are designed to approximate the front. The MOEA has been used on real world data to generate a suitable test for comparing different MOA. The proposed framework [3] is restricted in its dynamics since only the addition of nodes and edges has been experimented and not the deletion. Real world social networks not only grow over time but also see changes of relations in existing social networks. Hence further study of more realistic dynamic graph clusters poses an interesting direction for future research.
6.
CONCLUSION
This paper concludes with the idea to apply the technique of multi resolution to divide the large network into clusters in the multi objective immune algorithm. In local structures, a network is covered by distinct vertex groups. In the processing, we only deal with the vertices in a limited region, including the community, the neighbourhood, and the unknown part. In such a system [2], we define the community structure by means of neighbourhood, structural similarity, tightness, tightness gain and tunable tightness algorithm. The techniques used have designed to obtain the above mentioned factors and hence divide larger networks with much ease. Unlike methods proposed in earlier algorithms which calculate the quantitative metrics for every vertex in the neighbor sets and select the vertex who produce the greatest increment of the metric to join the community, the proposed method picks the neighbor vertex with the largest similarity as the candidate vertex and calculate to determine whether it should be added to the community or not. The structural similarity reflects the local connectivity density of the graph. The larger the similarity between a vertex outside the community and a vertex inside it, the more common neighbors the two vertices share, and the more probability they are at the same community. When the overlapping communities are considered, the running time is longer than the non-overlapping process because some vertices will be visited multiple times. However, the computational complexity is hard to estimate as it depends on the resolution parameter and intrinsic link structure of the network.
7.
ACKNOWLEDGEMENTS
We would like to express our sincere gratitude to our mentor, Mr. K. Sendil Kumar, who has been showing us the right method to analyzing various algorithms and hence arriving at our own. We would also like to thank the teachers of our esteemed institution for rendering their help towards the completion of this paper.
8.
REFERENCES
[1] Mao – Guo Gong, Ling – Jun Zhang, Jing Jing – Ma and Li – Cheng Jiao, “Community Detection in Dynamic Social Networks based on Multiobjective Immune Algorithm”, Journal of Computer Science and Technology, May 2012.
[2] Jianbin Huang, Heli Sun, Yaguang Liu, Qinbao Song and Tim Weninger, “Towards Online Multiresolution Community Detection in Large – Scale Networks”, August 2011.
[3] Keehyung Kim, Ri (Bob) McKay and Byung – Ro Moon, “Multiobjective Evolutionary Algorithms for Dynamic Social Netowork Clustering”, ACM 2010.
[4] Tinbao Yang, Yun Chi, Shenghuo Zhu, Yihong Gong and Rong Jin, “Detecting Communities and their evolutions in dynamic social netoworks – a Bayesian approach”, Springer 2011.
[5] Andrea Lancichinetti, Santo Fortunato and Janos Kertesz, “Detecting the overlapping and hierarchical community structure in complex networks”,March 2009. [6] M. E. J. Newman and M. Girvan, “Finding and
evaluating community structure in networks”, August 2003.
[7] M. E. J. Newman, “Fast algorithm for detecting community structure in networks”, September 2003. [8] C. O. Dorso and A. D. Menus, “Community Detection in
Networks”, International Journal of Bifurcation and Chaos, 2010.
[9] Wenye Li and Dale Schuurmans, “Modular Community Detection in Networks”, Internaltional Journal of Computer Applications, 2011.