1633
Feature Analysis Of Skin Disease Images Using
Various Techniques Of Digital Image Processing
Anita Thakur, A.J.Singh
Abstract: Digital Image processing has emerged as an instrument primarily to enhance the quality of images in terms of greater clarity and better description. It is employed inevitably in various fields of the applied science as well as social science. The application areas include the following but not limited to such as the investigating agencies, video processing, pattern recognition, medical field and political science etc. The present paper is an attempt to apply the techniques of image processing in the specialized field of Medical Science that deals with the diagnosis and treatment of skin diseases, known as Dermatology. Skin disease is the skin lesion which affects hair, nail, scalp, skin and mucous membrane. Image processing can help for the early detection of the skin disease. Various techniques have been developed for digital image processing that are used to extract the features of an image such as color, edge and highlights the affected area. Some of those techniques such as Color Transformation, Gray Level Transformation, Histogram, Edge Detection etc. have been studied to analyze the images of skin disease. These techniques have also been applied to enhance the images in order to make them clearer and detailed. Octave tool has been used in this study.
Index Terms: Skin Diseases, Dermatology, Image Processing, Feature Extraction, Gray level Transformation, Histogram, Edge Detection and Octave.
—————————— ◆ ——————————
1 INTRODUCTION
Digital image processing is the manipulation of the digital image by using applications of information systems and computing algorithms to enhance the quality of an image in order to get better information [1]. Image processing takes image as an input and after processing, output is generated also in the form of an image. Dermatology is area of medicine which concern with the largest organ of the body i.e. skin. Every age group and every person in his/her life time is affected at least once by the skin disease [2][3]. Skin diseases are easily visible to the naked eyes but computer vision aid makes them more effective and enhanced to observers. Digital image processing contains various feature extraction techniques which makes the information gathering more useful and operative. Color transformation contains RGB, HSV, YCbCr and Gray Color models which enhance the quality of the digital image [8]. Octave is an Open Source software used for numerical computations. It is a part of GNU Project which is compatible with the MATLAB. In this paper, color transformation has been ensured by using RGB, YCbCr, HSV and Gray Color model to analyze the image, which gives the clearer information about the image processed. Gray level transformation has been used to enhance the visual quality images and to get detailed image. Three basic gray level transformations are linear logarithmic and power law. Histogram processing techniques include histogram sliding, histogram stretching and histogram equalization. These techniques are exercised on digital images. Various edge detection techniques and statistical measures are performed on the image.2
LITERATURE
REVIEW
2.1 Review Stage
Analysis of digital image is concerned with the recognition of the image content. Stone et.al. described digital imaging technique in dermatology. They used the digital imaging technique for 10 patients to follow cutaneous lesions. The experimental setup included a personal computer, digitizer board, monitor, video camera and lights. The paper has highlighted that the images generated were of good resolution and color fidelity [4].Hasim et.al. used various image processing and filtering techniques available in the MATLAB tool and applied those techniques on skin disease images to produce their histogram and color distribution[5]. Yasir et.al. described dermatology logical disease detection using image processing and artificial neural networks. The system examined an image of infected human skin and detected the disease with an accuracy rate of 90% [7]. Amarathunga et.al. presented a development of the skin disease diagnosis system that allow the users to identify disease of human skin and to provide advises or medical treatments in a very short time period. The system has exhibited disease identification accuracy of 85% for eczema, 95% for impetigo and 85% for melanoma [6]. Haddad et.al. proposed a framework for image analysis model for skin disease detection. Aim of the study was to detect skin disease from a skin image [9].
3 METHODOLOGY
Image processing techniques have been applied on several digital images of the skin diseases. The images are listed below along with their descriptions. The various techniques applied are listed below:
Fig. 1: Vitiligo [10] Fig. 2: Ringworm [11] _______________________________________
•Anita Thakur is currently pursuing master’s degree program in computer science in Himachal Pradesh University, India, E-mail: [email protected]
1634
Fig. 3: Eczema [12] Fig. 4: Psoriasis [13]
Fig. 5: Wart [14] Fig. 6: Foot Ulcer [15]
Fig. 7: Acne [16] Fig. 8: Melasma [17]
Aspect ratio of the images has maintained to 258 × 195. The images have been collected from various websites.
3.1 Color Space Transformation
Various color spaces Gray, YCbCr and HSV has applied on the input images. RGB is a default color model of digital images. Individual frames of red, blue and green can be retained from the RGB color space component as shown in Fig. 9.
Fig. 9: individual red, green and blue frame
HSV color space, Hue is expressed by 0-360 degree containing the color red, yellow, green, cyan, blue and magenta. Saturation and Value represents the brightness and intensity of the colors.
3.2 Gray Level Transformation
Gray level transformation works with the transformation of the pixels. Gray level is of three types: linear, logarithmic and power law. Image enhancement techniques augment the digital image with better details. There are 256 levels of gray color in image enhancement. The overall graph to represent all the transformations is Fig. 10:
Fig. 10: Gray level transformations [18]
Fig. 11: Negative transformation
1635
Fig. 12: Inverted transformation. Fig. 13:Linear
transformation
The basic logarithmic function (defined as s = c*log (1+r)) deals with log and inverse log transformations. The basic function of power law deals with nth and nth root transformations, which is defined as s = crγ. In this study all the three gray level transformations are studied in order to get brighter and enhanced images.
3.3 Histogram processing
Histogram is a graph which refers to the pixel intensity value. The histogram of a digital image is a discrete function h(rk) = nk, where nk is the number of pixels in the image with intensity rk. The variable rk is the kth intensity value with the assumption that intensity level is in the range of [0, L-1]. In histogram, the x-axis (horizontal axis) represents the brightness (intensity) from [0, 255] and the y-axis (vertical axis) represents the number of pixels (count). In this paper three histogram processing techniques named as histogram sliding, histogram stretching and histogram equalization have been studied. Histogram of the images is fabricated (Fig. 14) in order to identify the brightness, contrast, over exposure and under exposure.
Fig. 14: Histogram of input image.
Histogram sliding is used for the purpose of increasing and decreasing the brightness. To do so, some values are added and subtracted from the matrix of the images. For example, by adding 100 values to the older image, a brighter new image is generated. Histogram stretching is used to increase the contrast of the resultant image. Histogram stretching is defined as
g(x, y) = (f(x,y)-f(x,y)min)/(f(x,y)max-f(x,ymin)) (max-min)+min (1)
Histogram equalization has been used to formulate the similar number of pixels at each level.
3.4 Edge Detection
Edge detection is a process of finding the regions in the image, where there are sharp changes in intensity. Edge
detection is used for detecting the Edges, so that the features can be sharpen to get clearer images. In this paper Prewitt, Sobel, Robinson and Laplacian edge detection methods have been studied. Sobel operator has been used in order to get the resultant image for the final analysis because it has worked just fine with all the images of the skin diseases. Prewitt operator detects the horizontal and vertical edges shown as Fig. 15:
Fig. 15 : Vertical Prewitt Operator (Left) and Horizontal Prewitt Operator (Right).
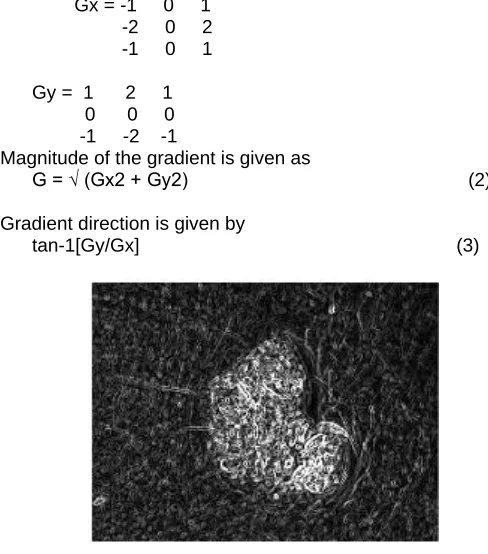
Sobel operator is concerned with the kernel convolution process. It is a gray scale operator i.e. image needed to be converted into gray image before applying the Sobel Operator. Gradient of an image in x direction Gx and gradient of an image in y direction Gy is defined as follows:
Gx = -1 0 1 -2 0 2
-1 0 1
Gy = 1 2 1 0 0 0 -1 -2 -1
Magnitude of the gradient is given as
G = √ (Gx2 + Gy2) (2)
Gradient direction is given by
tan-1[Gy/Gx] (3)
Fig. 16: Sobel Operator used on wart image.
1636
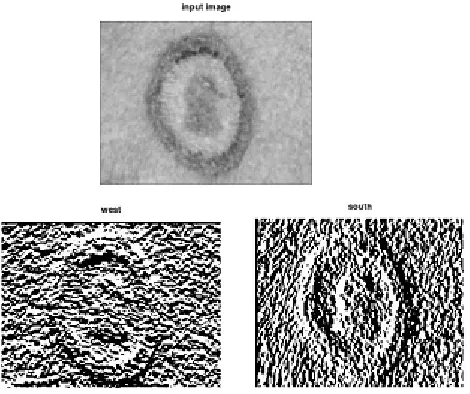
Fig. 17: Ringworm Image, Robinson compass mask west
direction, south direction.
In order to remove the noise from the input image, Gaussian Filter has been used. Fig. 17 shows the results computed from the Robinson Compass Mask technique in west and south directions, which is clearly distinguishable from one another. West mask detected all the edges from west direction and south mask detected the edges from south direction.Laplacian is a second order derivative mask, used to detect the edges in the images. In laplacian operator, mask used is expressed as follows:
∇= 0 1 0 1 -4 1 0 1 0 Laplacian filter is defined as:
∇2 = ∂^2/(∂x^2 )+ ∂^2/(∂y^2 )+ ∂^2/(∂z^2 ) (4)
3.5 Statistical Measure
Statistical measures i.e. mean, median, mode, variance, standard deviation, kurtosis and skewness have been studied. These statistical measures have been computed by writing an octave program. Mean computes the average of the intensities in the image processing. In the present paper, mean has been computed for red, green, and blue and also for the whole RGB image. Mode in the statistical measure is defined as the value that occurs frequently. Standard deviations show the variability in image processing, in other words, it shows that the variations exist from the average values. A low value of standard deviation means that data points are close to the mean, whereas high value of standard deviation shows that the data points are spread over a broader range of values.
Standard deviation is expressed as:
√(1/(n-1)) ∑n (x-x ̅ )2 (5) i=0
where x ̅ is mean.
Skewness is characterized as the degree of asymmetry of probability distribution around its mean. Skewness = 0,
indicates the normal distribution, skewness > 0 indicates positive value and the tail is on the right side. Skewness < 0 indicates the negative value and the tail is on the left side.
Skewness = ∑(xi - x ̅)3/nσ3 (6)
where sample of standard deviation is expressed as σ.
(a) (b)
FIG 8
Kurtosis indicates the shape of the peaks in probability distribution of data. A high value of the kurtosis indicates that the peak is near the mean. Kurtosis in Fig. 18 (a) is computed and is equal to 6.453. It indicates that the peak is sharper than the normal distribution and is near to the mean. On the other hand Fig. 18 (b) indicates the value of the flat head which is computed and is equal to 2.663.
4 RESULTS
AND
DISCUSSION
It is observed that some of the technique method such as gray color space model, histogram stretching, histogram equalization and Sobel operator has worked well in this study. After applying these techniques on digital images of skin disease, some of the method named Gray scale color model, Gaussian filter and Sobel operator picked for the final observations/ study. Statistical measure such as mean, median, mode, standard deviation, skewness and kurtosis of digital images has been computed. In color transformations, Gray Color Space image showed clearer details as compared to YCbCr and HSV.
Fig. 19: Resultant images after applying gray, YCbCrs and
1637 Histogram processing has been studied in order to increase the
brightness and contrast of the image. It is observed that after shifting histogram to the right, it produces brighter image as output. Histogram of output image has been shifted from a range of approximately 70-200 to a range of 120-250 on x-axis. The shape of the shifted histogram is same as the histogram of input image. Unlike histogram sliding, in histogram stretching and histogram equalization, shapes of the histograms have changed. Histogram equalization has given the better details of the images.
Fig. 20: Histogram processing of image of psoriasis
After applying the histogram equalization method, the resultant image has more contrast and brightness. Histogram equalization made count of pixels, similar at each level and also stretched the range of intensity level. Mean of the red, green and blue components of the RGB image has been computed. Table 1 shows mean of the various images:
Table1: mean of red component, blue component, green
component and input image.
Statistical measures i.e. mode, variance, standard deviation, skewness and kurtosis of the image has been computed.
Table2: statistical measure of skin disease
1638 to detect the edge of the image and the statistical measures
have been computed subsequently.
5
CONCLUSION
Various image processing techniques have been applied on digital images of the skin diseases in order to get the quality images. Octave tool has played a major role. The processed images are the candidate images to help the dermatologists to assess the diseases clearer and better. To fulfill the objectives, techniques like gray scale transformation, histogram processing, noise removing and edge detection has been employed. Statistical measure helped to quantify the average in intensity, variability, degree of asymmetry in probability distribution and shape of the peak. As a future scope, artificial neural networks can give this study the new dimensions and can make it to be more effective and perceptible.
6
REFERENCES
[1]. R.C. Gonzalez, R.E. Woods and Addison-Wisley, “Digital Image Processing,” pp. 23-56, 2002.
[2]. Healio dermatology. Retrieved from: https://www.healio.com/dermatology/hormones-and- the-skin/news/online/%7B9da9430b-a14f-469d-9b4b-149e0a36831b%7D/what-is-dermatology
Accessed:September 21, 2019.
[3]. WebMD. Retrieved from:
https://www.webmd.com/skin-problems-and-treatments/picture-of-the-skin accessed: September 21,2019.
[4]. J.L. Stone, R.L. Peterson and J.E. Wolf, ” Digital Imaging Techniques in Dermatology,” Journal of the American Academy of Dermatology, Vol. 23, no. 5, pp. 213-217, 1990.
[5]. H. Hashim, R. Jailani and M.N. Taib, “A Visual Record of Medical Skin Disease Imaging using MATLAB Tools,” In Student Conference on Research and Development Proceedings, Shah Alam, Malaysia, pp. 40-44, 2002
[6]. A.A.L.C. Amarathunga, E.P.W.C. Ellawala, G.N. Abeysekara and C.R.J Amalraj,”Expert System For Diagnosis Of Skin Diseases,” International Journal Of Scientific & Technology Research, Vol. 4, no. 1, pp. 174-178, 2015.
[7]. R. Yasir, Md.A. Rahman and N. Ahmed,” Dermatological Disease Detection using Image Processing and Artificial Neural Network,”in 8th International Conference on Electrical and Computer Engineering, Dhaka, Bangladesh, pp. 687-690, 2014 [8]. S. Kolkur, D. Kalbande, P. Shimpi, C. Bapat, and J.
Jatakia,”Human Skin Detection Using RGB, HSV and YCbCr Color Models,” in Proceedings of the International Conference on Communication and Signal Processing 2017, Vol. 137, pp. 324-332. [9]. Haddad, S.A. Hameed, “Image Analysis Model For
Skin Disease Detection: Framework,” in 7th International Conference On Computer and Communication Engineering (ICCCE), pp.280-283, 2018.
[10]. AboutKidsHealth. Retrieved From: https://www.aboutkidshealth.ca/Search/Pages/AKHRe sults.aspx?k=vitiligo&language=English Accessed:
September 16, 2019.
[11]. WebMD. Retrieved From:
https://www.webmd.com/skin-problems-and-treatments/ss/slideshow-ringworm Accessed: September 21, 2019.
[12]. WebMD. Retrieved From:
https://www.webmd.com/skin-problems-and-treatments/eczema/picture-of-eczema Accessed: October 03, 2019.
[13]. WebMD. Psoriasis image. Retrieved From:
https://www.webmd.com/skin-problems-and-treatments/ss/slideshow-common-adult-skin-problems Accessed : October 04,2019.
[14]. WebMD. Wart Image. Retrieved From:
https://www.webmd.com/skin-problems-and-treatments/ss/slideshow-common-adult-skin-problems Accessed : October 04,2019.
[15]. Source: Retrieved From:
https://www.podiatrygroupofgeorgia.com/glossary/dia betic-foot-ulcer/ Accessed: October 04, 2019.
[16]. WebMD. Retrieved From:
https://www.webmd.com/skin-problems-and-treatments/acne/ss/slideshow-acne-dictionary Accessed : October 04,2019.
[17]. WebMD. Retrieved From:
https://www.webmd.com/skin-problems-and- treatments/picture-of-melasma-pregnancy-mask-on-cheek Accessed : October 04,2019
[18]. Source of Fig. (3.3.1)
![Fig. 10: Gray level transformations [18]](https://thumb-us.123doks.com/thumbv2/123dok_us/8638118.1427826/2.612.35.301.64.435/fig-gray-level-transformations.webp)