A Deep Learning Approach For Brain Tumor
Segmentation Using Convolution Neural Network
Sai Meghana S, Amulya P, Manisha A, Rajarajeswari P
Abstract: The objective of this project is to develop a fully automated system for segmentation and classification of brain tumor using convolutional neural networks. Tumors are of any shape and size in the brain. This motivates us to use a deep neural network of high capacity. This paper gives the summary of the work done by us and the methodology we used. We used BraTS dataset to develop this project and to test the trained models. This dataset contains the MRI images of 200 patients. The MRI scans are segmented using patch wise segmentation. This methodology shows approximately 95.6% accuracy on the test dataset. Many experiments are done by us to find the depth of the neural network and to know the best architectures that can be used. The exact location of the gliomas is found by the convolutional neural network. For finding the spectral location of the gilomas in the glilac cells, we used combination of deep neural network and convolutional neural network .This architecture can also be used to predict the future status of the organs.
Index Terms: Bias Field Distortion, Classification, Convolution neural network, Deep neural network, MRI, Segmentation, Tumor. —————————— ——————————
1.
INTRODUCTION
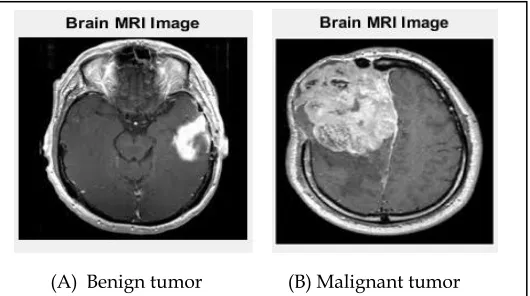
The growth of abnormal cells inside the skull is identified as brain tumor. Problems are caused by this abnormal growth inside the skull since it is rigid. Brain tumors can be categorized into mainly two types. The non-cancerous (benign) tumor and the cancerous (malignant) tumor. Any extra growth of cells in the brain can result in pressure inside the skull. This pressure may cause damage to the brain. And this damage can be life-threatening. Tumors in the brain are of two types, primary and secondary. Many of the primary brain tumors are benign tumors. Metastatic brain tumors is a other name of Secondary brain tumors. These tumors do not necessarily start in the brain. These can spread from other organs like breast or lung [1]. These tumors can be diagnosed using medical imaging. The visualization body parts and tissues can be done by using medical imaging. This is used to monitor the disease, treatment of the disease and to diagnose the disease. Radiology is the field used in medical imaging. Every physiological and anatomical detail in the human body is provided by this medical imaging. This is done at a high resolution to provide a clear image of the parts of the body and the tissues. The imaging techniques that can used for the diagnosis of the diseases include CT scan, X-Ray, and Magnetic resonance imaging (MRI). Every finite detail regarding the development of the human brain and the detection of the abnormal growth of the cells in the brain can be detected through MRI’s. It can be used to get the detail anatomical information about the brain tumors, ankle and foot. It uses magnetic fields and radio waves for imaging. Therefore, it is the most preferred technique for diagnosis of an image than CT scan and X-ray [3].
Generally, brain tumor may be one of the reasons for the cause of strokes. If the brain tumor is not detected the patient is treated for heart strokes instead of brain tumor. Hence detection of the tumor is an crucial step in the treatment of a patient who is affected with brain tumor. If the tumor is detected in the earliest stage possible, the life time of the patient can be increased [4]. Normally, poor contrast is the problem in traditional medical imaging techniques. Therefore, MRI is the best technique among the techniques that exist today for the diagnosis of the tumor. Image segmentation is a very important step in the detection of the brain tumor. Segmentation is helpful in changing the representation of the image. It changes the image into a meaningful manner which helps to locate the tumor region by detecting the edges and segmenting the images into different regions. These regions compose the whole image [5]. So it is essential for developing an image segmentation system that gives accurate results and has the properties like fast computing. Image segmentation is a method that divides the image into meaningful and significant regions depending on the properties like texture, intensity variation and similarity as well as discontinuity. Edge detection is one of the methods used for segmenting the image. In the proposed technique the image is partitioned into different regions based on the edges and the intensity variations between the pixels. There is no requirement of preceding information of the image for this technique. This technique is efficient when compared to the other imaging technique due to the features like fast computation [6]. There are other segmentation methods which are based on the similarity of the intensity between the pixels in the image. Region growing, unsupervised and thresholding are some of the techniques which come under this region. Region growing technique is a simple technique which has more immunity to noise when compared to edge detection. This method divides the image into regions based n some predefined value which indicates the similarity between the pixels in the regions. Thresholding is another simple technique. But it is not efficient when compared to the other techniques because it requires some predefined information about the image. Un-supervised algorithms include techniques such as k-means, fuzzy, self-organizing maps (SOM) and many others. It is efficient and less sensitive to errors. In this paper, we have developed a methodology inspired from the deep neural networks and experimenting different architectures of CNN. We worked on this architecture by using small kernels in the convolution layer ————————————————
Sai Meghana S is currently pursuing bachelor’s degree program in Computer Science and Enngineering in KLUniversity, India, PH-8096063170. E-mail: [email protected]
1698 of the network for processing the image. The small kernels can
be stacked to achieve a deeper architecture. We can have the same receptive field as the bigger kernels. This architecture can apply more processing step and it can address the heterogeneity in the data that is caused by the acquisitions of the images.
2
LITERATURE
SURVEY
Medical image processing is one of the topics leading the research. Many researches contributed their algorithms and techniques towards the segmentation of the medical image. Bandhyophyav and Paul [10] put forward a technique that used k-means clustering for segmentation. In the processing of the image the image has to be segmented into two parts for the recognition of the region with brain tumor. One segment of the brain is composed White Matter (WM), Gray Matter (GM) and the Cerebral Spinal Fluid (CSF).The other segment of the brain consists of the tumor cells. This method fuses multiple images. Good results were obtained from this fusion method. But in this method, intensity loss was identified. The anatomic information was also being ignored in this method. This information contains overlapping of the cells in a region in the brain and in boundaries. Another technique for image segmentation was proposed by Meena and Raja [11] for Positron Emission Tomography (PET) scan images and this approach uses Spatial Fuzzy C-Means clustering algorithm. This approach joins the spatial neighbourhood data with the FCM and then the objective function of each cluster is updated. Based on the statistics provided by the objective function, the weighing function is calculated which is then applied to the membership function. Alzheimer’s disease dataset is used to test this approach. This algorithm needs human involvement. The quality assessment is not done based on the objective. Therefore, the image quality is not reported using this algorithm. Galvan and Holban [12] used convolution neural network in their proposed system. X-Ray images are used for the segmentation process which uses CNN as pixel classifier. The classifier tries to categorize the images into two groups i.e. into bone and non-bone. The system analyzes each pixel of the image. This method obtained the best results compared to the other configurations of CNN. This method takes more time for training and is not efficient when the bone has some irregularities. Tatiraju and Mehta [13] used algorithms like Normalized cuts(NC) k-means and Expectation Maximization (EM) for image segmentation. These two un-supervised algorithms were compared by using graph-based algorithm and NC algorithm. In this algorithm, many clusters appear at discrete places in the image. Thresholding and morphological operations are used in the methodology proposed by M.A. Jaffar et al [14]. It is simple to comprehend and execute than the other techniques used for image segmentation.
3
THEORY
AND
EXPERIMENTATION
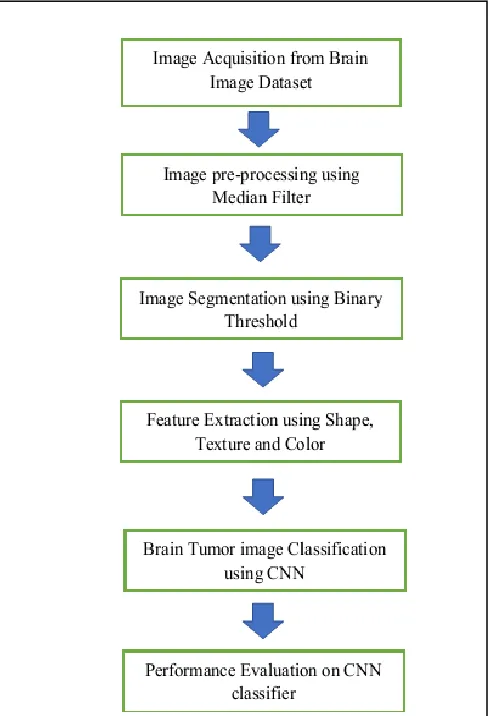
3.1 Pre-processing:
In pre-processing the MR images are altered using bias field distortion. Even for the same tissues the intensities vary across the MRI image. The intensity distribution of a tissue of the same type may not certainly have a similar intensity in the MRI’s which is considered as a notion for many segmentation methods. The intensity distribution can also vary for a same infected person’s image taken a number of times in the same
scanner. Hence, the proposed method can be used to intensify these normalizations to make changes in the image’s properties like contrast, color or brightness to bring similarity in the MR images. Frequency landmarks are obtained as a process of learning from training set to perform intensity normalization method. After learning, the frequency normalization is achieved by interpreting the original intensities into the learned landmarks. The histogram acquired from these sequences is therefore similar across the image sequence. Upon obtaining the frequency normalizations of MRI images ,we calculate the standard derivation and the mean intensities of each sequence.
3.2 Convolution Neural Networking:
Convolutional Neural Network (CNN) is widely used to accomplish accurate and greater results. Convolution layers are used to convert a signal or a kernel image to obtain feature maps. These kernels are used to extract the information from the layers. Generally, the output of each neural network is taken into account after applying the Non-Linear activation function. With the increasing depth of each convolutional layer the abstraction of extracted features increases. The patterns, objects, designs or any other features are strengthened in the first layer. We perform maximum pooling to reduce the any kind of over fitting in the features. It constrains all the nodes of the neural layer to make it better in its data representation, and also avert nodes from adapting the features of other nodes.
The collection of different nodes can be seen as a dropout as every other network is trained with its own part of training data.
3.2 Post-processing:
Post-processing performed by considering small parts of images or clusters may often be wrongly recognized as a tumor. To overcome this problem, Volumetric constrains are imposed on a cluster to remove those clusters whose segmentation threshold value is lesser than the required threshold gain value. In Post processing we deal with the effect of plane selection and the effect caused by the key components on the output which help in extracting the feature patches. We again use the same database for the comparison of the proposed method, and also for the approaches that depend on Deep Learning for tumor segmentation. By considering the improvement in performance, we can assess the influence of each of the component in the proposed system. Mean gain DSC, Sensitivity and PPV are taken into account to analyze the increase in performance obtained by the proposed method with the data given. Later we eliminate the components for further studying and calculate all the metrics for the unconventional method. Thus, we find the difference between the metrics of these two systems and compute the mean gain from this difference. The metrics of these two methods is represented in the form of box plot in Leader board data set and the challenge data set and then we illustrate the result of the experiment in the categories of HGG an LGG tumor. To condense the complexity and calculation the hyper parameters are kept to maintain the identical conditions. Also, we have only used the images from the training set for the intensity normalization function in the learning phase. Any test in this phase does patch extraction from planes that are perpendicular to the axial of the MR image, where they are estimated to choose the best axis from it. The effect of pre- processing is assessed by comparing the obtained result with the complementary method. This complementary method for pre processing begins by applying a one-percent win seizing over the other intensities in the brain. Each sequence of MR images uses N4ITK for adjusting the bias field and the corresponding intensities. The normalization is performed till each of the sequence has unit variance and zero mean. We found that in pre processing of LGG , we need to decrease the rate of initial and final learning for betterment. Else the optimization can deviate the pre processing with the intensity normalization in attaining an improvement in Leader board: 4.2 % , Challenge: 4.9 % and a total average gain of 4.6 %. The proposed pre-processing method hence improved the detection of core of the brain tumor especially in LGG, which is generally considered to be a tricky and complicated task. We observe that our preprocessing method definitely helps in improving the segmentation in LGG and plays an important role in overall performance because when we obtain the pre processing results without our method, we see the drop in the performance of the system. We know that that the bank of band pass filters instead of intensity because filters are used to learn the features calculated in local regions. A study of segmentation on multiple sclerosis in MR images is done by Shah, which demonstrates that intensity can be enhanced. This enhancement was seen by minimizing the heterogeneous features of data from a stimuli scanner of MR image. Then it projects the grid workflow of image data is applied as grid integration and the grid workflow manager bears the
responsibility for all those tasks linked with grid communication. The access rights of the code are set by the developer as it is seen as his responsibility and also he has to describe the work and accountability of the workflow manager. The runtime can be drastically reduced by applying the pre-processing steps in required order. It offers a novelistic medical volume reconstruction approach intending the implementation the additional bonus layer to the data-flow system i.e. of a web services.
In the recent years, the number of operations for classification and processing of the image has grown exponentially. The incorporation of the operators and the transition from closed system is expected to improve the accuracy of the system. To remove the noise in the MRI report median filter is used in the pre-processing of the image. In the proposed approach, watershed algorithm is used to detect the tumor. This algorithm is used to detect the tumor in the earliest stage.
4
RESULTS
4.1 Image Acquisition:
MRI scanning is used for image acquisition in the proposed system and these scanned images are represented in a 2-dimensional matrix with pixels as their components. Both matrices depend on the size of the matrix and the view field of the matrix. The images were stored in MATLAB and shown in size 256*256 gray scale. That gray scale image is entered in the range of 0 to 255, with 0 showing pure black color while, 255 showing pure white color. The outputs pixel values between the range vary from black to white in intensity. 30 male and 30 female patients are tested for this study, and all patients were between 20 and 60 years of age. Such patients MRI scans have been processed in the .jpeg image formats in the database. The tumor images are obtained with the aid of these MRIs and the scanned images were shown in a 2D matrix where the main elements of these pixels are considered. These matrices are based on view area and its size. To reserve the details in the images, it is implemented in MATLAB and shown in gray scale of 256*256. Intensity of the pixel quality of these gray images varies from decimal 0 to 255, where 0 is equivalent to the pure black color and 255 is comparable to the pure white color. Any intermediate value
1700 within the range differs to above vary between black and
white. The study was based on 10 male and 20 female patients, whose age ranged from 20 to 60 years. The resulting images of the tests were preserved in JPEG formats.
4.2 Noise Removal:
There are always a variety of noises in the digital images. The process of image acquisition resulting in irregular pixel values impacting the intensities present in the actual scenario is a result of faults basically in the noise. Through adaptive filtering, linear filtering, median filtering, these noises can be eliminated. In the case of linear filtering, it is necessary to replace averaging or gaussian filters with their local values in order to eliminate the unwanted presence of noises. Using average filters to eliminate the image’s pepper and salt noise. Median filtering is similar to that of the average filter where the values of pixels are based on neighborhood pixel values. The tolerance is less quiet than the outliers.
4.3 Sharpening of image:
The sharpening of the image can be done by adding various high-pass filters to the image. The noises in the image get filtered by applying different low-pass filters. Sharpening of the image helps in detecting the edges of brain tumors. Gaussian high pass filter is implemented to increase the border of the objects in the image. To enhance the object’s minute details, Gaussian filters can be used which result in better performance and are widely implemented.
4.4 Feature Extraction:
The feature extraction is the extraction of specifications showing the tumor by using the median filter method. This partial output is completely given to the thresh holding process and is applied to the whole image twice over the mask .It points out that the dark pixel is gloomy and white pixels are brighter.
4.4 Edge Detection:
The image is intensified in this process to enhance even the minute details and to remove noise in the image. The widely used methods of noise filtering were applied, which helps to obtain the practical results. The enhancement of these images gives smoother image, improved edges ,image sharpening and reduction of noise, and the better distorted outcomes of the supersending system. Finally, partitioning of objects will also be introduced. This detailed image helps to spot edged and improves the overall quality of the image. In finding the
precise location of the brain tumor, edge detection is used. Number of neurons in a layer connected to volume area is determined by the volume depth of the signal. Finally all the neurons will consider the input from different features and learn to activate. For example, if the starting layer of convolutional network takes input as a raw image, then in the presence of a number of oriented edges or different color blobs, different neurons can be activated along the depth axis. Stride controls the distribution of depth columns in the area of width and height of spatial dimensions. If stride is 1, the spatial position is allocated with a neuron depth column, which is divided by only 1 spatial unit. This will lead to strong overlap between the columns of the amenable receptive fields and also result in large output volumes. In comparison, if any strides which are of higher type are used then the receptive fields are less overlapping and the consequential output volume will have a minor spatial dimension. Often, changing the input by adding zeros on the input volume border is convenient. The third hyper parameter is the resulting zero padding size. third hyper parameter i.e. the zero-padding gives a lot of control over the output volume’s spatial size. Also, sometimes it important to store the spatial size of the input volume.
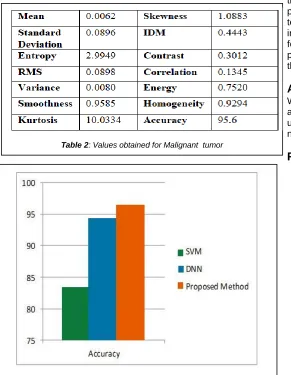
4.5 Accuracy Calculation:
(A) Benign tumor (B) Malignant tumor
Fig. 2. Images of all kinds of tumors from the dataset
(B) Benign tumor (B) Malignant tumor
Fig. 4. Images of all kinds of tumor after segmentation
5 CONCLUSION
In this paper, we used intensity and patch normalization. Later,
there will be a simulated increase in number of the patches during the training due to the rotation the training patches, and by using HGG samples to increase the number of uncommon LGG tumor classes. To allow deeper architectures, the CNN is designed over convolutional layers by using small patches of 3*3 kernels. In designing our process, using intensity normalization, we tackle the heterogeneity created by multi-scanner acquisition from MR images. We display that this is necessary for a good segmentation to be achieved. In their spatial location and structural composition, brain tumors are highly variable, so we explored that using the data augmentation to deal with such variance. We learned by rotating these patches and by performing sampling from HGG classes that have inadequate representation in LGG to improve our training data set. We found that the augmentation of the data was also quite successful, although it is not exhaustively investigated for brain tumor segmentation in deep learning methods. We explored the ability of deep architectures by implementing it using small kernels by contrasting the traditional deep CNN using shallow architectures having large filtering techniques. We also noticed that even using a larger number of feature maps, shallow
architectures provided a lower performance. Finally, we tested the activation function. Therefore, in this paper, we bring into play deep neural networking to resolve the glioma in the brain to identify the stages of gliomas and locate the organ affected in the future. By using neural networks, we will be able to forecast the future pretentious area and compared to the present generative methods, we were successful in reducing the computation time by about ten times.
ACKNOWLEDGMENT
We wish to thank Bandhyophyav and Paul for let us knowing about the different kinds of algorithms like k-means that can be used for image segmentation. This helped us in developing a new algorithm for the image segmentation.
REFERENCES
[1] L. G. Nyul, J. K. Udupa, and X. Zhang,―New variants of a method of MRI scale standardization,‖ IEEE Trans. Med. Imag., vol. 19, no. 2,,pp. 143–150,feb 2000.
[2] M. Prastawa et al.,―A brain tumor segmentation framework based on outlier detection,‖ Med. Image Anal., vol. 8, no. 3, pp. 275– 283,2004.
[3] Lee R. Dice ―Measures of the Amount of Ecologic Association Between Species Author(s)‖, ecology, vol .26,no.3. 2005.
[4] D. N. Louis et al.,―The who classification of tumours
of the central nervous system,‖ Acta
Neuropathologica, vol. 114, no. 2, pp.97– 109,2007. [5] C.H. Lee et al.,―Segmenting brain tumors using
pseudo - conditional random fields,‖ in Medical Image Computing and Compute Assisted Intervention-MICCAI. New York: Springe,2008.
[6] K.jarrett et al.,―What is the best Multi-Stage Architecture for Object Recognition‖,in proc. 12th int.conf.artif.intl IEEE Comput.vis,2009.
[7] X. Glorot and Y. Bengio,―Understanding the difficulty of training deep feed forward neural networks,‖ in Proc. Int. Conf. Artif. Intell. Stat., pp. 249–256,2010. [8] S. Bauer et al.,―Segmentation of brain tumor images
based on integrated hierarchical classification and regularization,‖ Proc. MICCAI-BRATS,pp. 10– 13,2012.
[9] F. Bastian et al.,―Theano: New features and speed improvements, ―in Deep Learn. Unsupervised NIPS 2012 Workshop ,2012.
A. Islam, S. Reza, and K. M.
Iftekharuddin,―Multifractal texture estimation for detection and segmentation of brain tumors,‖ IEEE Trans.Biomed. Eng., vol. 60, no. 11, pp. 3204–3215,2013.
[10]Meena A, Raja K. Spatial ―Fuzzy C-means PET image segmentation of neurodegenerative disorder spatial Fuzzy Cmeans PET image segmentation of neurodegenerative disorder‖. Indian JComput Sci Eng (IJCSE) 2013;4(1):50–5.
[11]Glavan CC, Holban S. ―Segmentation of bone structure in X-ray images using convolutional neural network‖. Adv Electr Comput Eng 2013; 13(1):1–8. [12]Tatiraju S, Mehta A. ―Image Segmentation using k
means clustering, EM and normalized cuts‖ University of California Iryine Technical Report.
[13]Yerpude A, Dubey S.‖ Colour image segmentation Table 2: Values obtained for Malignant tumor
1702 usingKmedoids clustering‖. Int J Comput Technol Appl
2012;3(1):152– 4.
[14]Mohammed Ismail B , K. Bhanu Prakash, M. Nagabhushana Rao‖ Collaborative Filtering-Based Recommendation of Online Social Voting‖ International journal of Engineering and Technology ― Volume 7 issue 3 1504-1507 July 2018
[15]K.Srinivas, Dr.Mohammed Ismail.B ―Testcase Prioritization With Special Emphasis On Automation Testing Using Hybrid Framework‖ Journal of
Theoretical and Applied Information
TechnologyVol.96. No 13 4180-4190 July 2018 [16]Mohammed Ismail B, Sowmya , Ravi Teja ―A
Comparative Study on dealing with sparsity in E-Commerce‖ International Journal of Pure and Applied Mathematics Volume 118 No. 5 2018, 185-194 ISSN 1311-8080 Jan 2018
[17]kumar S.A, Vidyullatha P "A comparative analysis of parallel and distributed FSM approaches on large-scale graph data" International Journal of Recent Technology and Engineering Open Access, Volume 7, Issue 6, April 2019, Pages 103-109.
[18]Pellakuri Vidyullatha, Rajeswara Rao D, "Training and development of artificial neural network models: Single layer feedforward and multi layer feedforward neural network",