OncoTargets and Therapy 2018:11 163–173
OncoTargets and Therapy
Dove
press
submit your manuscript | www.dovepress.com 163
O r i g i n a l r e s e a r c h
open access to scientific and medical research
Open access Full Text article
Identification of key pathways and genes in
TP53
mutation acute myeloid leukemia: evidence from
bioinformatics analysis
rui huang1,*
Xiwen liao2,*
Qiaochuan li1
1Department of Hematology,
2Department of Hepatobiliary Surgery,
The First Affiliated Hospital of guangxi Medical University, nanning, Guangxi, People’s Republic of China
*These authors contributed equally to this work
Background: Tumor protein p53 (TP53) mutations are not only a risk factor in acute myeloid
leukemia (AML) but also a potential biomarker for individualized treatment options. This study aimed to investigate potential pathways and genes associated with TP53 mutations in adult de novo AML.
Methods: An RNA sequencing dataset of adult de novo AML was downloaded from The Cancer Genome Atlas database. Differentially expressed genes (DEGs) were identified by edgeR of the R platform. Key pathways and genes were identified using the following bioinformatics tools: gene set enrichment analysis (GSEA), gene ontology (GO), the Kyoto Encyclopedia of Genes and Genomes (KEGG), Search Tool for the Retrieval of Interacting Genes/Proteins, and Molecular Complex Detection.
Results: GSEA suggested that TP53 mutations were significantly associated with cell differentiation, proliferation, cell adhesion biological processes, and MAPK pathway. In total, 1,287 genes were identified as DEGs. GO and KEGG analysis suggested that upregulation of DEGs was significantly enriched in categories associated with cell adhesion biological processes, Ras-associated protein 1, PI3K–Akt pathway, and cell adhesion molecules. The top ten genes ranked by degree, CDH1, BMP2, KDR, LEP, CASR, ITGA2B, APOE, MNX1, NMU, and TRH, were identified as hub genes from the protein–protein interaction network. Survival analysis suggested that patients with TP53 mutations had a significantly increased risk of death, while the mRNA expression level in patients with TP53 mutation was similar to those carrying TP53 wild type.
Conclusion: Our findings have indicated that multiple genes and pathways may play a crucial role in TP53 mutation AML, offering candidate targets and strategies for TP53 mutation AML individualized treatment.
Keywords: bioinformatics analysis, acute myeloid leukemia, TCGA, RNA sequencing, TP53 mutation
Introduction
Tumor protein p53 ([TP53] p53, encoded by the human gene TP53) is a tumor sup-pressor protein, which is involved in transcriptional activation, DNA binding and oligomerization with other proteins. The functions of p53 are primarily in inducing cell cycle arrest, apoptosis, senescence, DNA repair, and changes in metabolism.1,2 Somatic mutation of the TP53 gene is one of the most frequent alterations in human cancers, and the majority of cancer-associated TP53 mutations are missense mutations in the DNA-binding domain.3,4 Missense mutations of the TP53 gene result in a mutant p53 protein, which loses wild-type p53 tumor suppressive function and leads to a del-eterious gain of function (GOF).5 Morton et al’s research on pancreatic cancer suggest
correspondence: Qiaochuan li Department of Hematology, The First Affiliated Hospital, Guangxi Medical University, 6 shuang Yong road, nanning, 530021, guangxi Zhuang autonomous Region, People’s Republic of China Tel +86 771 535 6746
Fax +86 771 535 2681 email [email protected]
Journal name: OncoTargets and Therapy Article Designation: Original Research Year: 2018
Volume: 11
Running head verso: Huang et al
Running head recto: Key pathways and genes in TP53 mutation AML DOI: http://dx.doi.org/10.2147/OTT.S156003
OncoTargets and Therapy downloaded from https://www.dovepress.com/ by 118.70.13.36 on 25-Aug-2020
For personal use only.
Dovepress
huang et al
that mutant p53 GOF activities may play a role in increasing the metastatic potential and/or promoting metastatic tumor cells’ survival and proliferation.6 The GOF activity of mutant p53 may depend largely on multiple signals for mutant p53 protein stabilization, thereby, resulting in sustained activation of multiple biologic mechanisms in cancers.7
Recent studies have shown that TP53 mutations are frequently detected in acute myeloid leukemia (AML) patients, with a mutation rate of 5%–8% in newly diag-nosed patients8–12 and 30%–40% in therapy-related AML (t-AML).13 The TP53 pathway is frequently dysfunctional in AML via MDM2 and MDM4 overexpression, as well as by TP53 mutations/deletions. Overexpression of these proteins can regulate p53 stabilization and lead to poor outcomes, regardless of TP53 mutational status.8 A previous study by Wong et al has revealed that TP53 mutants were selectively enriched in t-AML or therapy-related myelodysplastic syn-drome patients, but their results do not support the hypothesis that cytotoxic therapy is directly responsible for the induced induction of TP53 mutations.14 In addition, they used next-generation sequencing techniques to detect TP53 mutations in blood or bone marrow before any chemotherapy and demonstrated a potential mechanism whereby hematopoietic stem/progenitor cells with heterozygous TP53 mutations may have a competitive advantage in the presence of cytotoxic therapy. TP53 alterations are significantly associated with multiple risk factors, including older age, complex karyo-type, white blood counts, and specific DNA copy number alterations. In addition, multivariate analysis in these studies suggests that TP53 mutation was an important prognostic factor leading to a poor overall survival (OS) and disease-free survival (DFS) in AML patients.12,15,16 Elderly AML patients often have a TP53 mutation and genetic markers that are associated with reduced sensitivity of less respon-siveness to standard cytotoxic therapy which leads to poorer outcome.12,15–17 Welch et al reported that approximately 67% of patients with an unfavorable-risk cytogenetic profile and 100% of TP53 mutation AML patients were responsive to decitabine treatment, which seems to narrow the prognosis gap between patients with TP53 mutations and TP53 wild type.18 Their study suggested that the TP53 mutation can reliably predict the patient’s response to decitabine, and be a potential biomarker for AML individualized treatment.
Non-mutational inactivation of p53 is frequent in AML. This mechanism can be used for wild-type TP53 AML treatment and occurs via overexpression of MDM2 and MDM4.19,20 However, AML patients with mutated p53 were resistant to MDM2 inhibitor MI219. The treatment strategy of TP53 mutation AML was consequently different from
TP53 wild-type AML.21 It is therefore necessary to
investi-gate the difference between the TP53 mutation AML and the associated wild type. According to previous studies, TP53 high-frequency mutations reported in AML patients can be used as a prediction factor for prognosis and individualized treatment options. However, the TP53 mutation’s occurrence and the changes in biological processes they cause, remain unclear. In the present study, an RNA sequencing (RNA-Seq) dataset of adult de novo AML was employed to identify the key pathways and genes associated with TP53 mutations using bioinformatics analysis approaches.
Materials and methods
rna-seq data
An RNA-Seq dataset of adult AML, which included human AML patients’ whole transcriptome sequencing dataset and corresponding survival profiles, was download from The Cancer Genome Atlas (TCGA) database (https://gdc-portal. nci.nih.gov/).10 All of the AML patients in TCGA were adult de novo AML patients and the sequencing dataset came from bone marrow tissue analyses at diagnosis. The corresponding information related to patients with TP53 mutation was obtained from the cBioPortal for Cancer Genomics website (http://www.cbioportal.org/index.do).22,23
gene set enrichment analysis (gsea)
To investigate the effect of TP53 mutations on various biological function gene sets in adult AML patients, dif-ferences in gene mRNA expression levels of biological functional annotation and pathways between TP53 muta-tion and wild-type patients were analyzed by GSEA v2-2.2.3 (http://software.broadinstitute.org/gsea/downloads. jsp). Reference gene sets from the Molecular Signatures Database (MSigDB) of c2 (c2.cp.kegg.v5.2.symbols.gmt) and c5 (c5.bp.v5.2.symbols.gmt; c5.mf.v5.2.symbols.gmt; c5.cc.v5.2.symbols.gmt; consist of genes annotated by the same GO terms),24,25 respectively. The MSigDB of c2 is a pathway gene set, which was curated from publications and extracted from canonical pathways and experimental signatures, whereas the MSigDB of c5 was constructed on genes annotated by the same GO terms.26 The number of permutations was set at 1,000. Enrichment results satisfying a nominal P-value cutoff of ,0.05 with a false discovery rate (FDR) ,0.25 were considered statistically significant.
Identification of differentially expressed
genes (Degs)
EdgeR, an R package for examining differential expression of RNA-Seq count data, was used according to the user’s guide
OncoTargets and Therapy downloaded from https://www.dovepress.com/ by 118.70.13.36 on 25-Aug-2020
Dovepress Key pathways and genes in TP53 mutation aMl
for screening differential expression of genes at gene levels between TP53 mutation and wild-type AML patients.27,28 DEGs were identified with the following criterion: |log2 fold change (FC)| $2; both the P-value and FDR ,0.05. The DEGs were used for further bioinformatics analysis. A heat map and volcano plot of the DEGs were drawn via the ggplots package in the R platform.
Functional annotation and pathway
enrichment analysis of DEGs
Database for Annotation, Visualization, and Integrated Discovery (DAVID) v.6.8 (https://david.ncifcrf.gov/tools.jsp) was used to annotate input genes, classify gene functions, identify gene conversions, and carry out gene ontology (GO) term analysis.29 To identify the DEGs’ functional annotation, we analyzed GO terms and Kyoto Encyclopedia of Genes and Genomes (KEGG) pathway enrichment with DAVID, while specifying a P-value ,0.05 for statistical significance.
Protein–protein interactions (PPi)
network and module analysis
The Search Tool for the Retrieval of Interacting Genes/ Proteins (STRING) database (http://string.embl.de/), which provides a critical assessment and integration of PPI,30 was used to assess the direct (physical) and indirect (functional) associations of DEGs. Interactive relationships among DEGs with an interaction score .0.4 was considered statistically significant. The PPI network was then used for module screening by Molecular Complex Detection (MCODE) (scores .3 and nodes .4) in Cytoscape, a bioinformatics integration platform.31 Furthermore, we also analyzed the GO terms and KEGG pathway enrichment for DEGs in the top three modules, respectively.
statistical analysis
The Student’s t-test was used to compare the TP53 mRNA expression level between TP53 mutation and wild-type AML bone marrow tissue. The Kaplan–Meier method with log-rank test was used for calculating the clinical outcome between different gene expression groups. HR and the 95% CIs were calculated from the Cox proportional hazards regression model. FDR in edgeR and GSEA were adjusted for multiple testing with the Benjamini–Hochberg procedure to control FDR, respectively.32–34 A value of P,0.05 was considered statistically significant. All the statistical analyses were conducted with SPSS version 20.0 (IBM Corporation, Armonk, NY, USA) and R 3.3.0.
Results
Data source
Information for 151 patients with adult de novo AML and corresponding bone marrow RNA-Seq dataset were obtained from TCGA database. A total of 140 patients with complete follow-up profiles were available. There were eleven AML patients (7%) with TP53 mutations and the rest were TP53 wild type, these data were obtained from the cBioPortal for Cancer Genomics website.
gsea
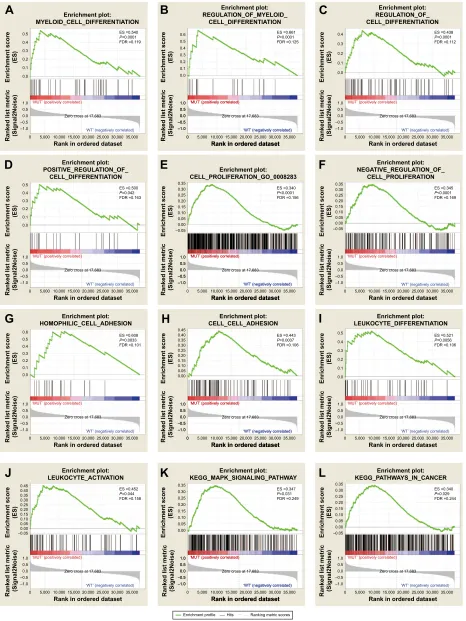
To investigate the effect of TP53 mutations on the prog-nosis of AML patients, the effects of TP53 mutations on various biological functional gene sets were analyzed by the GSEA approach. The GSEA results are shown in Figure 1 and Table S1. In the GSEA analysis of GO enrich-ment (Figure 1A–J), biological processes pertaining to posi-tive regulation of cell differentiation, regulation of myeloid cell differentiation, negative regulation of cell proliferation, leukocyte differentiation and activation, and cell adhesion, were significantly enriched. This suggests that TP53 muta-tions may contribute to disease progression and affect prog-nosis by influencing cell differentiation, proliferation, and cell adhesion in AML patients. However, the GO enrichment analysis of molecular function was significantly enriched in receptor signaling proteins, serine-threonine kinase activity, and protein tyrosine kinase activity. Furthermore, the cellular component was enriched for adherens junction and cell fraction. In the GSEA analysis of KEGG pathways, the TP53 mutation group was associated with the MAPK signaling pathway and pathways in cancer (Figure 1K–L).
Identification of DEGs
Overall, RNA-Seq datasets from eleven TP53 mutation-bearing and 140 TP53 wild-type AML patients were used for DEG screening. The criteria of the DEGs were set as follows: i) |log2 FC| $2; ii) both the P-value and FDR value of edgeR ,0.05. A total of 1,287 DEGs met the criteria, of which, 1,067 were upregulated and 220 were downregu-lated (Table S2). The volcano plot of the DEGs is shown in Figure 2, while the heat map is shown in Figure S1.
GO and KEGG of DEGs
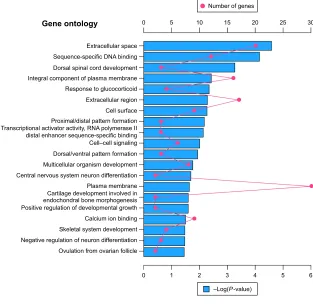
Altogether, 220 downregulated and 1,067 upregulated DEGs were submitted for further GO and KEGG pathway analyses with DAVID, respectively. The GO analysis of downregu-lated DEGs (Figure 3) suggested significant enrichment in skeletal system development, cartilage development involved in endochondral bone morphogenesis, central nervous
OncoTargets and Therapy downloaded from https://www.dovepress.com/ by 118.70.13.36 on 25-Aug-2020
Dovepress
huang et al
Figure 1 GSEA results of TP53 mutations in aMl patients.
Note: Results are shown for c5 (A–J) and c2 (K, L) reference gene sets.
Abbreviations: GSEA, gene set enrichment analysis; AML, acute myeloid leukemia; FDR, false discovery rate; GO, gene ontology; KEGG, Kyoto Encyclopedia of Genes and genomes. (6 3 )'5 (QULFKPHQWVFRUH (6 ± ± 5DQNLQRUGHUHGGDWDVHW 5DQNHGOLVWPHWULF 6LJQDO1RLVH µ087¶SRVLWLYHO\FRUUHODWHG µ:7¶QHJDWLYHO\FRUUHODWHG =HURFURVVDW (6 3 )'5 (QULFKPHQWSORW 326,7,9(B5(*8/$7,21B2)B &(//B',))(5(17,$7,21 (QULFKPHQWVFRUH (6 ± ± 5DQNLQRUGHUHGGDWDVHW 5DQNHGOLVWPHWULF 6LJQDO1RLVH µ087¶SRVLWLYHO\FRUUHODWHG µ:7¶QHJDWLYHO\FRUUHODWHG =HURFURVVDW (QULFKPHQWVFRUH (6 ± ± 5DQNLQRUGHUHGGDWDVHW 5DQNHGOLVWPHWULF 6LJQDO1RLVH µ087¶SRVLWLYHO\FRUUHODWHG µ:7¶QHJDWLYHO\FRUUHODWHG =HURFURVVDW (6 3 )'5 ± ± 5DQNLQRUGHUHGGDWDVHW (QULFKPHQWSORW 5(*8/$7,21B2)B0<(/2,'B &(//B',))(5(17,$7,21 (QULFKPHQWSORW 5(*8/$7,21B2)B &(//B',))(5(17,$7,21 (QULFKPHQWSORW 0<(/2,'B&(//B',))(5(17,$7,21 µ087¶SRVLWLYHO\FRUUHODWHG µ:7¶QHJDWLYHO\FRUUHODWHG ± ± (6 3 )'5 (QULFKPHQWSORW &(//B352/,)(5$7,21B*2B (QULFKPHQWVFRUH (6 ± ± 5DQNLQRUGHUHGGDWDVHW 5DQNHGOLVWPHWULF 6LJQDO1RLVH µ087¶SRVLWLYHO\FRUUHODWHG µ:7¶QHJDWLYHO\FRUUHODWHG =HURFURVVDW ± ± 5DQNLQRUGHUHGGDWDVHW µ087¶SRVLWLYHO\FRUUHODWHG µ:7¶QHJDWLYHO\FRUUHODWHG (6 3 )'5 (QULFKPHQWVFRUH (6 ± ± 5DQNLQRUGHUHGGDWDVHW 5DQNHGOLVWPHWULF 6LJQDO1RLVH µ087¶SRVLWLYHO\FRUUHODWHG µ:7¶QHJDWLYHO\FRUUHODWHG =HURFURVVDW (6 3 )'5 (QULFKPHQWSORW 1(*$7,9(B5(*8/$7,21B2)B &(//B352/,)(5$7,21 (QULFKPHQWVFRUH (6 ± ± 5DQNLQRUGHUHGGDWDVHW 5DQNHGOLVWPHWULF 6LJQDO1RLVH µ087¶SRVLWLYHO\FRUUHODWHG µ:7¶QHJDWLYHO\FRUUHODWHG =HURFURVVDW
$
%
&
'
(
)
(6 3 )'5 (QULFKPHQWSORW +2023+,/,&B&(//B$'+(6,21 (QULFKPHQWVFRUH (6 ± ± 5DQNLQRUGHUHGGDWDVHW 5DQNHGOLVWPHWULF 6LJQDO1RLVH µ087¶SRVLWLYHO\FRUUHODWHG µ:7¶QHJDWLYHO\FRUUHODWHG =HURFURVVDW (6 3 )'5 (QULFKPHQWSORW /(8.2&<7(B$&7,9$7,21 (QULFKPHQWVFRUH (6 ± ± 5DQNLQRUGHUHGGDWDVHW 5DQNHGOLVWPHWULF 6LJQDO1RLVH µ087¶SRVLWLYHO\FRUUHODWHG µ:7¶QHJDWLYHO\FRUUHODWHG =HURFURVVDW (6 3 )'5 (QULFKPHQWSORW &(//B&(//B$'+(6,21 (QULFKPHQWVFRUH (6 ± ± 5DQNLQRUGHUHGGDWDVHW 5DQNHGOLVWPHWULF 6LJQDO1RLVH µ087¶SRVLWLYHO\FRUUHODWHG µ:7¶QHJDWLYHO\FRUUHODWHG =HURFURVVDW ± ± 5DQNLQRUGHUHGGDWDVHW µ087¶SRVLWLYHO\FRUUHODWHG µ:7¶QHJDWLYHO\FRUUHODWHG (6 3 )'5 (QULFKPHQWSORW .(**B0$3.B6,*1$/,1*B3$7+:$< (QULFKPHQWVFRUH (6 ± ± 5DQNLQRUGHUHGGDWDVHW 5DQNHGOLVWPHWULF 6LJQDO1RLVH µ087¶SRVLWLYHO\FRUUHODWHG µ:7¶QHJDWLYHO\FRUUHODWHG =HURFURVVDW ± ± 5DQNLQRUGHUHGGDWDVHW µ087¶SRVLWLYHO\FRUUHODWHG µ:7¶QHJDWLYHO\FRUUHODWHG (6 3 )'5 (QULFKPHQWSORW /(8.2&<7(B',))(5(17,$7,21 (QULFKPHQWVFRUH (6 ± ± 5DQNLQRUGHUHGGDWDVHW 5DQNHGOLVWPHWULF 6LJQDO1RLVH µ087¶SRVLWLYHO\FRUUHODWHG µ:7¶QHJDWLYHO\FRUUHODWHG =HURFURVVDW (QULFKPHQWSORW .(**B3$7+:$<6B,1B&$1&(5 (QULFKPHQWVFRUH (6 ± ± 5DQNLQRUGHUHGGDWDVHW 5DQNHGOLVWPHWULF 6LJQDO1RLVH*
+
,
-
.
/
± µ087¶SRVLWLYHO\FRUUHODWHG =HURFURVVDW (6 3 )'5 µ:7¶QHJDWLYHO\FRUUHODWHG ±(QULFKPHQWSURILOH +LWV 5DQNLQJPHWULFVFRUHV
OncoTargets and Therapy downloaded from https://www.dovepress.com/ by 118.70.13.36 on 25-Aug-2020
Dovepress Key pathways and genes in TP53 mutation aMl
system neuron differentiation, negative regulation of neuron differentiation, cell–cell signaling, multicellular organism development, and positive regulation of developmental growth. However, with regard to molecular function and cellular components, DEGs were significantly enriched in extracellular space, sequence-specific DNA binding, transcriptional activator activity, RNA polymerase II distal enhancer sequence-specific binding, and calcium ion binding. No pathways were significantly enriched in the KEGG enrichment analysis of downregulated DEGs.
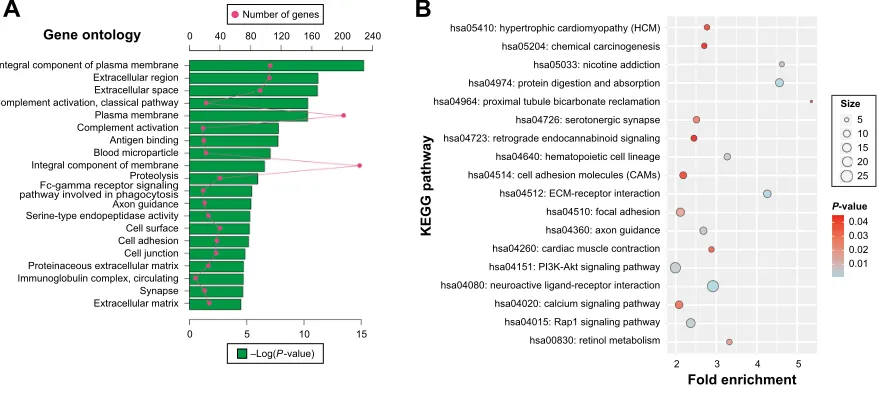
GO and KEGG analysis was also carried out for upregu-lated DEGs. The upreguupregu-lated DEGs were significantly enriched in proteolysis, complement activation, cell adhesion, and Fc-gamma receptor signaling pathway involved in phagocytosis biological process (Figure 4A). Cellular component enrichment suggests that upregulated DEGs were significantly enriched in extracellular region, proteina-ceous extracellular matrix, immunoglobulin complex, and circulating and blood microparticle. Whereas, molecular function was enriched in antigen binding and serine-type endopeptidase activity (Figure 4A). In KEGG pathway analysis, upregulated DEGs were significantly enriched in
Figure 2 Volcano plot for differentially expressed genes.
Notes: Red: non-differentially expressed genes; green: differentially expressed genes. Abbreviation: FDR, false discovery rate.
±
/RJIROGFKDQJH
±/RJ)'5
9ROFDQRSORW 7KUHVKROG
)DOVH 7UXH
Figure 3 The top 20 GO enrichment terms of downregulated differentially expressed genes.
Notes: The red dot in the figure means number of genes; the blue bar chart represents the -log(P-value) of the GO term. Abbreviation: gO, gene ontology.
*HQHRQWRORJ\
([WUDFHOOXODUVSDFH
([WUDFHOOXODUUHJLRQ
3UR[LPDOGLVWDOSDWWHUQIRUPDWLRQ
'RUVDOYHQWUDOSDWWHUQIRUPDWLRQ
2YXODWLRQIURPRYDULDQIROOLFOH 1HJDWLYHUHJXODWLRQRIQHXURQGLIIHUHQWLDWLRQ 6NHOHWDOV\VWHPGHYHORSPHQW &DOFLXPLRQELQGLQJ 3RVLWLYHUHJXODWLRQRIGHYHORSPHQWDOJURZWK &DUWLODJHGHYHORSPHQWLQYROYHGLQ HQGRFKRQGUDOERQHPRUSKRJHQHVLV 3ODVPDPHPEUDQH &HQWUDOQHUYRXVV\VWHPQHXURQGLIIHUHQWLDWLRQ 0XOWLFHOOXODURUJDQLVPGHYHORSPHQW &HOO±FHOOVLJQDOLQJ 7UDQVFULSWLRQDODFWLYDWRUDFWLYLW\51$SRO\PHUDVH,, GLVWDOHQKDQFHUVHTXHQFHVSHFLILFELQGLQJ &HOOVXUIDFH 5HVSRQVHWRJOXFRFRUWLFRLG ,QWHJUDOFRPSRQHQWRISODVPDPHPEUDQH 'RUVDOVSLQDOFRUGGHYHORSPHQW 6HTXHQFHVSHFLILF'1$ELQGLQJ
±/RJ3YDOXH 1XPEHURIJHQHV
OncoTargets and Therapy downloaded from https://www.dovepress.com/ by 118.70.13.36 on 25-Aug-2020
Dovepress
huang et al
extracellular matrix (ECM)-receptor interaction, Rap1 signal-ing pathway, PI3K-AKT signalsignal-ing pathway, hematopoietic cell lineage, calcium signaling pathway, cell adhesion mol-ecules, and chemical carcinogenesis (Figure 4B).
PPI network and module analysis
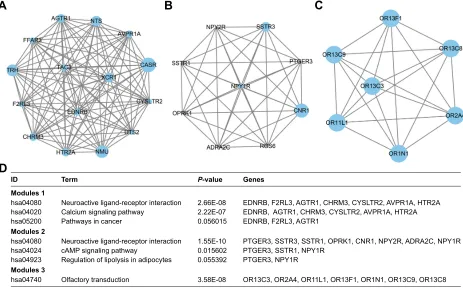
To investigate the interaction and hub genes of DEGs, protein–protein interactomes were constructed using STRING (Figure S2). The top ten genes ranked by degree were iden-tified as hub genes. These hub genes included CDH1, also known as E-cadherin, BMP2, KDR, LEP, CASR, ITGA2B, APOE, MNX1, NMU, and TRH. CDH1 had the highest degree of nodes among the hub genes with 34. Modules of genes in PPI network were identified by the MCODE plugin in Cytoscape. The top three significant modules were selected for GO term and KEGG pathway enrichment analysis (Table S3 and Figure 5A–D, respectively). KEGG pathway enrichment by DAVID suggested that the top three module genes were mainly related to neuroactive ligand-receptor interactions, calcium signaling pathway, cAMP signaling pathway, and olfactory transduction pathways. Functional annotation in module 1 genes was enriched in the integral component of plasma membrane, phospholipase C-activating G-protein coupled receptor (PLC-activating GPCR) signaling pathway, positive regulation of cytosolic calcium ion concentration, and G-protein coupled receptor (GPCR) signaling pathway. The genes of module 2 were mainly enriched in the integral component of plasma membrane, GPCR signaling pathway, coupled to cyclic nucleotide second messenger, adenylate
cyclase-inhibiting G-protein coupled receptor signaling pathway, somatostatin signaling pathway, and cell–cell signaling. In addition, GO term enrichment of module 3 genes was also associated with olfactory receptor activity, G-protein coupled receptor activity, and the G-protein coupled receptor signaling pathway (Table S3).
survival analysis
In this study, we observed that TP53 mRNA expression was similar between TP53 mutation and wild-type patients’ bone marrow tissue (Figure 6A). Overall, 151 patients with a 7.3% lost follow-up rate were included in the survival analysis. A total of 87 (57.6%) patients died before the last follow-up date with a median survival time (MST) of 19 months. OS analysis for AML patients grouped by TP53 mutation revealed that AML patients with TP53 mutations had a shorter MST than those without TP53 mutations (TP53 mutations vs TP53 wild type, 31 days vs 608 days, log-rank P,0.0001). Univariate Cox proportional hazards regression analysis also suggested that TP53 mutations were significantly associated with a poor clinical outcome and an increased risk of death, compared to those patients without TP53 mutations (P,0.0001, HR =4.510, 95% CI =2.266–8.979, Figure 6B).
Discussion
AML is characterized by proliferative, clonal, abnormally differentiated, and occasionally poorly differentiated cells of the hematopoietic system, which infiltrate the bone marrow,
Figure 4 DAVID enrichment results of upregulated differentially expressed genes.
Notes: (A) The top 20 GO enrichment terms of upregulated differentially expressed genes. (B) The KEGG enrichment pathways of upregulated differentially expressed genes. red dot in (A) means number of genes; green bar chart in (A) means the -log(P-value) of the GO term. The “size” in (B) means number of genes.
Abbreviations: DAVID, Database for Annotation, Visualization, and Integrated Discovery; GO, gene ontology; KEGG, Kyoto Encyclopedia of Genes and Genomes; ecM, extracellular matrix.
*HQHRQWRORJ\
,QWHJUDOFRPSRQHQWRISODVPDPHPEUDQH ([WUDFHOOXODUUHJLRQ ([WUDFHOOXODUVSDFH &RPSOHPHQWDFWLYDWLRQFODVVLFDOSDWKZD\ 3ODVPDPHPEUDQH &RPSOHPHQWDFWLYDWLRQ $QWLJHQELQGLQJ %ORRGPLFURSDUWLFOH ,QWHJUDOFRPSRQHQWRIPHPEUDQH 3URWHRO\VLV )FJDPPDUHFHSWRUVLJQDOLQJ SDWKZD\LQYROYHGLQSKDJRF\WRVLV $[RQJXLGDQFH 6HULQHW\SHHQGRSHSWLGDVHDFWLYLW\ &HOOVXUIDFH &HOODGKHVLRQ &HOOMXQFWLRQ 3URWHLQDFHRXVH[WUDFHOOXODUPDWUL[ ,PPXQRJOREXOLQFRPSOH[FLUFXODWLQJ 6\QDSVH ([WUDFHOOXODUPDWUL[
)ROGHQULFKPHQW
.(**SDWKZD\
6L]H
3YDOXH
KVDK\SHUWURSKLFFDUGLRP\RSDWK\+&0 KVDFKHPLFDOFDUFLQRJHQHVLV KVDQLFRWLQHDGGLFWLRQ KVDSURWHLQGLJHVWLRQDQGDEVRUSWLRQ KVDSUR[LPDOWXEXOHELFDUERQDWHUHFODPDWLRQ KVDVHURWRQHUJLFV\QDSVH KVDUHWURJUDGHHQGRFDQQDELQRLGVLJQDOLQJ KVDKHPDWRSRLHWLFFHOOOLQHDJH KVDFHOODGKHVLRQPROHFXOHV&$0V KVD(&0UHFHSWRULQWHUDFWLRQ KVDIRFDODGKHVLRQ KVDD[RQJXLGDQFH KVDFDUGLDFPXVFOHFRQWUDFWLRQ KVD3,.$NWVLJQDOLQJSDWKZD\ KVDQHXURDFWLYHOLJDQGUHFHSWRULQWHUDFWLRQ KVDFDOFLXPVLJQDOLQJSDWKZD\ KVD5DSVLJQDOLQJSDWKZD\ KVDUHWLQROPHWDEROLVP
$
%
±/RJ3YDOXH 1XPEHURIJHQHV
OncoTargets and Therapy downloaded from https://www.dovepress.com/ by 118.70.13.36 on 25-Aug-2020
Dovepress Key pathways and genes in TP53 mutation aMl
blood, and other tissues.35 AML differentiation can be induced by ATP depletion and the subsequent activation of DNA damage signaling via the ATR/Chk1-dependent and p53-independent pathway.36 p53 tumor suppressive function limits proliferation in response to cellular stress, whereas p53 inactivation enhances proliferation of myeloid progenitor cells in combination with aberrant self-renewal to
promote AML.37 TP53 mutations, which cause p53 suppres-sive function and p53 pathway dysfunction, affect AML cell differentiation and proliferation. Hepatocyte growth factor promotes proliferation, invasion, and metastasis of AML cells by regulating the PI3K-Akt and MAPK/ERK signaling pathway.38 In addition, drug resistance of AML stem cells can be modulated by survivin expression via the MAPK signaling
Figure 5 Top three modules from the PPI network.
Notes: (A) PPI network of module 1; (B) PPI network of module 2; (C) PPI network of module 3; (D) enrichment pathways of the top three modules. The different protein sizes in the network imply the degree of specific gene in the PPI network.
Abbreviation: PPi, protein–protein interactions. ,'
0RGXOHV KVD 0RGXOHV KVD KVD KVD 0RGXOHV KVD KVD KVD
7HUP
2OIDFWRU\WUDQVGXFWLRQ
1HXURDFWLYHOLJDQGUHFHSWRULQWHUDFWLRQ &DOFLXPVLJQDOLQJSDWKZD\
3DWKZD\VLQFDQFHU
1HXURDFWLYHOLJDQGUHFHSWRULQWHUDFWLRQ F$03VLJQDOLQJSDWKZD\
5HJXODWLRQRIOLSRO\VLVLQDGLSRF\WHV
25&25$25/25)25125&25& ('15%)5/$*75&+50&<6/75$935$+75$ ('15%$*75&+50&<6/75$935$+75$ ('15%)5/$*75
37*(566756675235.&1513<5$'5$&13<5 37*(5667513<5
37*(513<5 *HQHV
3YDOXH
( ( (
(
$
'
%
&
Figure 6 The comparison of mRNA expression and survival between AML patients with TP53 mutation and wild type.
Notes: (A) The mRNA expression of the TP53 gene in aMl patients’ bone marrow tissue between TP53 with mutations and the wild type; (B) Kaplan–Meier survival curves for AML patients stratified by TP53 mutation.
Abbreviation: AML, acute myeloid leukemia.
73
ZLOGW\SH PXWDWLRQ73
3
73P51$
H[SUHVVLRQOHYHO
/RJUDQN3
+5 ± Q
Q
3HUFHQWVXUYLYDO
2YHUDOOVXUYLYDOGD\V
73PXWDWLRQ 73ZLOGW\SH
$
%
OncoTargets and Therapy downloaded from https://www.dovepress.com/ by 118.70.13.36 on 25-Aug-2020
Dovepress
huang et al
pathway.39 GSEA analysis in the present study suggests that TP53 mutations were significantly associated with the regulation of cell differentiation, especially for myeloid cell differentiation, negative regulation of cell proliferation, cell adhesion, and leukocyte differentiation and activation.
The GO term analysis indicated that downregulated DEGs in TP53 mutation AML patients were related to biological processes of cell differentiation and development. The GO term enrichment analysis suggests that upregulated DEGs were related to complement activation, and cell adhesion biological processes. The KEGG enrichment analysis implies that ECM-receptor interaction, the Rap1 signaling pathway, PI3K-Akt signaling pathway, calcium signaling pathway, and cell adhesion molecules were significantly enriched in upregulated DEGs’ pathways.
ECM-receptor interaction and cell adhesion molecule signaling pathways were mainly involved in cell adhesion, and the genes in those enrichments included genes involved with the vascular cell adhesion molecule, cadherin and integrin family (VCAM1, ITGB3, ITGBL1, ITGA2B, CDH1). Cell–cell and cell–matrix interactions are mainly mediated by adhesion molecules including those of the selectin, integrin, and cadherin families. In addition, the integrin family proteins mainly mediate the interaction between cells and the matrix, whereas, the calcium family proteins are mainly involved in the adhesion between homogeneous cells.40,41 These adhesion molecules have been demonstrated to be involved in intercel-lular and intracelintercel-lular signaling, and through the regulation of the cell cycle and apoptosis, affect response to antitumor therapy and result in drug resistance.42–45 Evidence shows that anti-adhesion therapy can improve tumor cell resistance to some extent, restore the sensitivity of tumor cells to che-motherapeutic drugs, and have synergistic and sensitization effects in traditional chemotherapy.46,47 Combretastatins cause the downregulation of bone marrow endothelial cell (BMEC) adhesion molecules VCAM-1 and VE-cadherin, then promote BMECs to enter G2/M of the cell cycle. Furthermore, when combined with combretastatin, cytotoxic chemotherapy can significantly induce AML cell death.48 AML cells carrying TP53 mutations are highly resistant to drugs, which subsequently lead to recurrence.49 Our results suggest that the upregulation of cell adhesion molecules and pathways may be the cause of the high drug resistance found in TP53 mutation AML patients.
Rap1 is a small GTPase that controls multiple processes, including cell adhesion, cell–cell junction formation, and cell polarity. Rap1 plays a dominant role in the control of cell–cell and cell–matrix interactions by regulating the func-tion of integrins and other cell adhesion molecules in various
cell types.50–52 Our present study shows that cell adhesion (ITGA2B, ITGB3, CDH1) and KDR genes were enriched in this pathway and, hence, implies that this pathway mainly involves cell adhesion in AML. Rap1GAP expression was lower in AML patients compared to normal subjects, upregu-lated Rap1GAP promotes leukemia cell differentiation and apoptosis, but increases leukemia cell invasion due to MMP9 overexpression.53
The PI3K-Akt signaling pathway can be activated by many types of cellular stimuli or toxic insults and regulates cancer cell transcription, translation, proliferation, growth, and survival. Uncontrolled activation of the PI3K/Akt pathway confers resistance to chemotherapy in vitro and in vivo, thus, inhibition of Akt activation is an attractive strategy for cancer treatment.54,55 The PI3K/Akt/mTOR sig-naling pathway is actively sustained in AML patients, and subsequently affects survival, proliferation, and the drug-resistance of leukemic cells.56 PI3Kδ and PI3Kγ inhibitor and knockdown experiments suggest that inhibition of PI3Kδ and PI3Kγ has an anti-adhesion, anti-proliferative, and anti-migration effect on AML cells.57 A recent study by Liang et al also demonstrated that PI3K/AKT pathways were upregulated in AML refractory/relapse patients, and inhibition of the PI3K/AKT pathway via GLI1 led to enhanced AML drug sensitivity.58 PI3K/Akt inhibition by wortmannin upregulated the p53 protein in AML patients, whereas, p53 inactivation was associated with PI3K/Akt activation in MDM2 phosphorylation, and subsequently increased MRP1 expression, which is an important drug resistance mechanism via MRP1 overexpression.59 Wang et al revealed that adhesion-dependent activation via PI3K/Akt pathway upregulation of an X-linked inhibitor of the apoptosis protein may be involved in the cell adhesion-mediated drug resistance of U937 cells, a human AML cell line.60 It is worth noting that PI3K/Akt was activated in AML patients and that it regulates drug resistance in a variety of ways. However, cell adhesion-mediated drug resistance also plays an important role in the drug resistance of AML. Based on the annotation of the KEGG website (http://www. kegg.jp/), the Rap1 signaling pathway (hsa04015) partici-pated in PI3K/AKT pathway regulation and correlated to cell adhesion, survival, and proliferation. However, the PI3K/Akt pathway (hsa04151) was also associated with the adhesion, survival, cycle, and proliferation of cells. Increas-ing evidence suggests that the PI3K/Akt pathway affects the adhesion, cycle, proliferation, and migration of leukemic cells in AML, especially in connection with drug resistance. In our study, we found that upregulated genes were significantly enriched in the PI3K/Akt pathway in TP53 mutation AML,
OncoTargets and Therapy downloaded from https://www.dovepress.com/ by 118.70.13.36 on 25-Aug-2020
Dovepress Key pathways and genes in TP53 mutation aMl
which suggests that PI3K/Akt pathway activation may play a crucial role in TP53 mutation AML and can be used as a potential therapeutic target for multiple biological processes in TP53 mutation AML.
In PPI network analysis, we identified hub genes which consisted of the ten DEGs with the highest degree of interac-tion. The CDH1 gene, which encodes a classical cadherin of the cadherin superfamily and is a calcium-dependent cell–cell adhesion protein, had the highest degree of interaction among these hub genes. Evidence has shown that methylation of CDH1 was associated with unfavorable prognosis in AML, whereas, CDH1 downregulation led to markedly shorter OS and acted as an independent prognostic biomarker in cyto-genetic normal AML.61,62 The KDR gene was upregulated in refractory leukemia cells and initiates a PI3K-dependent clo-nogenic response in AML.63,64 The combination of systemic LEP level and local bone marrow stroma LEP production may affect leukemic hematopoiesis; furthermore, LEP acts as a growth factor and promotes cellular proliferation in
AML.65,66 A study by Ferguson et al has shown that MNX1
is frequently inactivated by epigenetic mechanisms and may play a dual role in the development of leukemia, as a tumor suppressor gene in acute lymphoid leukemia, but as an onco-gene in infant AML.67 The NMU gene was highly expressed in AML cells, and its silencing inhibits cell proliferation.68 In previous studies, there were no reports that the other five hub genes were correlated with AML. However, ITGA2B and BMP2 were associated with cancer cell adhesion and migration, as well as PI3K/AKT signaling.69,70
The significant GO term enrichments of the top three modules were associated with a variety of G-protein cou-pled receptor signaling pathways, a family of cell-surface proteins that play critical roles in regulating a variety of pathophysiological processes.70 The cAMP signaling path-way (hsa04024) was a significant enrichment pathpath-way of the top three modules that involve the PI3K/AKT pathway, cell proliferation, and apoptosis, annotated on KEGG website. Our study has shown that TP53 mutations were associ-ated with poor prognosis, consistent with previous studies. However, TP53 expression was similar between the TP53 wild-type and mutation patients. Due to the incomplete clinical information of AML from the TCGA database and the small sample size, further investigations are required to confirm our results.
Conclusion
The TP53 mutation frequency in the current study fits well with the previous studies. Our findings suggest that TP53 mutations promote poor OS in adult de novo AML patients,
consistent with previous studies. Multiple bioinformatics analysis results revealed that cell adhesion, differentiation, and proliferation may play a crucial role in TP53 mutation AML. Cell adhesion-related genes and pathways, including CDH1 gene, Rap1, and the PI3K-Akt pathway, which are associated with a drug resistance mechanism, may be the potential mechanism of drug resistance in TP53 mutation AML and will provide new targets and strategies for indi-vidualized treatment. However, further molecular biological experiments are required to confirm our findings. Additional findings obtained in our study are also worthy of further investigation.
Acknowledgments
This work was supported in part by the National Natural Science Foundation of China (81160075); Natural Science Foundation of Guangxi (0728124); Self-raised Scientific Research Fund of the Ministry of Health of Guangxi Province (Z2014035). The authors thank the contributors of The Cancer Genome Atlas (https://portal.gdc.cancer.gov/) and the cBioPortal for Cancer Genomics (http://www.cbioportal. org/index.do) for their contribution by sharing the AML dataset through open access. In addition, we would also like to acknowledge the helpful comments on this paper received from our reviewers.
Disclosure
The authors report no conflicts of interest in this work.
References
1. Yin Y, Stephen CW, Luciani MG, Fahraeus R. p53 Stability and activity is regulated by Mdm2-mediated induction of alternative p53 translation products. Nat Cell Biol. 2002;4(6):462–467.
2. Vousden KH, Prives C. Blinded by the light: the growing complexity of p53. Cell. 2009;137(3):413–431.
3. Brosh R, Rotter V. When mutants gain new powers: news from the mutant p53 field. Nat Rev Cancer. 2009;9(10):701–713.
4. Wang X, Sun Q. TP53 mutations, expression and interaction networks in human cancers. Oncotarget. 2017;8(1):624–643.
5. Lang GA, Iwakuma T, Suh YA, et al. Gain of function of a p53 hot spot mutation in a mouse model of Li-Fraumeni syndrome. Cell. 2004; 119(6):861–872.
6. Morton JP, Timpson P, Karim SA, et al. Mutant p53 drives metastasis and overcomes growth arrest/senescence in pancreatic cancer. Proc
Natl Acad Sci U S A. 2010;107(1):246–251.
7. Kim MP, Zhang Y, Lozano G. Mutant p53: multiple mechanisms define biologic activity in cancer. Front Oncol. 2015;5:249.
8. Quintas-Cardama A, Hu C, Qutub A, et al. p53 pathway dysfunction is highly prevalent in acute myeloid leukemia independent of TP53 mutational status. Leukemia. 2017;31(6):1296–1305.
9. Stolzel F, Pfirrmann M, Aulitzky WE, et al. Risk stratification using a new prognostic score for patients with secondary acute myeloid leukemia: results of the prospective AML96 trial. Leukemia. 2011; 25(3):420–428.
10. Cancer Genome Atlas Research Network, Ley TJ, Miller C, et al. Genomic and epigenomic landscapes of adult de novo acute myeloid leukemia. N Engl J Med. 2013;368(22):2059–2074.
OncoTargets and Therapy downloaded from https://www.dovepress.com/ by 118.70.13.36 on 25-Aug-2020
Dovepress
huang et al
11. Seifert H, Mohr B, Thiede C, et al. The prognostic impact of 17p (p53) deletion in 2272 adults with acute myeloid leukemia. Leukemia. 2009;23(4):656–663.
12. Hou HA, Chou WC, Kuo YY, et al. TP53 mutations in de novo acute myeloid leukemia patients: longitudinal follow-ups show the mutation is stable during disease evolution. Blood Cancer J. 2015;5:e331.
13. Nahi H, Lehmann S, Bengtzen S, et al. Chromosomal aberrations in 17p predict in vitro drug resistance and short overall survival in acute myeloid leukemia. Leuk Lymphoma. 2008;49(3):508–516.
14. Wong TN, Ramsingh G, Young AL, et al. Role of TP53 mutations in the origin and evolution of therapy-related acute myeloid leukaemia.
Nature. 2015;518(7540):552–555.
15. Rucker FG, Schlenk RF, Bullinger L, et al. TP53 alterations in acute myeloid leukemia with complex karyotype correlate with specific copy number alterations, monosomal karyotype, and dismal outcome.
Blood. 2012;119(9):2114–2121.
16. Ohgami RS, Ma L, Merker JD, et al. Next-generation sequencing of acute myeloid leukemia identifies the significance of TP53, U2AF1, ASXL1, and TET2 mutations. Mod Pathol. 2015;28(5):706–714. 17. Sallman DA, Komrokji R, Vaupel C, et al. Impact of TP53 mutation
variant allele frequency on phenotype and outcomes in myelodysplastic syndromes. Leukemia. 2016;30(3):666–673.
18. Welch JS, Petti AA, Miller CA, et al. TP53 and decitabine in acute myeloid leukemia and myelodysplastic syndromes. N Engl J Med. 2016; 375(21):2023–2036.
19. Tan BX, Khoo KH, Lim TM, Lane DP. High Mdm4 levels suppress p53 activity and enhance its half-life in acute myeloid leukaemia.
Oncotarget. 2014;5(4):933–943.
20. Samudio IJ, Duvvuri S, Clise-Dwyer K, et al. Activation of p53 signal-ing by MI-63 induces apoptosis in acute myeloid leukemia cells. Leuk
Lymphoma. 2010;51(5):911–919.
21. Long J, Parkin B, Ouillette P, et al. Multiple distinct molecular mecha-nisms influence sensitivity and resistance to MDM2 inhibitors in adult acute myelogenous leukemia. Blood. 2010;116(1):71–80.
22. Cerami E, Gao J, Dogrusoz U, et al. The cBio cancer genomics portal: an open platform for exploring multidimensional cancer genomics data.
Cancer Discov. 2012;2(5):401–404.
23. Gao J, Aksoy BA, Dogrusoz U, et al. Integrative analysis of complex cancer genomics and clinical profiles using the cBioPortal. Sci Signal. 2013;6(269):pl1.
24. Subramanian A, Tamayo P, Mootha VK, et al. Gene set enrichment analysis: a knowledge-based approach for interpreting genome-wide expression profiles. Proc Natl Acad Sci U S A. 2005;102(43): 15545–15550.
25. Mootha VK, Lindgren CM, Eriksson KF, et al. PGC-1alpha-responsive genes involved in oxidative phosphorylation are coordinately down-regulated in human diabetes. Nat Genet. 2003;34(3):267–273. 26. Liberzon A, Birger C, Thorvaldsdottir H, Ghandi M, Mesirov JP,
Tamayo P. The Molecular Signatures Database (MSigDB) hallmark gene set collection. Cell Syst. 2015;1(6):417–425.
27. Robinson MD, McCarthy DJ, Smyth GK. edgeR: a Bioconductor pack-age for differential expression analysis of digital gene expression data.
Bioinformatics. 2010;26(1):139–140.
28. McCarthy DJ, Chen Y, Smyth GK. Differential expression analysis of multifactor RNA-Seq experiments with respect to biological variation.
Nucleic Acids Res. 2012;40(10):4288–4297.
29. Huang da W, Sherman BT, Lempicki RA. Systematic and integrative analysis of large gene lists using DAVID bioinformatics resources.
Nat Protoc. 2009;4(1):44–57.
30. Szklarczyk D, Franceschini A, Wyder S, et al. STRING v10: protein-protein interaction networks, integrated over the tree of life. Nucleic
Acids Res. 2015;43(Database issue):D447–D452.
31. Bader GD, Hogue CW. An automated method for finding molecular complexes in large protein interaction networks. BMC Bioinformatics. 2003;4:2.
32. Benjamini Y, Hochberg Y. Controlling the false discovery rate: a practi-cal and powerful approach to multiple testing. J R Stat Soc Series B
Stat Methodol. 1995;57(1):289–300.
33. Reiner A, Yekutieli D, Benjamini Y. Identifying differentially expressed genes using false discovery rate controlling procedures. Bioinformatics. 2003;19(3):368–375.
34. Benjamini Y, Drai D, Elmer G, Kafkafi N, Golani I. Controlling the false discovery rate in behavior genetics research. Behav Brain Res. 2001; 125(1–2):279–284.
35. Dohner H, Weisdorf DJ, Bloomfield CD. Acute myeloid leukemia.
N Engl J Med. 2015;373(12):1136–1152.
36. Chakrabarti A, Gupta K, Sharma JP, et al. ATP depletion triggers acute myeloid leukemia differentiation through an ATR/Chk1 protein-dependent and p53 protein-inprotein-dependent pathway. J Biol Chem. 2012; 287(28):23635–23643.
37. Zhao Z, Zuber J, Diaz-Flores E, Lintault L, Kogan SC, Shannon K, Lowe SW. p53 loss promotes acute myeloid leukemia by enabling aberrant self-renewal. Genes Dev. 2010;24(13):1389–1402.
38. Guo JR, Li W, Wu Y, et al. Hepatocyte growth factor promotes pro-liferation, invasion, and metastasis of myeloid leukemia cells through PI3K-AKT and MAPK/ERK signaling pathway. Am J Transl Res. 2016;8(9):3630–3644.
39. Zhang Y, Chen HX, Zhou SY, et al. Sp1 and c-Myc modulate drug resis-tance of leukemia stem cells by regulating survivin expression through the ERK-MSK MAPK signaling pathway. Mol Cancer. 2015;14:56. 40. Katz AM, Rosenthal D, Sauder DN. Cell adhesion molecules. Structure,
function, and implication in a variety of cutaneous and other pathologic conditions. Int J Dermatol. 1991;30(3):153–160.
41. Albelda SM, Buck CA. Integrins and other cell adhesion molecules.
FASEB J. 1990;4(11):2868–2880.
42. Xu S, Yang Y, Dong L, et al. Construction and characteristics of an E-cadherin-related three-dimensional suspension growth model of ovarian cancer. Sci Rep. 2014;4:5646.
43. Dimanche-Boitrel MT, Genne P, Duchamp O, Chauffert B. Confluence dependent resistance (CDR) to doxorubicin and E-cadherin expression in murine mammary cells. Cancer Lett. 1994;85(2):171–176. 44. Frisch SM, Francis H. Disruption of epithelial cell-matrix interactions
induces apoptosis. J Cell Biol. 1994;124(4):619–626.
45. Elliott T, Sethi T. Integrins and extracellular matrix: a novel mecha-nism of multidrug resistance. Expert Rev Anticancer Ther. 2002;2(4): 449–459.
46. Moldenhauer G, Salnikov AV, Luttgau S, Herr I, Anderl J, Faulstich H. Therapeutic potential of amanitin-conjugated anti-epithelial cell adhe-sion molecule monoclonal antibody against pancreatic carcinoma.
J Natl Cancer Inst. 2012;104(8):622–634.
47. Glinsky GV. Apoptosis in metastatic cancer cells. Crit Rev Oncol
Hematol. 1997;25(3):175–186.
48. Bosse RC, Wasserstrom B, Meacham A, et al. Chemosensitizing AML cells by targeting bone marrow endothelial cells. Exp Hematol. 2016;44(5):363.e365–377.e365.
49. Zhang L, McGraw KL, Sallman DA, List AF. The role of p53 in myelo-dysplastic syndromes and acute myeloid leukemia: molecular aspects and clinical implications. Leuk Lymphoma. 2017;58(8):1777–1790. 50. Bos JL. Linking Rap to cell adhesion. Curr Opin Cell Biol. 2005;
17(2):123–128.
51. Mor A, Dustin ML, Philips MR. Small GTPases and LFA-1 reciprocally modulate adhesion and signaling. Immunol Rev. 2007;218:114–125. 52. Boettner B, Van Aelst L. Control of cell adhesion dynamics by Rap1
signaling. Curr Opin Cell Biol. 2009;21(5):684–693.
53. Qiu T, Qi X, Cen J, Chen Z. Rap1GAP alters leukemia cell differentiation, apoptosis and invasion in vitro. Oncol Rep. 2012;28(2):622–628. 54. Osaki M, Oshimura M, Ito H. PI3K-Akt pathway: its functions and
alterations in human cancer. Apoptosis. 2004;9(6):667–676. 55. West KA, Castillo SS, Dennis PA. Activation of the PI3K/Akt
pathway and chemotherapeutic resistance. Drug Resist Updat. 2002; 5(6):234–248.
OncoTargets and Therapy downloaded from https://www.dovepress.com/ by 118.70.13.36 on 25-Aug-2020
OncoTargets and Therapy
Publish your work in this journal
Submit your manuscript here: http://www.dovepress.com/oncotargets-and-therapy-journal OncoTargets and Therapy is an international, peer-reviewed, open access journal focusing on the pathological basis of all cancers, potential targets for therapy and treatment protocols employed to improve the management of cancer patients. The journal also focuses on the impact of management programs and new therapeutic agents and protocols on
patient perspectives such as quality of life, adherence and satisfaction. The manuscript management system is completely online and includes a very quick and fair peer-review system, which is all easy to use. Visit http://www.dovepress.com/testimonials.php to read real quotes from published authors.
Dovepress
Dove
press
Key pathways and genes in TP53 mutation aMl
56. Martelli AM, Evangelisti C, Chiarini F, McCubrey JA. The phosphati-dylinositol 3-kinase/Akt/mTOR signaling network as a therapeutic target in acute myelogenous leukemia patients. Oncotarget. 2010; 1(2):89–103.
57. Pillinger G, Loughran NV, Piddock RE, et al. Targeting PI3Kdelta and PI3Kgamma signalling disrupts human AML survival and bone marrow stromal cell mediated protection. Oncotarget. 2016;7(26): 39784–39795.
58. Liang H, Zheng QL, Fang P, et al. Targeting the PI3K/AKT pathway via GLI1 inhibition enhanced the drug sensitivity of acute myeloid leukemia cells. Sci Rep. 2017;7:40361.
59. Tazzari PL, Cappellini A, Ricci F, et al. Multidrug resistance-associated protein 1 expression is under the control of the phosphoinositide 3 kinase/Akt signal transduction network in human acute myelogenous leukemia blasts. Leukemia. 2007;21(3):427–438.
60. Wang X, Wang C, Qin YW, Yan SK, Gao YR. The association of up-regulation of X-linked inhibitor of apoptosis protein with cell adhesion-mediated drug resistance in U937 cells. Hematol Oncol. 2008; 26(1):21–26.
61. Shimamoto T, Ohyashiki JH, Ohyashiki K. Methylation of p15(INK4b) and E-cadherin genes is independently correlated with poor prognosis in acute myeloid leukemia. Leuk Res. 2005;29(6):653–659.
62. Zhang TJ, Zhou JD, Ma JC, et al. CDH1 (E-cadherin) expression independently affects clinical outcome in acute myeloid leukemia with normal cytogenetics. Clin Chem Lab Med. 2017;55(1):123–131.
63. Wang L, Zhang W, Ding Y, et al. Up-regulation of VEGF and its receptor in refractory leukemia cells. Int J Clin Exp Pathol. 2015;8(5): 5282–5290.
64. List AF, Glinsmann-Gibson B, Stadheim C, Meuillet EJ, Bellamy W, Powis G. Vascular endothelial growth factor receptor-1 and receptor-2 initiate a phosphatidylinositide 3-kinase-dependent clonogenic response in acute myeloid leukemia cells. Exp Hematol. 2004;32(6):526–535. 65. Yilmaz M, Kis C, Ceylan NO, et al. Serum leptin level in acute myeloid
leukemia patients. Hematology. 2008;13(1):21–23.
66. Kim JY, Park HK, Yoon JS, et al. Molecular mechanisms of cellular proliferation in acute myelogenous leukemia by leptin. Oncol Rep. 2010; 23(5):1369–1374.
67. Ferguson S, Gautrey HE, Strathdee G. The dual role of HLXB9 in leukemia. Pediatr Blood Cancer. 2011;56(3):349–352.
68. Shetzline SE, Rallapalli R, Dowd KJ, et al. Neuromedin U: a Myb-regulated autocrine growth factor for human myeloid leukemias. Blood. 2004;104(6):1833–1840.
69. Zheng Y, Wang X, Wang H, Yan W, Zhang Q, Chang X. Bone mor-phogenetic protein 2 inhibits hepatocellular carcinoma growth and migration through downregulation of the PI3K/AKT pathway. Tumour
Biol. 2014;35(6):5189–5198.
70. Zhao F, Li L, Guan L, Yang H, Wu C, Liu Y. Roles for GP IIb/IIIa and alphavbeta3 integrins in MDA-MB-231 cell invasion and shear flow-induced cancer cell mechanotransduction. Cancer Lett. 2014; 344(1):62–73.
OncoTargets and Therapy downloaded from https://www.dovepress.com/ by 118.70.13.36 on 25-Aug-2020