GSJ: Volume 7, Issue 4
,
April
2019, Online: ISSN 2320-9186
www.globalscientificjournal.com
DATA MINING CLASSIFICATION TECHNIQUES ON THE
ANALYSIS OF STUDENT’S PERFORMANCE.
Adelaja Oluwaseun Adebayo 1, Mani Shanker Chaubey 2
Department of System Programming, South Ural State University,
Chelyabinsk, Russia.
E-mail: 1 [email protected], 2 [email protected]
Abstract
Data mining involves the searching of large information of the data or records to discover patterns and
utilize these patterns in the prediction the future events. In most educational sectors such as high schools, polytechnics and universities; classification technique is a vital analytical mechanism in prediction of various
levels of accuracy. Classification is one of the methods in data mining for categorizing a particular group of items to targeted groups. Main goal of classification is to predict the nature of an items or data based on the available classes of items. Construction of the classification model always defined by the available training data
set. In this paper we will only discuss about the classification algorithms, although there are different types of algorithms available in data mining for the prediction of the future strategy for a business. The decision tree classification technique utilized in this work focused mainly on data of the student’s performance obtained in a
high school during a quiz using the KNIME tool.
1. Introduction
Classification is a process of determining classes of given objects based on their characteristics, where semantic of classes are known beforehand. Typical applications of data mining classification are: Credit or Loan Approval- if a client is the safe or risky; Spam detection- If a message is valid or suspicious; what treatment applies to a patient- If Treatment A is suitable or Treatment B is more preferable or Treatment C is ideal?; Web-page categorization- which category a web page belongs business, entertainment or education. Data mining is one important field that focuses on discovering the data set properties and also an analytical step of knowledge discovery in databases (KDD). Educational Data mining (EDM) is an important aspect of research that has assisted in the predicting of useful information obtained from the educational database which yields to an improvement in the performance and also enhances the possibilities of a better understanding of the students to have a better assessment of their learning process [1]. The modeling of user knowledge, user behavior and user experience is applied to EDM which is an aspect of data mining [2]. Classification is a process of assigning new entities to existing defined class by examining the entities features. Classification makes decision from unseen cases by building of past decisions [3]. Educational data mining uses many techniques such as k-nearest neighbor, linear regression analysis, naïve Bayes, neural networks, support vector machines, decision trees and many others [4]. The KNIME analytics platform which is open source software for creating data science applications and services; intuitive, open and continuously integrating new developments, it makes understanding data,designing data science workflows and reusable components accessible to everyone. KNIME integrates various components from machine learning and data mining via its modular pipelining concepts of
data [5].
1.1. Requirements of the Classification Techniques.
The basic requirements of classification techniques includes the construction of the model and the model usage. These requirements are defined explicitly.
1.2. Construction of the model
Figure.1: General Approach to Solve Problem Using the Classification Technique [6].
1.3.Model Usage
Classification of unknown objects is performed based on the constructed model.
Resultant class label compare with the class label of test sample.
Calculate the percentage of test sample and accuracy of model should be compare with training sample.
There are always differences between the test sample data and training sample data.
1.4. Prediction and Classification
Figure.2: Basic Data Mining tasks [7].
2. Decision Tree
The concept used in this work for the classification technique of the student’s mark is the decision tree. Decision tree is a tree like structure where internal node contains splits and splitting attributes [3]. It represents test on the attribute. Decision trees are usually constructed from the training data set while the test data set is used to test or validate the accuracy of the decision tree [8]. Decision tree is a flowchart-like tree structure which the following features [9]: (1) each internal node also referred to as the non-leaf node denotes a test on an attribute; (2) each branch represents an outcome of the test ; (3) each leaf node or terminal node holds class label ; (4) topmost node of the tree is the root node. The decision usually consists of the nodes that form a rooted tree, which means the directed tree with a node called root that has not incoming edges [10]. Decision tree model is depicted in Fig.3:
2.1.Related Work
Research was carried out with multiple performance indicators such as "the marks for the previous
semester"; "Test grades"; "Performances of the students in a seminar"; "Assignment"; "Students attendance";
"Practical Laboratory work"; "Students general proficiency" and "their concluding semester results" on a
group of 50 students who enrolled in a particular of course program me for 4 years which the ranges between
2007 through 2011 [11]. ID3 decision tree algorithm was used for the decision tree and also they employed
the if-then rules which will help the teachers and also the students for a better prediction of the student
performances at the end of the semester. The authors decided to select the ID3 decision tree for their data
mining techniques on the student's performance analysis in the course based on the reason that is a one of the
simplest decision tree learning algorithm. The author’s goal of this research was focused at the ease in the
identification of students who required special attention to drastically reduce the failure rate and adopt
strategic steps for the next semester to prevent the reoccurrence of failure in their performance [11].
In the article [12], these authors conducted data mining research by the naïve Bayes classification method on some sample data of student’s group in the Post Graduate Diploma in Computer Application (PGDCA) in Dr R.M.L. Awadh University, Faizabad, India. The naïve Bayes classification method (which is a probability classification technique that assumes that all attributes in a dataset are unique and independent from each other), they adapted was to analyze, classify, also to make predictions of the student’s score who performed brilliantly and those who are performed below standard. The research aim was to be able to predict and classify the student’s grades in the following year based on their performance in previous years, and this research was productive to the both the students and the teaching staff in the improvement of their future education.
In the article [13], a research conducted with sample of datasets based on the performance of 300 students which consists of 225 males and 75 females studying in a college affiliated to Punjab University of Pakistan. The simple linear regression analysis method was adopted in this work and it stated that factors like mother’s education and student’s family income were highly correlated with the academic performance of students.
In the article [15], the authors performed a comparative analysis to test multiple decision tree algorithms on dataset of educational performance of students for the purpose of classification. The research aim was to select the most suitable decision tree algorithms and how it can easier be utilized on this dataset. The Classification and Regression Tree (CART) decision method worked accurately and predicted without errors. They concluded that it is advisable to run test on the dataset with multiple classifiers at the first instance and after select the most précised results in order to decide the best classification method for any sample of dataset [15].
In article [16], the authors described data mining software that allows users to analyze dataset of distinct dimensions, group them and make summary of the relationships which were predicted and identified during the process of mining.
In the article [17], the C4.8 classification algorithm was applied to the database of student academic performance for the prediction and the faculty of information technology and computer science, Nile Valley University is the case study.
3. Implementation.
KNIME tool is used in the implementation of this research work. The classification method was
implemented to build a workflow that reads the school marks data from the file uploaded in KNIME; to build
a decision tree and display the results. The input data is named “result.csv” file, where each records denotes
some of the student’s result of the quiz, including their answers of the students, the remarks of the teacher
and the final marks. A file reader (which reads the result.csv) was created as a node and then results of the
student in the quiz were imported via the path to the tool KNIME as shown the Fig.4
After the process of importing the result in to the file reader, the file reader node is configured and
shows the yellow indicator which symbolizes that the data set is read by the node A. This is shown in Fig.5:
Figure.5: The Configured File Reader.
The file reader is then executed and the indictor color changes from yellow to green which means it is
ready to be linked to another node. Figure.6 shows this:
The class column named “FINAL RESULT” is examined and a new node B named the color Manager is created and it is used to distinguish the each results obtained in the class column. At this point, the color manager is just configured and not executed yet. Fig.7 show the categorize mark in the class column “FINAL RESULT” with distinct color identifier
Figure.7: The configured Color Manager.
The color manager is then activated and it changes to green color as shown in Fig. 8:
Figure.8: The activated color Manager.
The Decision tree learner is the used to classify these marks obtained. The decision tree learner uses decision tree as a predictive model to go from observations about an item (represented in the branches) to conclusions about the item's target value (represented in the leaves). It is one of the predictive modeling approaches used in statistics, data mining and machine learning. In the decision tree learning process, the datasets are classified by submitting it to a series of test that determines the class label the sample to produce an organized hierarchical structure called a decision tree [18]. The Decision tree learner is creates as node C and linked to the node B as shown in Fig. 9:
Figure.9: Decision Tree Learner configured to classify Final_Result.
The decision tree learner is activated based on the class column it is required to classify. This is shown in Fig.10:
Node D is finally created and named as the decision tree to image. The decision tree to image is node
repository that learns the decision tree on the data set and applies the model on a new data set, whereby the
distribution is previewed as images such as histogram depiction or any other pictorial representation [19].
The PMML reader of the decision tree learner node on the right side is connected to the PMML reader of the
left side of the Decision Tree to image. PMML reader is a model that provides numerous ways to represent
multiple models within one PMML file. This node reads any model from a file and connects the output port
to a model input port of any model requiring node [20]. The workflow for the decision tree model is
completed and we can easily analyze the final result with the help the decision tree. Fig.11 shows the
complete workflow model to generate the decision tree of the student’s mark.
Figure.11: The Activated Decision tree to image.
4. Results
From the implementation of the workflow, the results of our decision tree is obtained by the classification of the final_result class column. The decision tree is divided into four level as shown in Figure
Figure.12: Decision Tree (1st Level).
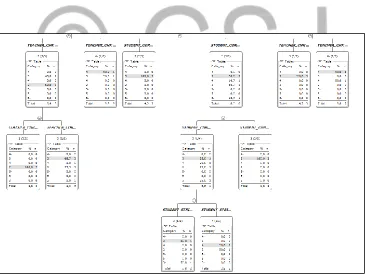
Figure.14: Decision Tree (3rd Level).
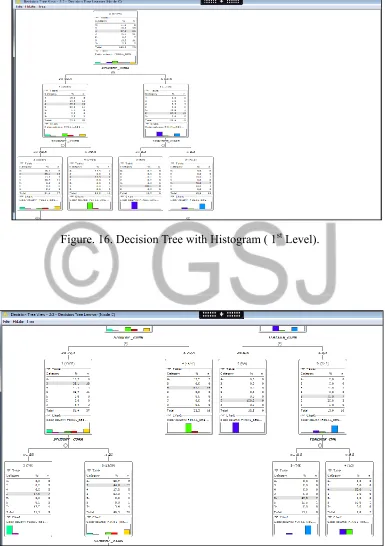
Histograms for each tree based on their classification were also generated; this saved us the stress of plot histogram for the entire decision tree model. This is shown in Figure 16 through Figure 19.
Figure. 16. Decision Tree with Histogram ( 1st Level).
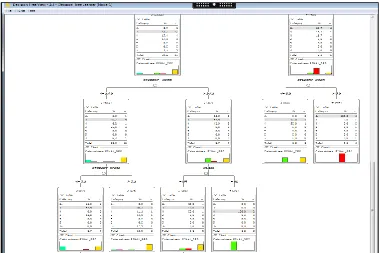
Figure. 18. Decision Tree with Histogram (3rd Level).
The Decision Tree Learner (Node C) also plot pie-charts for the list of scores obtained in the class column Final_Result.
Figure.20: Pie-Charts for each Decision Tree View.
Conclusion
From the data mining classification techniques implemented in this work by the decision tree method,
we concluded that KNIME is one of the best tools for classifying and also performing other analysis such as
clustering on samples of dataset. The results calculated the student’s correlation for those on the greater
performance and those on the lower performance. We also perform multiple testing by using two classes
named Class 8A and 8B as samples. This research will help the teacher and the students to easily predict the
future performance based on their previous one in the quiz. In future experiments, we will measure the
compressibility of each classification model and use data with more detailed information about the students
such as student’s profile and curriculum of other courses. By doing this, we can easily measure the data
Acknowledgement
The authors wish to say a big thanks to South Ural State University, Chelyabinsk, Russia for providing the necessary tools that were required for the readings used in this research.
References:
1. M.S. Mythili and A.R. Mohamed Shanavas, “An analysis of students” performance using classification algorithms”, IOSR, Journal of Computing Engineering, volume 16, Issue 1, January 2014.
2. S.Lakshmi Prabha , A.R.Mohamed Shanavas, “Educational data mining applications”, Operations Re-search and Applications: An international Journal (ORAJ), volume 1, No. 1, August, 2014.
3. DavinderKaur, Rajeev Bedi and S.K Gupta, “Review of decision tree data mining algorithms: ID3 and C4.5”, pp. 5-8, july 2015
4. S.Ayesha, T.Musafa, A.Sattar and M.khan, “Data mining model for higher education system”, European Journal of Scientific Research, vol. 43, no 1, 2010. pp. 24-29.
5. Open for Innovation KNIME Software, URL: https://www.knime.com/knime-software.
6. Electronic URL Source-https://slideplayer.com/slide/13868930/
7. URL Source -https://bigdatanerd.wordpress.com/2011/06/25/introduction-to-data-mining-types-of-data-mining-techniques/
8. R.R Kabra and R.S Bichkar, “Performance prediction of engineering students using decision tree”, In-ternational Journal of Computer Applications. Vol.36. No 11, December 2011, pp. 8-12.
9. Classification and Prediction, Electronic URL source-
http://web.ydu.tw/~alan9956/doc101/datamining/dm06.pdf
10. S.Neelamegam and E. Ramaraj, “Classification algorithm in Data mining: An Overview”, volume 3, is-sue 5, September 2013, pp. 1-5.
11. Baradwaj, B.K. and Pal, S., 2011. “Mining Educational Data to Analyze Students’ Performance”. (IJACSA) International Journal of Advanced Computer Science and Applications, Vol. 2, No. 6, 2011
12. Pandey, U.K. and Pal, S., 2011. “Data Mining: A prediction of performer or underperformer using classi-fication”. (IJCSIT) International Journal of Computer Science and Information Technologies, pp 686-690, Vol. 2 (2), 2011.
14. Q. A. AI-Radaideh, E. W. AI-Shawakfa, and M. I. AI-Najjar, “Mining student data using decision trees”, International Arab Conference on Information Technology(ACIT'2006), Yarmouk University, Jordan, 2006
15. Yadav, S.K., Bharadwaj, B. and Pal, S., “Data Mining Applications: A comparative Study for predict-ing Student’s performance”. International Journal of Innovative Technology & Creative Engineering (ISSN: 2045-711), Vol. 1, No.12, December 2012.
16. J. Han and M. Kamber, “Data Mining: Concepts and Techniques,” Morgan Kaufmann, 2000.
17. Tariq O. Fadl Elsid, Mirghani. A. Eltahir “Data Mining: Classification Techniques of Students’ Data-base A Case Study of the Nile Valley University, North Sudan” International Journal of Comput-er Trends and Technology (IJCTT) – Vol 16, No. 5, October 2014.
18. Electric URL source: “Decision Tree learning”
http://www.ke.tu-darmstadt.de/lehre/archiv/ws0809/mldm/dt.pdf
19. Electric URL source: “Decision Tree learning”
https://hub.knime.com/knime/workflows/Examples/04_Analytics/04_Classification_and_Predictive_Mo delling/04_Exporting_a_Decision_Tree_as_Image*veiV9wzMmHHKpEh_
20. Electric URL source: “PMML Reader for nodes”
https://www.knime.com/sites/default/files/inlineimages/knime_quickstart.pdf