© IJEDR 2018 | Volume 6, Issue 4 | ISSN: 2321-9939
IJEDR1804040
International Journal of Engineering Development and Research (
www.ijedr.org
)
210
A Non-invasive Framework for Detecting
Hypercholesterolemia using Computer Vision
1
Aditya Arora,
2Neha Paggowal,
3Diksha Chawla,
4Ekagrata Sharma
ECE Department,
Bharati Vidyapeeth’s College of Engineering, New Delhi, India
_____________________________________________________________________________________________________
Abstract - Hypercholesterolemia or high cholesterol levels in the blood is quite commonly observed in the adults today. This condition is generally caused due to unhealthy diets or lack of exercise among other reasons and could lead to stroke or atherosclerosis. The total cholesterol in the blood can be calculated using invasive methods, i.e. lipid profile test. The side effect of having hypercholesterolemia is developing a condition called arcus senilis which refers to having grey in the edges of the iris. This paper proposes a non-invasive technique for detecting hypercholesterolemia and produces relevant results after proper analysis. The technique involves computer vision as a major tool for determining the levels of cholesterol by processing the image of a human eye. The process includes multiple filtering and masking techniques for detecting the desired portion of the iris followed by pixel by pixel analysis for calculating the amount of grey in the iris.
Index Terms - Hypercholesterolemia, Computer Vision, Iris, Masking
_____________________________________________________________________________________________________
I.INTRODUCTION
Cholesterol is a waxy substance that is found in each cell of our body. It is essential for creating hormones, Vitamin D and substances which help us in digesting our food. Although high levels are strictly undesired as excess cholesterol can combine with other substances and form plaque which results in various heart diseases and atherosclerosis. There are majorly two types of cholesterols, HDL (High Density Cholesterol) and LDL (Low Density Cholesterol). LDL is termed as "bad" cholesterol and is responsible for the said diseases. Another condition associated with high cholesterol levels is Arcus Senilis. In this condition, the edges of the iris of the eyes start to develop grey color which can be observed if looked carefully.
The most common method for determining the levels of cholesterol is by having a lipid profile test. This method is invasive and costly. In the paper, a non-invasive framework including multiple algorithms is proposed which can determine high cholesterol levels by analyzing the iris of the subject using computer vision techniques. The process relies on detecting the edges of the iris using various filters and masking techniques and then extracting the RGB values of the pixels of the desired region. Further, the amount of grey is calculated from the obtained values.
Section 2 of this paper gives insights into the previously done work in the field, section 3 discusses the methodology adopted, and section 4 and section 5 shows the results and conclusion respectively.
II.RELATED WORK
Over the years, researchers have been focussing on studies related to determining cholesterol levels and effects of cholesterol. The findings have been utilized in estimating the accurate level of low-density lipoprotein cholesterol for evaluating the risk of future heart disease as too much cholesterol can increase a person’s risk of developing heart diseases. As various studies have been done on the determination of bad effects of cholesterol [1-2], there have been studies [3] for health improvisation in the same field as well., Cholesterol can reduce blood flow through the arteries which can cause complications, such as, chest pain and other symptoms of coronary artery disease and even heart attack. Based on the outcomes of the analysis, cardiovascular health factors are also determined such as High LDL, or “bad” cholesterol, and low HDL, or “good” cholesterol. There are various invasive and non-invasive methods to determine cholesterol levels. Invasive methods [4-6] are more reliable yet costly and troublesome for the patients. On the other hand, the estimation of cholesterol levels has been done by non-invasive methods as well [7-8]. The techniques are majorly dependent on determining Arcus Senilis by evaluating the greyish edge around eyes which can be caused by high cholesterol levels. Normalization techniques are also used in some researches [9-10] where the polar iris image is transformed into a rectangular form for analysis.
III.FRAMEWORK AND IMPLEMENTATION
The framework is designed using Python 2.7 along with OpenCV 3.1.0 and Numpy 1.15.1. The process is distinguished into three different parts each serving its own purpose.
Preprocessing
First as a part of preprocessing, the image is subjected to two noise reducing filters, the Bilateral filter [11] and the Gaussian filter [12]. This smoothens the image and reduces the variations due to noises to a large extent. Also, a major problem that could arise is the irregularity in the dimensions of the images used for analysis. So, the image is resized to a fixed set of dimensions (640x480) using OpenCV itself.
IJEDR1804040
International Journal of Engineering Development and Research (
www.ijedr.org
)
211
Fig 1: Flowchart for preprocessing.Iris region detection
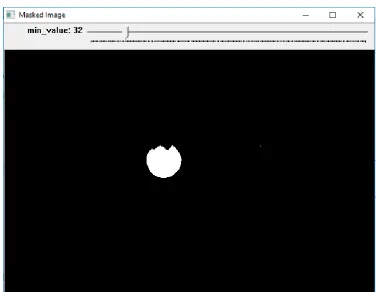
The algorithm derived for detecting the iris is using the black color property of the pupil which is persistent in every human. As the black color has the highest possible values of all three parameters on the RGB scale, it can be easily distinguished from the other colors. So, a threshold is applied which masks out everything except the pupil. As the image samples could have different lighting conditions, a UI is created for the user to set the threshold dynamically. On the thresholded image, the contour for the pupil is detected for determining the minimum bounding circle which will indeed represent the circle of the pupil.
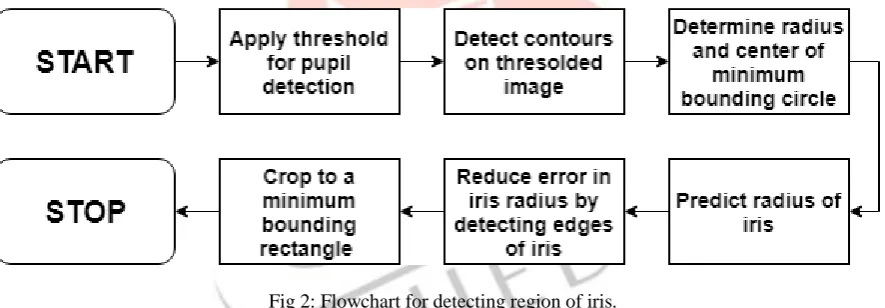
Next, for detecting the iris the radius of the pupil is multiplied by 4 and a rough estimate of the radius of the iris is calculated. This is supported by the fact that the ratio of the radius of iris to the radius of the pupil is approximately equal to 4. Further, this prediction is improved by reducing the error in the radius. The pixel analysis is done on the horizontal line of pixels in the line of the center. As the sclera region of the eye is white in color, it will return a value of RGB closer to (0,0,0) whereas the region of iris has a comparatively darker shade. The analysis is carried out from the outermost pixel and is moved inwards and as soon as a pixel with darker shade is identified or a grey pixel is identified, the edge of the iris is detected.
The flowchart below depicts the process in a more simplified manner,
Fig 2: Flowchart for detecting region of iris.
After the complete detection process, a minimum bounding rectangle is created around the iris and the image is cropped according to the formed rectangle. This is done for saving the processing time for further processes as the total number of junk pixels will be reduced to a great extent.
Hypercholesterolemia prediction
Detection of hypercholesterolemia is the most important part in the entire process, the algorithm for the same is quite robust and limits the analysis to the useful region only for better performance. First, the region beyond the minimum bounding circle enclosing the iris is masked out as that region is not required for analysis for obvious reasons. For similar reasons, the region around the pupil is also masked out. The percentage of the region to be masked out is static initially to 2.2 times the radius of the pupil. Later the radius of the masking circle is reduced based on the amount of grey detected.
For determining the amount of grey, RGB values of each remaining pixel is extracted. The basic property of grey color is that it has RGB values which are approximately equal. So, each pixel with such a characteristic is counted as a grey pixel in the analysis. Next, the ratio of a number of grey pixels to the number of total pixels analyzed (excluding the masked pixels) is calculated. After obtaining this ratio, the prediction is made whether the subject has hypercholesterolemia or not. This is achieved by evaluating the cover of grey and comparing it with a threshold to determine the severity.
IJEDR1804040
International Journal of Engineering Development and Research (
www.ijedr.org
)
212
Fig 3: Flowchart for predicting Hypercholesterolemia.IV.RESULTS
The results generated by the framework turned out quite promising. The figure below shows the user interface designed for setting the threshold,
Fig 4: UI for setting threshold.
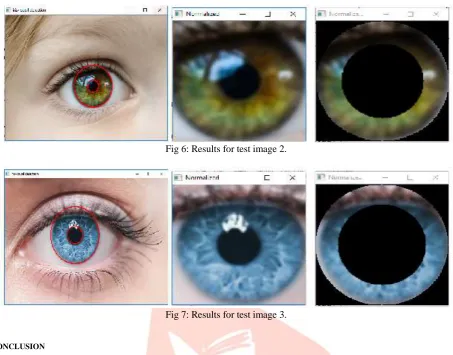
The following figures show the results generated for three sample images,
IJEDR1804040
International Journal of Engineering Development and Research (
www.ijedr.org
)
213
Fig 6: Results for test image 2.Fig 7: Results for test image 3.
V.CONCLUSION
The non-invasive framework for predicting hypercholesterolemia has produced relevant and promising results upon complete analysis. It positively exploits the color properties of the pupil and the characteristics of the grey color itself. The iris detection method proved to be quite robust and suited well for the succeeding algorithm. The only restriction is the quality of the image used for analysis as the eye should be clearly visible and preferably wide open in the image.
The proposed method in this paper is quite convenient from a patient’s point of view as no invasive techniques are involved. The scope for this framework is bright and it would become more reliable as more data sets related to the mentioned medical condition are made available.
REFERENCES
[1] I Lemieux, B Lamarche, C Couillard, A Pascot, B Cantin, J Bergeron, et.al., “ Total cholesterol/HDL cholesterol ratio vs LDL cholesterol/HDL cholesterol ratio as indices of ischemic heart disease risk in men: the Quebec Cardiovascular Study.”, vol. 161, 2001
[2] F Hadaegh, H Harati, A Ghanbarian, and F zizi, “Association of total cholesterol versus other serum lipid parameters with the short-term prediction of cardiovascular outcomes: Tehran Lipid and Glucose Study”, 2006
[3] M J Chapman, G Assmann, J C Fruchart, J Shepherd and C Sirtori, “Raising high-density lipoprotein cholesterol with reduction of cardiovascular risk: the role of nicotinic acid – a position paper developed by the European Consensus Panel on HDL-C”, vol. 20, 2004
[4] Eleni T. Bairaktari, Konstantin I. Seferiadis and Moses S. Elisaf," Evaluation of Methods for the Measurement of Low-Density Lipoprotein Cholesterol", Journal Of Cardiovascular pharmacalogy and therapeutics, January 1 2005
[5] Rafiq Ahmada, N. Tripathya and Yoon-Bong Hahna, "Wide linear-range detecting high sensitivity cholesterol biosensors based on aspect-ratio controlled ZnO nanorods grown on silver electrodes", Elsevier, Vol. 169, 5 July 2012
[6] Heng-Chia Chang and Ja-an Annie Ho, "Gold Nanocluster-Assisted Fluorescent Detection for Hydrogen Peroxide and Cholesterol Based on the Inner Filter Effect of Gold Nanoparticles, ACS, 20 oct 2015
[7] Ridza Azri Ramlee, Khairul Azha and Ranjit Singh Sarban Singh, "Detecting Cholesterol Presence with Iris Recognition Algorithm ", IntechOpen, 2011
[8] Sarika G. Songire and Madhuri S. Joshi,"Automated Detection of Cholesterol Presence using Iris Recognition Algorithm",International Journal of Computer Application, Vol.133, January 2016
[9] Vikas Bhangdiya, "Cholesterol Presence Detection Using Iris Recognition", International Journal of Technology and Science, Vol. 1, May 2014
[10]R. A. Ramlee and S.Ranjit, "Using Iris Recognition Algorithm, Detecting Cholesterol Presence", International Conference on Information Management and Engineering, 2009