CLASSIFICATION OF THE SURFACE
ELECTROMYOGRAM SIGNALS FOR FOREARM
MOVEMENTS FOR PROSTHESIS CONTROL
Anjana Goen
1, D. C. Tiwari
21
Research Scholar,
2Professor, School of Studies in Electronics, Jiwaji University, Gwalior, (India)
ABSTRACT
Biomedical signals are commonly used as a convenient solution of Human Computer Interface (HCI) for the
disabled persons. Myoelectric control system is the fundamental component of modern prostheses, which uses
the myoelectric signals from a human being’s muscles for prosthesis controls. For this purpose, surface
electromyogram (SEMG) data collected from thirty participants using eight electrodes located on the human
forearm is used. Various feature sets were extracted and projected in a manner that ensured maximum
separation between different movements of hand and then fed to the four different classifiers. We have used
Sparse Principal component analysis as feature projection which very profoundly discriminated the feature sets.
We have used majority voting algorithm in post processing approach to maximize the probability of correct
classification of the myoelectric data for different movements of forearms. Practical results and statistical tests
proved the viability of the proposed approach with an average classification accuracy > 98% for forearm
movements. The focus of this work is to optimize the configuration of the classification scheme. The SVM
ensemble based limb motion classification system demonstrates exceptional classification accuracy and results
in a robust method of motion classification with low computational load.
Keywords: Discriminant Locality Preserving Projections (DLPP), Myoelectric Control, Myoelectric
Signal (MES), Pattern Recognition, Prosthesis, Sparse Principal Component Analysis (SPCA).
I. INTRODUCTION
Surface electromyogram (SEMG) signal is one of the most important bio-signal. The use of SEMG signal is simple, fast and convenient, hence widely studied and applied in clinic. It is generated by muscular contraction and can be recorded using surface electrodes. The noninvasive surface electromyogram (SEMG) signal provides information about neuromuscular activity and has become an important and effective control input for powered prostheses from last 40 years [1].
Many researchers have demonstrated the feasibility of myoelectric control for various feature sets and classification methods [3-6]. The surface EMG signals have been successfully utilized in decoding the intended forearm movements.
The myoelectric signals acquired from healthy subjects can be considered as an emulation of the amputee’s command signals extending from the shoulder and intended for various hand movements.
In the realization of myoelectric control, the key problem is to accurately recognize the user’s intent. To classify the acquired surface myoelectric signals into one of a predefined set of forearm movements, pattern recognition of the myoelectric signal is used.
The concept of employing pattern recognition for myoelectric signal control schemes was first developed in late 1960s or early 1970s [7, 8]. First successful pattern recognition based approach offering real time performance and high accuracy was developed by Hudgins in 1993.
The paper is constituted as follows: Section 2 describes the data collection procedure, the feature extraction, feature set reduction, classification and post processing. Section 3 and section 4 presents the experimental results and discussion respectively and finally, conclusions are drawn in Section 5.
II. METHODOLOGY
We propose an EMG based forearm movement system that employs eight EMG electrodes placed on the surface of the human forearm. The goal is to employ effective feature reduction techniques and classifiers to increase the classification accuracy for identification of seven classes of forearm movements.
The block diagram of the proposed system is shown in Fig.1. Raw surface EMG signals were preprocessed and feature sets were extracted. The extracted features sets were reduced in dimensionality using SPCA OLDA, DLPP and then suitable classifiers SVM ensemble, LDA, MLP and MkKNN were utilized to recognize the signals from different classes of the forearm movements. To eliminate spurious misclassification and to enhance the classification accuracy majority voting was used.
Recorded Time and Frequency domains SPCA, OLDA SVM Ensemble Class Signal Time-frequency domain DLPP MkNN, LDA,MLP Label
Figure1: Block diagram of the Myoelectric signal classification system for prosthesis control
2.1 Data Collection
The data utilized in this paper is same that is used in [9]. The surface electromyogram signals collected from thirty subjects (eighteen females and twelve males). Duo-trode Ag-AgCl eight electrodes were placed on seven sites of the forearm and on the bicep for collecting eight channels of myoelectric data. An Ag-AgCl Red-Dot electrode was placed on the wrist as common ground reference. The Fig.2 shows the placement of electrodes on the forearm. The signals were amplified with a gain of 1000 and BW of 1 Hz to 1 KHz to be sampled at 3KHz.
Data Pre processing
Data Windowing
Feature extraction
Post Processing Classification
Figure 2: Electrodes placement on the right forearm
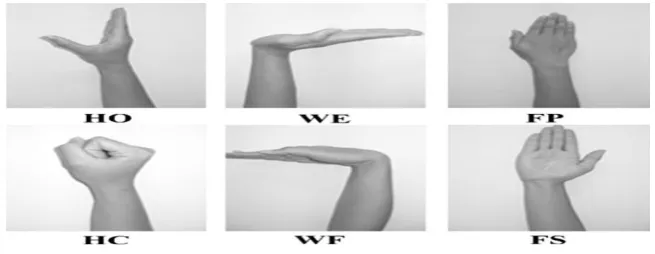
Seven distinct forearm movements: hand open (HO), hand close (HC), supination (S), pronation (P), wrist flexion (WF), wrist extension (WE) and rest (R) were recorded. The Fig. 3 shows the six movements of the forearm. In the original research paper [10], data from the fourth session was used. For the same reason, we have also used data from the fourth session only. The data from the first four trials were used for training data and the remaining two trials for testing.
Figure 3: Different forearm movement classes
2.2 Feature extraction
Due to the stochastic nature of the EMG, an instantaneous sample contains relatively little information about the overall muscle activity, hence features should be chosen very cautiously. They are used to model and analyze raw electromyogram signals, so success of any classification problem depends almost entirely on the selection and extraction of features. Features were computed from the preprocessed myoelectric signal in time, frequency and time-frequency domain using a sliding window approach.
The feature set should be capable to capture the characteristics or properties of the MES for different limb motions. Consideration of the feature set must involve the computational load required; a tradeoff in accuracy and computational complexity does exist.
Two sets of features were extracted: first set (TFD) consisted of fifth order time varying autoregressive coefficients, root mean square, mean absolute value, mean and median frequency and Short time Fourier transform (STFT). The second feature set (WT) consisted of mean of the square values of the wavelet coefficients each of DWT using Daubechis wavelet family and WPT using Symmlet wavelet family with five levels of decomposition.
Overlapping window of 256ms was analyzed which were spaced 128ms and 32ms apart for training data and testing data respectively. To improve the accuracy, the transitional data 256ms before or after a change in limb motion was removed from the training set.
Dimensionality reduction is an important process before classification is performed. LDA is a supervised, nonlinear dimensionality reduction technique. We have employed orthogonal LDA (OLDA), which computes a set of orthogonal discriminant vectors via the simultaneous diagonalization of the scatter matrices.
The application of OLDA is justified by the high variance nature of the myoelectric signal which causes the information to be liberally dispersed amongst the original feature set extracted from the EMG signals. Feature projection methods can consolidate such information more effectively than feature selection based methods in EMG signals classification problems [11]. Also OLDA has low computational cost compared to nonlinear projection methods.
2.3.1 Sparse PCA (SPCA)
Principal component analysis (PCA) is commonly used in data processing and dimensionality reduction. In PCA, it is difficult to interpret the results as each principal component is formed by linearly combining all the original variables. The fact that PCA does not consider the class label in the projection process limits the performance of PCA when compared to other projection methods. Sparse Permanent component analysis (SPCA) is considered as a combination of feature selection and projection. SPCA provides a means of unsupervised dimensionality reduction, as no class membership qualifies the data when specifying the eigenvectors of maximum variance [12].
Sparse principal component analysis (SPCA) uses the lasso (elastic net) to produce modified principal components with sparse loadings. It allows flexible control on the sparse structure of the resulting loadings. As a principled procedure, it is computationally efficient, has high explained variance and ability in identifying important variables. It maximizes the variance explained by a linear combination of the input variables, but simultaneously constrains the number of nonzero coefficients. We have used it to find a subspace whose basis vectors correspond to the maximum-variance directions in the original space [13].
2.4 Classification
Myoelectric signal classification for prosthetic control is a difficult problem, as the myoelectric signal is random in nature due to the complex strategies of motor unit firing and recruitment inherent in neuromuscular control strategies. A suitable classifier must be accurate enough to generalize well the novel data and capable of being optimized to suit the unique patterns generated by individual users. It is not necessary that it should be capable of being trained in a reasonable amount of time [14].
The LDA and the MLP are easily implemented and well understood representatives of statistical and neural classifiers respectively. Although some classifiers demonstrate obvious advantages over others but is the feature set that most dramatically affects the classification performance, and this is our main focus in this work.
2.4.1 SVM Ensemble
A SVM is an intelligent learning method and is the core of classification in myoelectric control. It has high accuracy, robust performance, and low computational load but suitable for two-class classification. In Ensemble learning multiple learners are trained to solve the same problem. It tries to construct a set of hypotheses and combine them to use. Since an ensemble contains a number of base learners, its generalization ability is much stronger than that of base learners.
2.5 Post Processing
With the overlapped windowing scheme very dense decision stream is produced and decisions are made more frequently than the required response time of prosthesis. Post processing techniques are usually utilized after classification to prevent overwhelming the prosthetic controller with varying classification decisions. In a MV scheme, an acceptable delay of 256 ms and an overlapped windowing increment in the test session is used. The number of decisions used in the majority vote is determined by the processing time Tprocess (time consumed
during feature extraction, projection and classification) and the acceptable delay Tdelay (the response time of the
control system). We can use the previous decisions, the current decision and the future decisions to form the MV. For a given decision point di, the majority vote decision dmv includes the previous m decisions and may
also include the future m decisions (with m satisfying the inequality of m×Tprocess≤ Tdelay [17]. The value of dmv
is simply the class label with the greatest number of occurrences in the 2m+1 decisions.
III. RESULTS
Data from the first two trials as training set, trials 3 and 4 for validation and for testing trials 5 and 6. Consequently, the testing scheme is different from the one used in [10] which utilized the 4 trials (trials 3 to 6) for testing. The three way data split is so that the chosen features do not cause an over-fitting in the results and also the system can work well with future unseen data.
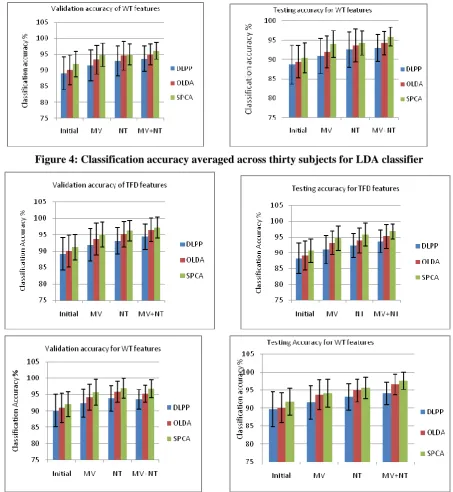
The performance of features projected with dimensionality reduction tools SPCA, OLDA, DLPP will be utilized for computing the classification accuracy. The preferred number of features is equal to 30 for TFD and WT features sets. Classification is performed using a LDA and SVM ensemble classifiers. The classification accuracy results from all the thirty subjects for were recorded and the average classification accuracy with one standard deviation as dispersion bars are shown in Fig. 4 and Fig. 5 for the validation and the testing sets. Applying majority vote in post processing step achieved an enhancement in the EMG classification accuracy of about 2%. Further, the transitional data between classes is removed as the system is in an undetermined state between the contractions. The results shown below are given first without a majority vote (MV), followed by results with the transitional data between classes removed (NT- no transitional data), and lastly with the application of majority vote and the removal of the transitional data (MV +NT).
Figure 4: Classification accuracy averaged across thirty subjects for LDA classifier
Figure 5: Classification accuracy averaged across thirty subjects for SVM ensemble Classifier
After analyzing the results, it was observed that the hit rates obtained by SPCA method outperformed OLDA and the OLDA in turn outperformed DLPP. OLDA projects the data into directions that maximize the ratio of the between scatter matrix to the within scatter matrix and simultaneous diagonalization of the scatter matrices resulting into the orthogonal discriminant vectors. Thus the performance of OLDA is stable when the number of extracted features is not too small. The SPCA results into a very powerful combination of features.
TABLE 1 Validation and testing accuracies averaged across thirty subjects (using MV+NT)
Feature set Data Division SPCA OLDA DLPP TFD Validation 97.1777 95.9396 88.3277
Testing 94.8502 94.4126 87.9324 WT Validation 98.4138 97.1954 91.1828 Testing 96.2501 95.3333 90.0115
TABLE 2 Geometric mean error ratios of SPCA against different methods
Feature set Data Division SPCA ~ OLDA SPCA ~ DLPP
TFD Validation 0.8298 0.2826
Testing 0.9117 0.3807
WT Validation 0.8008 0.3305
Testing 0.8996 0.4138
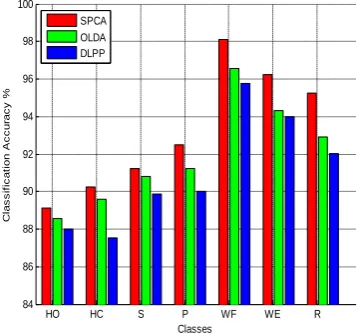
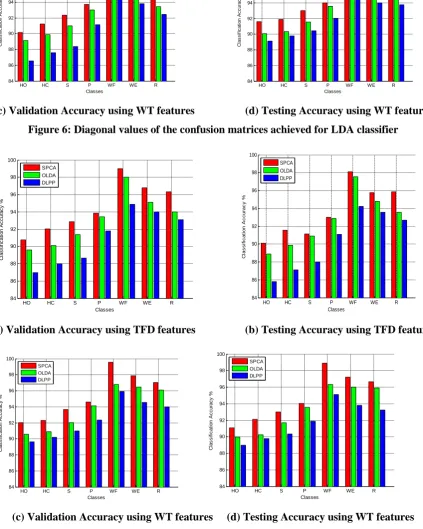
Further, in order to provide a thorough validation with existing techniques of dimensionality reduction, the confusion matrix for all the subjects was computed for both the feature sets and for the two classifiers LDA (used by the original researcher) and SVM ensemble. A plot of the diagonal values of the class wise classification accuracy matrices for both the validation and testing with TFD and the WT features is shown in Fig. 6 and Fig. 7. The figures indicate SPCA achieved better performance than OLDA and that both SPCA and OLDA in turn clearly outperformed DLPP.
HO HC S P WF WE R
84 86 88 90 92 94 96 98 100 Classes C la s s if ic a ti o n A c c u ra c y % SPCA OLDA DLPP
HO HC S P WF WE R
84 86 88 90 92 94 96 98 100 Classes C la s s if ic a ti o n A c c u ra c y % SPCA OLDA DLPP
HO HC S P WF WE R 84 86 88 90 92 94 96 98 100 Classes C la s s if ic a ti o n A c c u ra c y % SPCA OLDA DLPP
HO HC S P WF WE R
84 86 88 90 92 94 96 98 100 Classes C la s s if ic a ti o n A c c u ra c y % SPCA OLDA DLPP
(c) Validation Accuracy using WT features
(d) Testing Accuracy using WT features
Figure 6: Diagonal values of the confusion matrices achieved for LDA classifier
HO HC S P WF WE R
84 86 88 90 92 94 96 98 100 Classes C la s s if ic a ti o n A c c u ra c y % SPCA OLDA DLPP
HO HC S P WF WE R
84 86 88 90 92 94 96 98 100 Classes C la s s if ic a ti o n A c c u ra c y % SPCA OLDA DLPP
(a) Validation Accuracy using TFD features (b) Testing Accuracy using TFD features
HO HC S P WF WE R
84 86 88 90 92 94 96 98 100 Classes C la s s if ic a ti o n A c c u ra c y % SPCA OLDA DLPP
HO HC S P WF WE R
84 86 88 90 92 94 96 98 100 Classes C la s s if ic a ti o n A c c u ra c y % SPCA OLDA DLPP
(c) Validation Accuracy using WT features (d) Testing Accuracy using WT features
Figure 7: Diagonal values of the confusion matrices achieved for SVM ensemble classifier
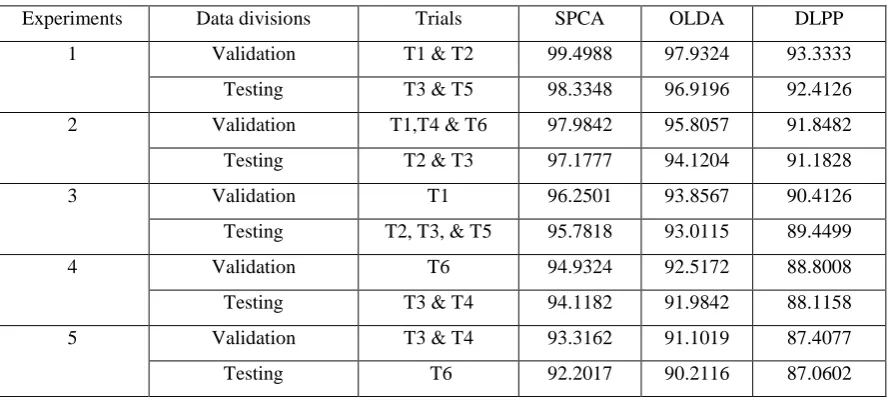
When working with the six trials of session four, it may be assumed that there may be a temporal development of the EMG signal due to the training and fatigue. Thus a random combination of trials for training, validation and testing was used to nullify the assumption. Hence, another set of experiments were conducted with a random combination of trials utilized each time. The results are shown in Table 3. This table presents a set of five experiments using the WT features as better results were achieved with WT features. The Table 3 clearly indicates that the performance of SPCA was better than that of other methods within all experiments with different data divisions.
TABLE 3 Validation and Testing Accuracy Results for Various Segments of the Datasets
Experiments Data divisions Trials SPCA OLDA DLPP
1 Validation T1 & T2 99.4988 97.9324 93.3333
Testing T3 & T5 98.3348 96.9196 92.4126
2 Validation T1,T4 & T6 97.9842 95.8057 91.8482
Testing T2 & T3 97.1777 94.1204 91.1828
3 Validation T1 96.2501 93.8567 90.4126
Testing T2, T3, & T5 95.7818 93.0115 89.4499
4 Validation T6 94.9324 92.5172 88.8008
Testing T3 & T4 94.1182 91.9842 88.1158
5 Validation T3 & T4 93.3162 91.1019 87.4077
Testing T6 92.2017 90.2116 87.0602
In accordance with all achieved results, the SPCA method proved to be successful in achieving better performance than any other feature projection techniques.
0 5 10 15 20 25 30 35 50 55 60 65 70 75 80 85 90 95 100
Number of features
C la s s if ic a ti o n A c c u ra c y P e rc e n ta g e
Average Classification Accuracy with SPCA
LDA SVM ensemble MLP MkNN
Figure 8: Classification accuracy as a function of SPCA
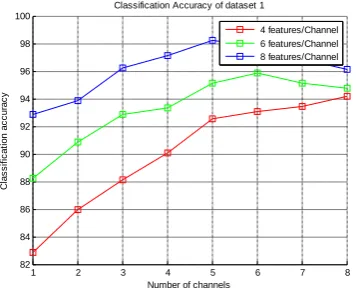
As the number of features per channel increased irrespective of the type of features, the accuracy increased. An experiment was carried out in order to investigate that to which extent classification performance can be improved with additional number of channels. The response was averaged across all subjects, by empirical analysis it was observed that more numbers of channels do not profoundly affect the classifier performance. Fig.9 shows five numbers of channels with eight numbers of features per channel were sufficient, after that the performance decreased. Also the number of channels depended on the number of features per channel. We proved that as the number of features per channel is less than more number of channels are required so that there is sufficient amount of information for classification task. The SVM ensemble gave the best result with an accuracy greater than 98%.
1 2 3 4 5 6 7 8
82 84 86 88 90 92 94 96 98 100
Number of channels
C la s s if ic a ti o n a c c u ra c y
Classification Accuracy of dataset 1
4 features/Channel 6 features/Channel 8 features/Channel
Figure 9: Classification accuracy with number of features per channel
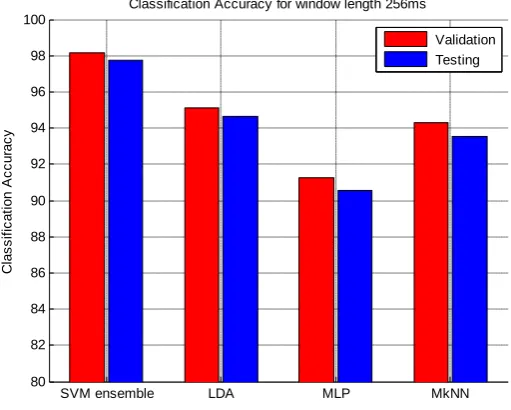
SVM ensemble LDA MLP MkNN 80
82 84 86 88 90 92 94 96 98 100
Classification Accuracy for window length 256ms
C
la
s
s
if
ic
a
ti
o
n
A
c
c
u
ra
c
y
Validation Testing
Figure 10: Classification accuracy for 256 ms window for different classifiers
IV. DISCUSSION
We have introduced new techniques SPCA as dimensionality reduction and SVM ensemble as classifiers for non invasive myoelectric signal classification or pattern recognition. The performance of SVM ensemble and LDA classifier was smoothed by majority voting, but SVM ensemble outperformed LDA for both TFD and WT features sets. In SPCA, the covariance structure was removed, by projecting the feature sets onto the orthonormal axes of maximum variance. In the original feature sets, the information was liberally dispersed; therefore, SPCA showed ability to consolidate this information much effectively than other feature selection methods. SPCA appears to effectively accommodate these effects. The improvement that SPCA offers to TFD features is not as pronounced as to the WT sets, as the original dimensionality is relatively low.
With the increase in dimensionality of the feature set, the degree of nonlinearity between class boundaries must diminish. In the high dimensional feature space of TFRs, a significant degree of linear dependency exists. The SPCA preserves the linearity that exists between classes while projecting the TFR coefficients onto a relatively low dimensional space. The fact that the SPCA-projected TFR features (WT) have reasonably linear class boundaries and that they have relatively low dimension diminishes the advantage of LDA may have over SVM ensemble.
highest classification accuracy. The result indicated that the combinations of the eight features and using SVM ensemble as a classifier provide a suitable SEMG pattern identifier in recognizing the forearm movement. Based on the level of complexity and rate of correctness, the proposed analytical system proves to be superior.
Also the classification accuracy varies with the length of window a proper length of the window is desired. We saw that with 256ms accuracy achieved was highest when the decision of SVM ensemble classifier was smoothed by majority voting. The accuracy achieved was highest for the response time less than 300ms delay. The performance of MkNN classifier was below the LDA classifier due to the large sample size.
V. CONCLUSION
The primary goal of this paper was to compare the pattern recognition classification accuracies and to explore the pattern recognition algorithms which can be utilized within the prosthesis device controllers. These intelligent pattern recognition models will enhance the life of amputees and help them to restore their ability of interacting with the outer world.
The classification of myoelectric signal depended on the domains from which features were extracted. The classifier exhibited very good accuracy with TFRs features but the way in which feature sets were projected mattered most. The classification accuracy was greater than 98% with five channels and it started deteriorating as more number of channels was introduced. We have introduced a new algorithm SPCA for feature reduction of myoelectric signals and we saw in our work that the performance of SPCA was remarkable. In our work, in place of using single LSVM like other researchers, we have used an ensemble of them. The individual SVMs were aggregated to make a collective decision using majority voting which outperformed the other classifiers. The highest accuracy was obtained with WT feature sets.
VI. ACKNOWLEDGEMENT
The authors are thankful to Sh. Adrian D. C. Chan, Carleton University for providing myoelectric database. The database has been downloaded from the links, http://www.sce.carleton.ca/faculty/chan/download/mec1.zip, http://www.sce.carleton.ca/faculty/chan/download/mec2.zip,
http://www.sce.carleton.ca/faculty/chan/download/mec3.zip
REFERENCES
[1] P. Parker, K. Englehart and B. Hudgins, “Myoelectric signal processing for control of powered prosthesis”, J. Electromyogr. Kinesiol., vol. 16, no. 6, pp. 541–548, 2006.
[2] R. N. Khushaba, S. Kodagoda, D. Liu and G. Dissanayake, "Electromyogram based fingers movement recognition using neighborhood preserving analysis with QR-decomposition", In 7th Int. Conf. on Intelligent Sensors, Sensor Networks and Information Processing (ISSNIP), pp. 1-6, 2011. [3] B. Hudgins, P. Parker and R. N. Scott, “A new strategy for multifunction myoelectric control”, IEEE
Transaction on Biomedical Engineering, vol. 40, no.1, pp. 82-94, 1993.
[5] A. Phinyomark, P. Phukpattaranont and C. Limsakul, “Feature reduction and selection for EMG signal classification”, Expert Systems with Applications, vol. 39, no.8, pp. 7420–7431, 2012.
[6] J. Rafiee, M. A. Rafiee, F. Yavari and M. P. Schoen, “Feature extraction of forearm EMG signals for prosthetics”, Expert Systems with Applications, vol. 38, no. 4, pp. 4058–4067, 2011.
[7] J. Kilby and K. G. Hosseini, “Wavelet Analysis of Surface Electromyography Signals”, Proceedings of the 26th Annual International Conference of the IEEE EMBS, San Francisco, CA, USA, pp. 384-387, 2005.
[8] P. Lawrence, P. Herberts, and R. Kadefors, “Experiences with a multifunctional hand prosthesis controlled by myoelectric patterns”, In Advances in External Control of Human Extremities, Gavrilovic and Wilson, Eds., Yugoslavia, pp. 47–65, 1973.
[9]
A. R. Goge and A.D.C.Chan, “Investigating classification parametes for continous myoelectrically controlled prostheses”, In Proceedings of the 28th Conference of the Canadian Medical and Biological Engineering Society, Canada, pp. 141-144, 2004.[10] A. D. C. Chan and G. C. Green, “Myoelectric control development tool box”, In Proceeding of the 30th Conference of the Canadian Medical & Biological Engineering Society, Canada, 2007.
[11] K. Englehart, “Signal representation for classification of the transient myoelectric signal”, Ph.D. dissertation, University of New Brunswick, Canada, 1998.
[12] R. N. Khushaba, S. Kodagoda, D. Liu and G. Dissanayake, “Electromyogram (EMG) Feature Reduction Using Mutual Components Analysis for Multifunction Prosthetic Fingers Control” , In Proc. Int. Conf. on Control, Automation, Robotics & Vision, Guangzhou, pp. 1534-1539, 2012.
[13] H. Zou, T. Hastie and R. Tibshrani, “Sparse Principal Component Analysis”, Journal of Computational and Graphical Statistics, vol.15, no. 2, pp. 265–286, 2006.
[14] Y. Huang, K. B. Englehart, B. Hudgins and A. D. C. Chan, “A Gaussian mixture model based classification scheme for myoelectric control of powered upper limb prosthesis”, IEEE Transaction on Biomedical Engineering, vol. 52, no. 11, pp. 1801–1811, 2005.
[15] B. Leo. “Bagging Predictors”, Journal of Machine Learning, vol. 24, no. 2, pp.123–140, 1996.
[16] C. A. C. Coello and R. L. Becerra, “Adding knowledge and efficient data structures to evolutionary programming: A cultural algorithm for constrained optimization”, Genetic and Evolutionary Computer Conference, pp. 201-209, 2002.