Analysis of Intravenous Lipid Emulsions
and Their Effect on Cellular Structure
and Function
Phillip David Whitfield
A thesis submitted for the degree o f Doctor o f Philosophy (Ph.D) in the
Faculty o f Life Sciences o f the University o f London
Biochemistry, Endocrinology and Metabolism Unit Institute o f Child Health
University College London Medical School
ProQuest Number: U643016
All rights reserved
INFORMATION TO ALL USERS
The quality of this reproduction is dependent upon the quality of the copy submitted.
In the unlikely event that the author did not send a complete manuscript and there are missing pages, these will be noted. Also, if material had to be removed,
a note will indicate the deletion.
uest.
ProQuest U643016
Published by ProQuest LLC(2015). Copyright of the Dissertation is held by the Author.
All rights reserved.
This work is protected against unauthorized copying under Title 17, United States Code. Microform Edition © ProQuest LLC.
ProQuest LLC
789 East Eisenhower Parkway P.O. Box 1346
Table of Contents
Page
Acknowledgements 9
Abbreviations 10
Abstract 12
Chapter 1 General Introduction 13
1.1 Total Parenteral Nutrition 14
1.2 History of Total Parenteral Nutrition 14
1.3 Clinical Indications for Total Parenteral Nutrition 14
1.4 Composition of Total Parenteral Nutrition 15
1.5 Complications of Total Parenteral Nutrition 17
1.6 Specific Components of Intravenous Lipid Emulsions 19
1.7 Aims of the Present Study 32
Chapter 2 Effect of Intravenous Lipid Emulsions on the Fluidity of
Erythrocyte Membrane Ghosts 33
2.1 Introduction 34
2.2 Cell Membranes 34
2.3 Regulation of Membrane Fluidity 37
2 .4 Theory of Membrane Fluidity 38
2.5 Materials and Reagents 41
2.6 Methods 41
2.7 Results 50
Chapter 3 Development of an in vitro System to Examine the Effect of
Phytosterols on Cells 62
3.1 Introduction 64
3.2 Materials and Reagents 65
3 .3 Red Blood Cells 66
3.4 Phytosterol Uptake by Erythrocytes Using 2-Hydroxypropyl-P-Cyclodextrin 66
3.5 Effect of 2-Hydroxypropyl-p-Cyclodextrin Concentration on Cholesterol Efflux 74
3.6 Hep G2 Cells 77
3.7 Hep G2 Cell Culture 82
3.8 Bile Acid Synthesis in Hep G2 Cells 83
3.9 Effects of 2-Hydroxypropyl-P-Cyclodextrin on Hep G2 Cells 88
3.10 Use o f Foetal Calf Serum as a Phytosterol Carrier 92
3 .11 Phytosterol Loading into Hep G2 Cells Using Intravenous Lipid Emulsions 100
3.12 Discussion 101
Chapter 4 Effect of Intravenous Lipid Emulsions on Hepatic Cholesterol
Uptake 106
4.1 Introduction 107
4.2 Materials and Reagents 108
4.3 Methods 108
4.4 Effect of Intralipid on Cholesterol Uptake by Hep G2 Cells 109
4.5 Validation Studies 117
4.6 Effect of Media Preparation on Uptake of Cholesterol by Hep G2 Cells 122
4.7 Effect of Intralipid Components on Cholesterol Uptake by Hep G2 Cells 127
4.8 Time Course of Cholesterol Efflux from Hep G2 Cells 138
Chapter 5 Electrospray Ionisation-Tandem Mass Spectrometry of
Phospholipids in Intravenous Lipid Emulsions 143
5.1 Introduction 144
5.2 Notation of Phospholipids in Mass Spectrometry 145
5.3 Electro spray lonisation-T andem Mass Spectrometry 145
5.4 Materials and Reagents 150
5.5 Methods 150
5.6 Results and Interpretations 151
5.7 Discussion 167
Chapter 6 Final Conclusions 169
List of Figures
Page
Chapter 1
1-1 Basic structure of glycerophospholipids and some polar head groups 20
l-2a Molecular structure of sphingomyelins 21
l-2b Molecular structure of glycosphingolipids 21
1-3 Structures of triglyceride-rich and phospholipid-rich particles 23
1-4 Possible role of phospholipids in TPN-associated cholestasis 25
1-5 Structure of the major naturally occurring phytosterols 27
1-6a Structure of cyclopentanoperhydrophenanthrene 28
1 -6b Structure of cholesterol 28
1 -7 Possible role of phytosterols in TPN-associated cholestasis 31
Chapter 2
2-1 Structure of plasma membranes 36
2-2a Structure of 1,6-diphenyl-1,3,5-hexatriene 40
2-2b Measurement of membrane fluidity using a fluorescent probe 40
2-3 Quantitation of phytosterols and cholesterol by GC-MS 45
2-4 GC trace of plasma from an infant with severe TPN-associated cholestasis 47
2-5 Typical standard curve used for quantitation of sitosterol by GC-MS 48
2-6 Correlation between membrane fluidity and membrane PC 52
2-7 Correlation between membrane fluidity and membrane C/PC ratio 53
2-8 Correlation between membrane fluidity and membrane total sterol/PC ratio 54
2-9 Correlation between membrane fluidity and plasma total sterol/PC ratio 57
Chapter 3
3-1 Molecular structure of 2-hydroxypropyl-p-cyclodextrin 67
3-2 Effect of time on the loading of phytosterols in RBC using HPC 71
3-3 RBC cholesterol concentration during incubation with HPC solutions 72
3-4a Time profile of RBC haemolysis in the presence of HPC pre-lysis 73
3-4b Time profile of RBC haemolysis in the presence of HPC post-lysis 73
3-5a Effect of varying HPC concentration on cholesterol efflux from RBC 76
3-5b Effect of varying HPC concentration on haemolysis of RBC 76
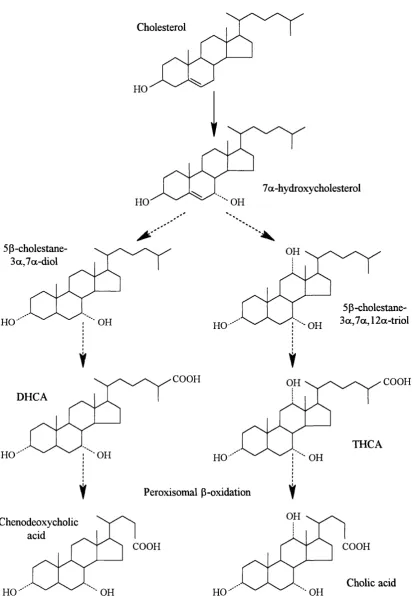
3-6 Overview of the classical bile acid synthesis pathway 78
3-7 Proposed scheme of biliary lipid secretion in humans 81
3-8 Gas chromatogram of bile acids synthesised by Hep 0 2 cells 85
3-9 Mass spectra of bile acids from Hep 0 2 cells 86
3-10 Time course for HPC-mediated cholesterol efflux from Hep 0 2 cells 90
3-11 Cellular retention of cholesterol following incubation with HPC 91
3-12 Lipoprotein systems for transporting cholesterol in humans 93
3-13 Correlation between phytosterol solubility and solvent polarity index 97
3-14 Correlation between HPC-mediated cholesterol efflux and RBC haemolysis 102
Chapter 4
4-1 Effect of 0-50%IL2o on cholesterol uptake of Hep 0 2 cells 111
4-2 Effect of 0-2 0%IL2o on cholesterol uptake of Hep 0 2 cells 112
4-3 Time course of cholesterol uptake by Hep 0 2 cells 113
4-4 Effect of 0. 1-2%IL2o on cholesterol uptake by Hep 0 2 cells 115
4-5 Effect of preincubation with 2%IL2o on cholesterol uptake by Hep 0 2 cells 116
4-7 Time course of Hep G2 cholesterol uptake from media preincubated +/- IL20 126
4-8 Effect of phospholipid fraction of IL20 on cholesterol uptake by Hep G2 cells 128
4-9 Effect of 10, 20 and 30% Intralipid on cholesterol uptake by Hep G2 Cells 131
4 -10a Correlation between cholesterol uptake by Hep G2 cells and PC 135
4 -10b Correlation between cholesterol uptake by Hep G2 cells and phytosterols 135
4-11 Effect of phytosterols on cholesterol uptake by Hep G2 cells 137
4-12 Time profile of Intralipid-mediated cholesterol efflux from Hep G2 cells 139
Chapter 5
5-1 Ion evaporation: the theoretical basis of electro spray ionisation 147
5-2a Schematic representation of product ion scan 149
5-2b Schematic representation of precursor ion scan 149
5-2c Schematic representation of neutral loss scan 149
5-3 a ESI-MS positive ion spectra of phospholipids from 20% Intralipid 154
5-3b ESI-MS positive ion spectra of phospholipids from 20% Lipofundin S 154
5-4a ESI-MS negative ion spectra of phospholipids from 20% Intralipid 155
5-4b ESI-MS negative ion spectra of phospholipids from 20% Lipofundin S 155
5-5a Positive ion product spectra of PC species m/z 760 157
5-5b Positive ion product spectra of PC sodium adduct m/z 782 157
5-6 Identification of [M+H]^ species of PC and SM in 20% Intralipid 159
5-7 Negative ion ESI-MS/MS of PE 18:0/20:4 in 2 0% Intralipid, m/z 766 160
5-8 Negative ion ESI-MS/MS of isobaric species at m/z 742 162
5-9 CID of [M-15]' SM 16:0 (m/z 687) 163
5-10a CID of glycoconjugate m/z 712 165
5-10b CID of glyco [M+Cl]' adduct at m/z 748 165
List of Tables
Page
Chapter 2
2-1 Details of Patients Receiving TPN 42
2-2 Concentration of Erythrocyte Membrane Lipids in Patients Receiving TPN 51
2-3 Concentration of Plasma Lipids in Patients Receiving TPN 56
Chapter 3
3-1 Concentrations of Bile Acids Synthesised by Hep G2 Cells 87
3-2 Solubility o f Phytosterols in Organic Solvents 96
3-3 Incorporation of Phytosterols into PCS from Organic Solvents 99
Chapter 4
4-1 Solvent Extraction of [^"^CJCholic Acid and [^'^CJCholesterol 118
4-2 Separation of Radiolabelled Lipids from Media of Hep G2 Cells 120
4-3 Concentration of Lipids in Intralipid Preparations and Their Fractions 133
Chapter 5
5-1 ESI-MS/MS Analysis of Phospholipid Species in 2 0% Intralipid 152
Acknowledgements
So many people, both at work and in play, have helped me with this project that it is
simply not possible to name everyone. However, I would like to take this opportunity
to personally thank them all for their input. In particular, I am very grateful to Kevin
Mills for all his help in the laboratory and David Stanton for his contribution. I would
also like to thank Andrew Johnson for his help with the tandem mass spectrometry and
John Rainer for his assistance with the cell culture.
A very special thanks goes to Eamonn O’Driscoll and Lucy Hackett and I am also
indebted to my parents, brother and his family for their support during my university
years.
I gratefully acknowledge the Child Health Appeal Trust (CHRAT) for the financial
support of the project.
Finally, I would like to thank my supervisors, Peter Clayton and David Muller for their
considerable encouragement, knowledge, and of course patience as they have expertly
guided me throughout the course of my study. Their efforts have been appreciated
enormously. I must also finally thank them for their continued financial support over my
Abbreviations
ACAT acyl coenzyme A: cholesterol acyltransferase
AST aspartate aminotransferase
BCA bicinchoninic acid
BSA bovine serum albumin
CA cholic acid
CDCA chenodeoxycholic acid
CID collision-induced dissociation
CM chylomicron
CMR chylomicron remnant
DAPI 4 ’, 6-diamidino-2-phenylindole
DHCA 3a, 7a-dihydroxy-5 (3-cholestan-26-oic acid
DMSO dimethyl sulphoxide
DPH 1,6-diphenyl-1,3,5 -hexatriene
DPM disintegrations per minute
ESI-MS electrospray ionisation-mass spectrometry
ESI-MS/MS electrospray ionisation-tandem mass spectrometry
ESR electron spin resonance
PCS foetal calf serum
GC-MS gas chromatography-mass spectrometry
GL glycolipid
Hb haemoglobin
HDL high-density lipoprotein
HEPES N-2-hydroxyethylpiperazine-N’ -2-ethanesulphonic acid
HMG-CoA 3-hydroxy-3 -methylglutaryl-coenzyme A
HPC 2-hydroxypropyl-p-cyclodextrin
3a-HSD 3a-hydroxysteroid dehydrogenase
IDE intermediate-density lipoprotein
IE Intralipid
ISTD internal standard
Lp-X lipoprotein-X
MDR multidrug resistance
MEM Eagle’s minimum essential medium
NDCA nordeoxycholic acid
NEAA non-essential amino acids
NMR nuclear magnetic resonance
PBS phosphate buffered saline
PC phosphatidylcholine
PC-TP phosphatidylcholine-transfer protein
PE phosphatidylethanolamine
PIP phosphatidylinositol monophosphate
PIP2 phosphatidylinositol bisphosphate
PLRP phospholipid-rich particles
PS phyto sterols
RBC red blood cells
SCP-2 sterol carrier protein-2
SIM selected ion monitoring
SM sphingomyelin
TGRP triglyceride-rich particles
THCA 3a ,7 a , 12a-trihydroxy-5 P-cholestan-26-oic acid
TPN total parenteral nutrition
VLDL very-low-density lipoprotein
v/v volume to volume
w/v weight to volume
Abstract
Total parenteral nutrition (TPN) offers the chance of survival to children who have had
extensive gut resections or suffer from severe gut failure. However, in infants it is often
associated with serious complications including cholestatic liver disease. The aetiology
of these complications remains unclear although it has been suggested that the lipid
emulsions used in TPN may be responsible. Commercial fat emulsions are typically
made up of a complex mixture of soybean oil-derived long chain triglycerides emulsified
with natural phospholipids and contain significant quantities of sterol contaminants in
the form of plant sterols and cholesterol. The hypothesis underlying this study was that
components of the lipid emulsions, in particular plant sterols and/or phospholipids, may
play a role in the development of TPN-associated cholestasis. The following methods
were established and validated during the course of this project i) the measurement of
membrane fluidity of erythrocyte ghosts by fluorescence polarography, ii) the
quantification of lipids from both cells in tissue culture and patient samples using gas
chromatography-mass spectrometry, iii) an in vitro system to study the effect of lipid emulsions and their component fractions on cholesterol uptake and efflux using cultured
Hep G2 cells and iv) the characterisation of the structure of phospholipids in lipid
emulsions by electro spray ionisation-tandem mass spectrometry. Results showed a) the
accumulation of phytosterols in plasma and erythrocyte membranes of patients receiving
TPN and a positive correlation between erythrocyte membrane lipid composition and
membrane fluidity, b) the TPN lipid emulsions had a dose-dependent inhibitory effect on
cholesterol uptake by Hep G2 cells, c) the phospholipid-rich particles of the lipid
emulsion which also contain high concentrations of phytosterols were primarily
responsible for producing the effects noted above and d) electrospray ionisation-tandem
mass spectrometry could be used to make comparisons of the polar head group, acyl
substituents and the positional placement of the fatty acid side chains of the
phospholipids found in the lipid emulsions frequently used in TPN regimes.
In conclusion, these results indicated that a component or components of the lipid
emulsions may interfere with cellular lipid homeostasis in vivo and may thus play a role in the development of TPN-associated cholestasis. Further work is required to
1.4 Composition of Total Parenteral Nutrition 15
1.4.1 Carbohydrates 16
1.4.2 Amino Acids 16
1.4.3 Lipids 16
1.4.4 Vitamins, Minerals and Trace Elements 16
1.4.5 Electrolytes and Water 16
Chapter 1
General Introduction
Page
. 1 Total Parenteral Nutrition 14
2 History of Total Parenteral Nutrition 14
3 Clinical Indications for Total Parenteral Nutrition 14
5 Complications of Total Parenteral Nutrition 17
6 Specific Components of Intravenous Lipid Emulsions 19
6.1 Phospholipids 19
6.2 Structure o f Phospholipids 19
6.3 Structure of Phospholipid-Containing Particles 22
6.4 Metabolism of Phospholipid-Containing Particles 22
.6.5 Possible Adverse Effects of Phospholipid-Containing Particles 24
6 .6 Phytosterols 26
6.7 Structure of Phytosterols 26
6 .8 Metabolism of Phytosterols 29
6 .9 Possible Adverse Effects of Phytosterols 29
1.7 Aims of the Present Study 32
1.1 Total Parenteral Nutrition
Total parenteral nutrition (TPN) can be used as a method to provide nutrients to
seriously ill infants unable to tolerate enteral feeding. This form of nutritional support,
however, is not without risks and is associated with serious complications in particular
cholestatic liver disease (Kerner, 1991). Cholestasis is defined as the diminution or
arrest of the flow of bile. The aetiology of this complication still remains poorly
understood. The hypothesis underlying this study was that a component or components
of the lipid emulsions used in TPN may play a role in the development of TPN-
associated cholestasis.
1.2 History of Total Parenteral Nutrition (Reviewed by Wretlind, 1992)
The successful development of TPN, in a modem sense, was only initiated in the late
1930’s. The first major step towards this therapy was taken in 1939 by the U.S.
physicians Elman and Weiner who successfully infused protein hydrolysates into adult
patients. This was repeated a few months later in infants by Shohl and colleagues. It
soon became apparent, however, that these mixtures failed to provide sufficient calories
to efficiently metabolise the amino acids. At the time, the only non-protein energy
source was glucose but there was a limit to the amount that could be supplied
intravenously. It either had to be administered in very large volumes or as a
concentrated solution which often resulted in damage to peripheral veins. High-calorie,
isotonic fat emulsions appeared to be a more realistic option. However, many of the
early emulsions caused significant side effects in man and it was not until the early
1960’s that safe intravenous fat emulsion became commercially available. From there it
was a small step to include vitamins, electrolytes and trace elements in the fat emulsions
and solutions of amino acids and glucose. In 1968 the use of long-term TPN became a
clinical reality when Wilmore and Dudrick demonstrated that a central venous catheter
could be used to administer the TPN solutions intravenously.
1.3 Clinical Indications for Total Parenteral Nutrition
Following its inception the benefits of TPN in a few disorders readily became apparent.
This was followed by widespread enthusiasm for the use of TPN in a broad spectrum of
ever performed. Thus, TPN is a powerful therapeutic tool, for which the indications
have never been accurately defined. Over recent years, however, significant advances
have taken place in the assessment of nutritional requirements as well as in the design of
regimes and in the preparation of energy sources and nutrients (Elia, 1995).
Whenever possible, nutrition should be administered via the enteral route and TPN
should only be considered when the gastrointestinal tract is compromised and it is
judged that the patient will be unable to absorb adequate amounts of nutrients. There
are, however, no absolute indications as to when TPN should be started, decisions have
to be based upon the clinical condition of the patient. As far as possible the parenteral
diet should be based on a normal oral diet, although normal energy requirements will
not be sufficient in certain diseases. Every surgical procedure or stress situation
interferes in one way or another with normal physiological processes of the body.
Consequently it is impossible to establish a “standard formula” for all patients. The
actual metabolic state, the prevailing clinical situation, the general condition and
possible other underlying conditions of the patient must be taken into account (Heird
and Winters, 1975). Therefore, specific TPN regimes have to be tailored to the differing
needs of each individual patient.
This thesis is concerned solely with the effects of TPN administration in children.
Infants have special metabolic needs which must be addressed when providing TPN for
them. Throughout childhood, but especially the low birthweight neonate, energy stores
are low and so it is essential to provide sufficient nutrients to prevent malnutrition.
Children also require nutrients for normal growth and development, processes which
involve the synthesis of macromolecules, such as proteins, carbohydrates and lipids.
These requirements are typically increased during periods of nutritional stress resulting
from illness. Therefore, unless there is provision of a well balanced and adequate supply
of nutrients permanent cellular and functional deficits could well arise (Evans and
Cockburn, 1991).
1.4 Composition of Total Parenteral Nutrition
All the major classes of nutrients are included in a paediatric TPN regime. Fats and
carbohydrates serve as the energy sources whilst amino acids furnish the vital
components for the synthesis of body protein. Carbohydrates and amino acids are
usually given in the form of a combined, commercially prepared solution, whilst the
lipid element is administered as a fat emulsion.
1.4.1 Carbohydrates
Glucose, in the form of dextrose is the carbohydrate of choice for parenteral use since it
is readily utilised by many cells and tissues such as erythrocytes, brain and cardiac
muscle. It also decreases the osmotic pressure of the carbohydrate component.
1.4.2 Amino Acids
A balanced mixture of crystalline L-amino acids (including the essential amino acids) is
given to infants at a rate that will promote growth. Several amino acid solutions suitable
for the very young child are commercially available.
1.4.3 Lipids
Lipids are normally administered in the form of energy-rich fat emulsions which provide
a concentrated source of calories and essential fatty acids. Commercial preparations
given include Intralipid (Upjohn-Pharmacia Ltd., Milton Keynes, UK), Lipofundin (B.
Braun Medical Ltd., Aylesbury, UK) and Ivelip (Clintec, Slough, UK).
1.4.4 Vitamins, Minerals and Trace Elements
The requirements of vitamins, minerals and trace elements in TPN have been poorly
characterised. They are usually provided as two separate supplements. The water
soluble vitamins and minerals are added to the solution of amino acids and dextrose;
and the fat soluble vitamins are administered with the lipid emulsion.
1.4.5 Electrolytes and Water
Finally, consideration must be given to the adequate replacement of water and
electrolytes. Providing no secondary disturbances exist in water-electrolyte balance,
substitution of electrolytes in TPN should be performed in concentrations
1.5 Complications of Total Parenteral Nutrition
Although the technique of TPN has been a major clinical advance, promoting the
normal growth of very small and ill infants, complications can occur especially with
prolonged TPN in very young patients. The major complication of long-term TPN is
cholestasis (Peden et al., 1971). Cholestatic liver disease is a frequent problem which /fleets up to 50% of infants who have been fed intravenously for over 2 months (Bell et
ah, 1986). In a small number of cases it may progress to severe hepatic dysfunction and death from liver failure. This sequence of events is the most common reason for
children being considered for combined gut-liver transplantation.
TPN-associated cholestasis is most likely to occur in preterm infants. This may be due
to the fact that the premature infant has a diminished synthesis rate and pool size of bile
salts (Watkins et a l, 1975). Further predisposing factors include a disturbed enterohepatic circulation which also reduces the bile salt pool size (Balistreri et al.,
1983) and the loss of enteral feeding which reduces the hormonal and neural stimuli of
hepatic bile secretion and gall bladder contraction (Lucas et al., 1983). Although it is recognised which patients are most likely to develop TPN-associated cholestasis, there
is much less agreement about which components of the TPN are responsible. The
situation is extremely complex and is almost certainly multifactorial.
A great deal of attention has been focused on the possible effects of excess amino acids.
Vileisis et al. (1980) noted that infants receiving a higher intake of amino acids as part o f their TPN regime (3.6 versus 2.3g/Kg/day) experienced an earlier onset and more
severe course of cholestasis. Individual amino acids have also been implicated. For
example, intraperitoneal injections of tryptophan into suckling rats have been shown to
be hepatotoxic (Merritt et al., 1984). Conversely, Cooper et al. (1984) reported extremely low plasma concentrations of taurine in three neonates who developed
progressive TPN-associated cholestasis. They argued that the absence of taurine
impaired the conjugation of bile acids producing the observed liver disease.
Amongst other suggestions it has been proposed that cholestasis may be caused by an
increased production of lithocholic acid. Fouin-Fortunet et al. (1982) found that in
adult patients who developed hepatic abnormalities during TPN, lithocholic acid
comprised between 7 and 15% of total biliary bile acids compared to less than 1% in
patients who remained unaffected. In other studies it has been suggested that
deficiencies of antioxidants such as vitamin E might expose the liver to damage by
increased concentrations of free radicals (Berger et al., 1985) whilst the possibility has been raised that TPN solutions containing high levels of trace metals may contribute to
hepatic dysfunction. For instance, Klein et al. (1987) showed that intravenous administration o f aluminium to piglets induced cholestatic liver disease.
Another view is that the lipid emulsions used in TPN could be involved. La Scala et al.
(1993) demonstrated that the bile flow of TPN fed rats receiving a lipid emulsion was
significantly lower (10.14 + 1.27|Lil/min) than in control animals (15.61 + l.Blpl/min).
Commercial fat emulsions consist in general of soybean triglycerides stabilised with egg
phospholipids and rendered isotonic with glycerol. Lipid emulsions also contain
significant quantities of sterol contaminants in the form of cholesterol and phytosterols.
Phospholipid deposits have been described in hepatocytes of patients with TPN-
associated cholestasis which are thought to reflect the intrahepatic accumulation of
phospholipids provided by TPN fat emulsions (Degott et al., 1988). Gerard-
Boncompain et al. (1992) reported the development of cholestasis in long-term TPN patients following a change in lipid emulsion. Differences in the sodium oleate content,
size of the lipid particles and phospholipid purification process of lipid emulsions were
suggested to explain this observation. Finally, excess phyto sterols delivered from lipid
emulsions have been implicated in the development of cholestatic liver disease. Clayton
et al. (1993) found a correlation between high plasma phytosterol concentrations and infants with severe TPN-associated cholestasis. Furthermore, the accumulation of
phytosterols in neonatal piglets has been associated with a significant inhibition of both
bile acid excretion and bile acid stimulated bile flow (Iyer et al., 1998).
As a result of these observations the hypothesis was formulated that phyto sterols and/or
phospholipids may be important factors in the development of TPN-associated
cholestasis. These components of intravenous lipid emulsions will now be examined
1.6 Specific Components of Intravenous Lipid Emulsions
1.6.1 Phospholipids
1.6.2 Structure of Phospholipids (Gurr and Harwood, 1991)
The large variety of phospholipids whicl
glycerophospholipids and sphingolipids.
The large variety of phospholipids which exisy can be divided into two broad groups,
Glycerophospholipids
These lipids consist of a hydrophobic moiety derived from diglyceride which is linked
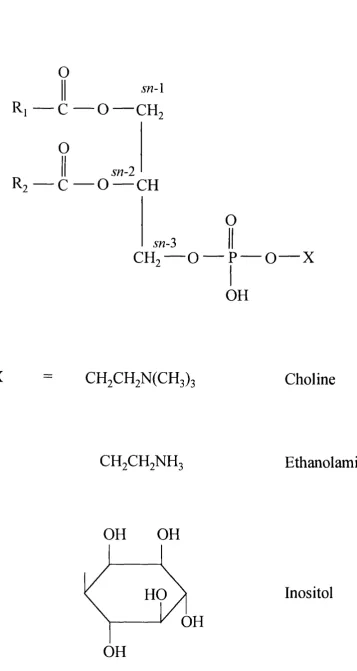
via a phosphodiester bridge to a hydrophilic polar head group (Figure 1-1). The two
fatty acyl side chains of the glycerophospholipids are esterified at the 5« -l and sn-2
positions of the glycerol backbone whilst the phosphate group is attached to sn-2>. This terminal phosphate can itself be esterified to one of several polar head groups which
define the specific class to which a glycerophospholipid belongs. The most common
head groups include the bases choline and ethanolamine and alcohols such as inositol.
Apart from differences in their functional head groups glycerophospholipids also display
considerable heterogeneity in their fatty acid composition.
Sphingolipids
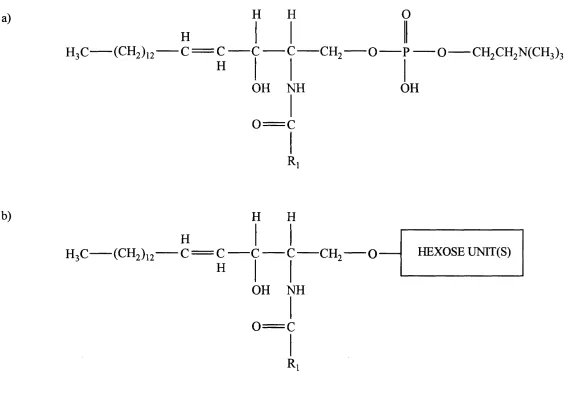
Sphingolipids constitute a class of lipids with a common sphingosine or a related
sphingoid long chain base to which various groups are attached (Figure 1-2).
Sphingosine is an amino alcohol containing an 18 carbon hydrocarbon chain and one
double bond between C4 and C5. Both of the amino and hydroxyl functional groups in
this backbone can be substituted. Acylation of the amino group o f the sphingosine with
a variety of fatty acids yields a ceramide, and estérification of the primary hydroxyl
group of a ceramide to phosphocholine produces sphingomeylin (Figure l-2a).
Alternatively the hydroxyl group may be conjugated to a carbohydrate chain giving rise
to a glycosphingolipid (Figure l-2b). Glycosphingolipids possess one or more sugars.
These can vary in size and complexity from a monosaccharide such as glucose or
galactose up to oligosaccharides containing several sugar residues.
o
sn-\
Ri — C — O — CH,
O
sn-2
R? — C — O — CH
O
sn-3
C H . — O
O — XOH
X
CH2CH2N(CH3)3
Choline
CH2CH2NH3
Ethanolamine
OH
OH
HO
OH
OH
Inositol
a)
H3C (CH2)
H
H H
1 2 C = C C
c
CH2— o
H
OH NH
0 = C
R
O
G CH2CH2N (CH3)3
OH
b)
H
H3C
(CH2)
i
2
c = c
H
H H
■CH, O
OH NH
0 = C
Ri
HEXOSE U N n(S )
1.6.3 Structure of Phospholipid-Containing Particles
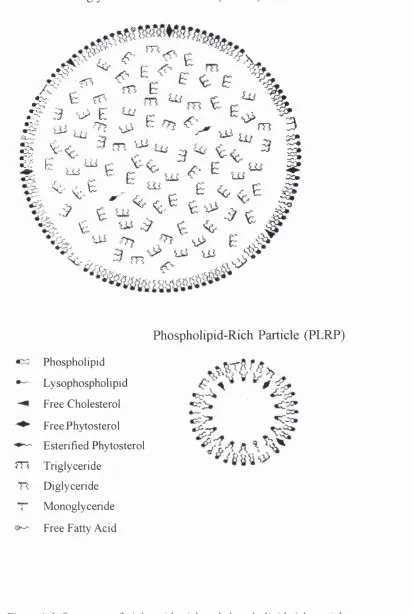
Phospholipids are added to lipid emulsions to facilitate the dispersion of the soybean
triglyceride droplets and to ensure the stability of the emulsion (Bach et al.^ 1996). A single layer of phospholipid molecules surrounds a droplet of triglycerides, thereby
shielding it from the aqueous exterior and forming what is referred to as a triglyceride-
rich particle (TGRP) (Figure 1-3). Commercial lipid emulsions contain more
phospholipid than is strictly necessary to emulsify the triglycerides. These excess free
phospholipids form vesicular-like bilayers known as phospholipid-rich particles (PLRP)
(Figure 1-3). Although composed primarily of phospholipid, PLRP are also reported to
contain small amounts of other lipid species (Ferezou et a l, 1994). Thus, lipid emulsions contain two distinct pools of phospholipid.
1.6.4 Metabolism of Phospholipid-Containing Particles
Metabolism o f Triglyceride-Rich Particles
In vivo the large TGRP (250-500nm) can acquire cholesterol esters and apoprotein (apo)-E from circulating plasma lipoproteins and are then metabolised in a similar
manner to dietary chylomicrons (Bryan et a l, 1976). Most of the triglycerides are first hydrolysed by lipoprotein lipase and then the remaining triglycerides, phospholipids and
cholesterol ester of the resultant TGRP remnants are taken up by the liver where they
are degraded.
Metabolism o f Phospholipid-Rich Particles
The metabolism of the PLRP (80-100nm) is poorly understood. It is believed that on
infusion the PLRP acquire apo-CII and apo-E before being partially hydrolysed by
lipoprotein lipase. Some of the liberated phospholipids are taken up by high-density
lipoproteins (HDL) and are eventually removed from the circulation by the liver. HDL
have a limited capacity for handling this phospholipid and long-term TPN has been
associated with reduced levels of HDL (Hajri et a l, 1990). Therefore, in TPN patients PLRP may not be cleared very rapidly from the circulation and this could result in their
accumulation in the plasma. The progressive accumulation of exogenous phospholipids
Triglyceride-Rich Particle (TGRP)
.KV
E
'%
M s
:u ; E\
i
I
4C-.: U i
K-.^.fc
„
^ ^
E % . E
< ^ c Eu s y
OCm
s
m
n
I
Phospholipid
Lysophospholipid
Free Cholesterol
Free Phytosterol
Esterified Phytosterol
Triglyceride
Diglyceride
Monoglyceride
Free Fatty Acid
Phospholipid-Rich Particle (PLRP)
« c ^
Figure 1-3. Structures of triglyceride-rich and phospholipid-rich particles.
behave as liposomes and attract free cholesterol from blood vessels and tissues (Wang
et al., 1996). These cholesterol-enriched particles may also act as precursors for the pathological lipoprotein, lipoprotein-X (Lp-X) (Untracht, 1982). Lp-X which has a
density very similar to that of low-density lipoproteins (LDL) is comprised of equimolar
quantities of phospholipid and free cholesterol. Varying concentrations of apo-CII and
-GUI are also associated with these abnormal particles. Lp-X-like bodies have been
identified in the plasma of rats following Intralipid administration (Breckenridge et al.,
1979), whilst Hajri et al. (1990) have demonstrated that infusion of the pure PLRP fraction in rats very rapidly induces Lp-X formation. Lp-X has also been reported to
accumulate in the circulation of preterm neonates maintained on TPN with lipid (Griffin
et a l, 1979). Interestingly, the plasma concentrations of this abnormal lipoprotein falls once the lipid infusion has ceased.
1.6.5 Possible Adverse Effects of Phospholipid-Containing Particles
Some of the pathological effects of phospholipids may be explained by their interaction
with cell membranes. For example, an alteration in the relative amounts of
phospholipids and changes in their fatty acid composition have been shown to occur in
the erythrocyte membranes of rats infused with Intralipid (Innis, 1989). Furthermore,
the PLRP element of lipid emulsions may substantially modify the composition of red
blood cells by depleting them of free cholesterol (Carpentier, 1989) which could
adversely affect the properties of the membrane. Similarly, it has been suggested that
TPN lipid emulsions can alter the lipid profile of intestinal brush border and microsomal
membranes in piglets (Van Aerde et a l, 1997).
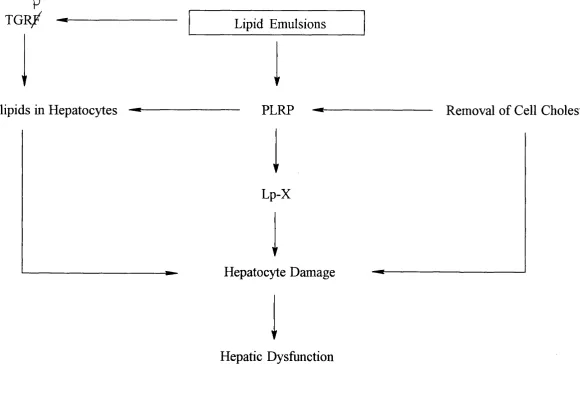
The potential role of phospholipids in the development of TPN-associated cholestasis is
shown in Figure 1-4. Excess phospholipids from PLRP and TGRP may accumulate in
hepatocytes and induce hepatic damage and dysfunction. The PLRP may also attract
free cholesterol from cell membranes and be transformed into Lp-X. The loss of
cholesterol would be expected to alter the membrane fluidity of the cell. Alternatively
Lp-X might directly interfere with the function of hepatocytes. Such effect(s) could be
p T G R /
t Phospholipids in Hepatocytes
Lipid Emulsions
PLRP
▼
Lp-X
Hepatocyte Damage
Hepatic Dysfunction
Removal o f Cell Cholesterol
K>
1.6.6 Phytosterols
Phytosterols are lipids found in plants. They are not synthesised by man and so their
concentration in plasma varies with diet. Important dietary sources of phytosterols
include corn, beans, nuts, and plant oils. During the manufacture of intravenous lipid
emulsions, phytosterols are added with the soybean triglycerides. The phytosterols are
present in both the free and esterified form. Little is known about the distribution of the
sterols between the phospholipid-containing particles but it is thought that esterified
phytosterols are located in the hydrophobic core of the TGRP whilst free phytosterols
are mostly associated with the phospholipid monolayers of both TGRP and PLRP.
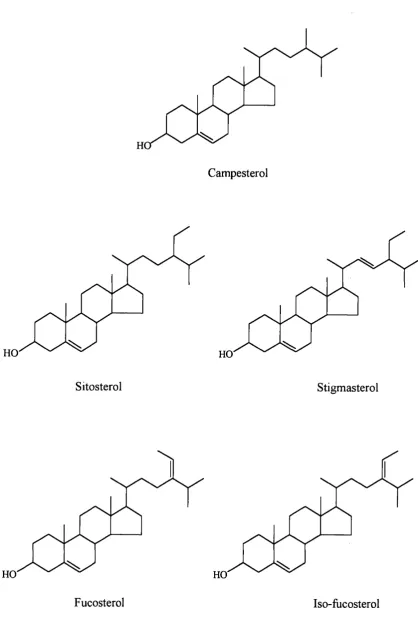
1.6.7 Structure of Phytosterols (Nes and McKean, 1977)
A wide variety of phytosterols have been described and identified all showing a similar
structure and biology. The phytosterols are structural derivatives of cholesterol and like
cholesterol comprise two units, a nucleus and a side chain. The most frequently found
phytosterols found in nature are sitosterol, campesterol and stigmasterol. The structures
of the major phytosterols are shown in Figure 1-5.
All the phytosterols examined in this thesis have a nucleus which has the same basic
structure as that found in steroids i.e. a fixed fused ring system of three cyclohexane
rings the so-called A,B,C rings and a terminal cyclopentane ring (D ring). This
configuration is referred to as the cyclopentanoperhydrophenanthrene nucleus (Figure
l-6a). In phytosterols and cholesterol the nucleus possesses a double bond at C5 and a
hydroxyl group on C3 (Figure l-6b).
Phytosterols generally differ from one another and cholesterol only in the size and
configuration of their side chain. The side chain of the phytosterols typically ranges
from eight carbon atoms in the C27 phytosterols to ten carbon atoms in the C29
phytosterols although occasionally it is longer. Compared to cholesterol, sitosterol and
stigmasterol both have an extra ethyl group at position C24. In addition, stigmasterol
possesses a double bond at C22. Fucosterol and iso-fiicosterol are also C29 sterols but
with an ethylidene substitutent at the C24 position, whilst campesterol is a C28 sterol
Campesterol
H O HO
Sitosterol Stigmasterol
HO HO
Fucosterol Iso-fucosterol
Figure 1-5. Structure of the major naturally occurring phytosterols.
a)
c
D
A
B
Cyclopentanoperhydrophenanthrene Nucleus
b)
HO
Cholesterol
1.6.8 Metabolism of Phytosterols
Phytosterols are normally poorly absorbed by man. In healthy adults, normally less than
5% of dietary phytosterols are absorbed, whereas 50% of dietary cholesterol is
absorbed (Salen et al., 1970). Human infants appear to have a higher phytosterol absorption than adults. The amounts of phytosterols in a child’s diet depends upon the
relative amounts of animal fats and vegetable oils ingested. Low concentrations of plant
sterols are found in breast milk and cows milk, whereas soybean based infant formulae
contain relatively high concentrations (Mellies et a l, 1976; 1978). Phytosterols given orally impair cholesterol absorption and they have been used successfully for the
treatment o f hypercholesterolaemia (Lees et a l, 1977). The low intestinal uptake of phytosterols is, however, selective, for example campesterol is absorbed more easily
than sitosterol. It has been suggested that this uptake of sterols in humans is related to
differences in the structure o f their side chain (Heinemann et al., 1993). The small amounts of phytosterols that are absorbed in healthy individuals are concentrated in the
liver and excreted in bile (Lin et al., 1984). The liver, however, has a limited capacity for handling phytosterols which may prove problematic when large concentrations of
phytosterols have to be eliminated (Bhattacharyya etal., 1991). There is also some loss through the skin.
Studies have been performed examining the conversion of sitosterol into C24 bile acids.
Salen et al. (1970) reported that cholic and chenodeoxycholic acids were formed from intravenously administered radiolabelled sitosterol in humans at approximately the same
rate as from cholesterol. However, subsequent investigations in man did not confirm
this metabolism (Boberg et al., 1990). In rats it has been reported that sitosterol is metabolised into novel di- and trihydroxylated C21 bile acids rather than being converted
into C24 bile acids (Lund et al., 1991). Phytosterols have also been shown to inhibit the conversion o f cholesterol to bile acids (Boberg et al., 1989) and to interfere with the solubilisation of cholesterol in bile (Bjorkhem and Skrede, 1989).
1.6.9 Possible Adverse Effects of Phytosterols
Like cholesterol, plant sterols affect the packing o f membrane layers and are also
capable of displacing cholesterol from cell membranes. Since differences exist between
the cholesterol and phytosterol side chains incorporation of phytosterols into cell
membranes can affect membrane structure and, therefore, alter the physical properties
of the membrane. For example, in one study it was shown that when rats were fed on a
diet containing 3% sitosterol and 2% campesterol for 21 days, the phytosterols
displaced the cholesterol from liver microsomal membranes and led to a decrease in
membrane fluidity (Leikin and Brenner, 1989).
A condition which provides some insight into some of the possible adverse effects of
phytosterols is hereditary phytosterolaemia, a rare inborn error o f metabolism which
was first described by Bhattacharyya and Connor (1974). The exact metabolic basis of
this disorder has yet to be elucidated but the available evidence suggests that there is an
excessive intestinal absorption coupled with reduced hepatic excretion of phytosterol.
The condition is characterised by high plasma levels of the plant sterols, sitosterol,
campesterol and stigmasterol, and the accumulation of these phytosterols in blood cells
and tissues. Tendon and tuberous xanthomas develop and episodes of haemolytic
anaemia and thrombocytopenia have also been described (Bjorkhem and Skrede, 1989).
Some patients also show reduced hepatic activity of cholesterol 7a-hydroxylase (Shefer
et a i, 1988) the rate limiting step of bile acid synthesis.
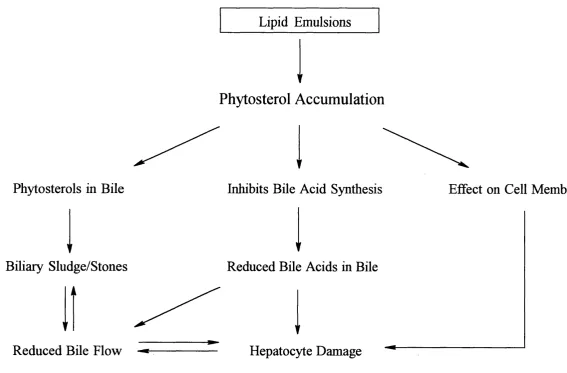
A hypothesis for the contribution of phytosterols in the development of TPN-associated
cholestasis is proposed in Figure 1-7. It is suggested that phytosterol accumulation may
interfere with bile acid synthesis in infants receiving TPN. Because many of these
patients already have a reduced bile acid synthesis rate, reduced pool size and disrupted
enterohepatic circulation, bile acid secretion may be suppressed to the point where
cholestasis occurs. These children may also have bile which has a high concentration of
phytosterol. In this situation precipitation of the phytosterol may occur leading to the
formation of sludge and stones in the biliary tree which in turn further reduces bile flow.
Finally, the accumulation of phytosterols in hepatocyte membranes may lead to
Lipid Emulsions
Phytosterol Accumulation
Phytosterols in B ile
Biliary Sludge/Stones
Reduced B ile Flow
Inhibits Bile Acid Synthesis Effect on Cell Membranes
Reduced Bile Acids in Bile
Hepatocyte Damage
1.7 Aims of the Present Study
The principal aim of the present study was to examine the hypothesis that TPN-
associated cholestasis is caused by either the phospholipid and/or phytosterol
component(s) of lipid emulsions. This hypothesis was explored by a series of ex vivo
and in vitro experiments which involved:
1. The measurement of membrane fluidity by fluorescence polarography of erythrocyte
ghosts from patients receiving TPN and with cholestatic liver disease.
2. The quantification of lipids from both cells in tissue culture and patient samples using
gas chromatography-mass spectrometry.
3. The development of a tissue culture system using cultured Hep G2 cells to study the
effect of intravenous lipid emulsions and their component fractions on cholesterol
uptake and efflux.
4. The characterisation of the structure of phospholipids in intravenous lipid emulsions
Chapter 2
Effect o f Intravenous Lipid Emulsions on the Fluidity
o f Erythrocyte M embrane Ghosts
Page
2.1 Introduction 34
2.2 Ceil Membranes 34
2.3 Regulation o f Membrane Fluidity 3 7
2.4 Theory of Membrane Fluidity 38
2.4.1 1,6-Diphenyl-1,3,5-Hexatriene 38
2.4.2 Fluorescence Polarisation 38
2.5 Materials and Reagents 41
2 .6 Methods 41
2.6.1 Blood Samples from Patients Receiving Total Parenteral Nutrition 41
2.6.2 Preparation of Erythrocyte Membrane Ghosts 43
2.6.3 Protein Determination of Erythrocyte Membrane Ghosts 43
2.6.4 Determination of Membrane Fluidity 44
2.6.5 Gas Chromatography-Mass Spectrometry of Phytosterols and Cholesterol 44
2.6.6 Measurement of Choline Containing Phospholipids 49
2.6.7 Statistical Analysis 49
2.7 Results 50
2.7.1 Erythrocyte Membrane Lipids 50
2.7.2 Plasma Lipids 55
2.8 Discussion 59
2.1 Introduction
The fluidity of biological membranes is mainly determined by their lipid composition.
Modification of the membrane lipid components may alter the structure and the fluidity
o f a membrane and as a result interfere with the function of membrane bound enzymes,
expression of receptors, cell growth and a host of other cell processes (reviewed by
Spector and Yorek, 1985). The aim of this series of experiments was to determine
whether a correlation existed between the membrane fluidity of erythrocytes and
phospholipid/ phytosterol concentrations in patients receiving long-term TPN.
2.2 Cell Membranes
The mammalian plasma membrane is composed of a lipid bilayer consisting of
phospholipids, glycolipids and sterols with protein molecules either partially embedded
or completely traversing the lipid matrix (Singer and Nicolson, 1972) (Figure 2-1).
Lipids
Phospholipids are the most abundant lipids of cell membranes. A common feature
characteristic of all types of phospholipids is their amphipathic nature. The
phospholipids of cell membranes are arranged in a bilayer such that the hydrophilic
polar head group in each layer faces an aqueous environment (extra- or intracellular
space), and the hydrophobic acyl chains arrange themselves in the middle of the bilayer.
This bilayer forms the basic structure of the membrane.
The phospholipids in a membrane bilayer can exhibit the random motions characteristic
of a liquid phase. The fatty acid tails of the molecules “wiggle” about such that the
bilayer is flexible. Furthermore, the phospholipid molecules can diffuse sideways within
their own monolayer and as a result two neighbouring phospholipids in the same
monolayer can change places with one another. However, flip-flop movements of
phospholipids between the two halves of the bilayer are infrequent as testified by the
asymmetric distribution that exists across the cell membrane. Phosphatidylcholines and
sphingomyelins are generally located in the outer monolayer of the cell membrane whilst
phosphatidylethanolamines tend to be found in the inner leaflet. Glycolipids which make
exclusively in the outer leaflet with their sugar groups exposed to the extracellular
space.
Cholesterol is the most abundant of the sterol lipids. The cholesterol molecule
intercalates itself in the phospholipid bilayer such that the hydroxyl group is facing
towards the aqueous interface whist the bulk of the molecule extends into the
hydrophobic core of the bilayer and interacts with fatty acid chains of the phospholipids.
Thus the steroid nucleus sterically blocks large motions of the phospholipid molecules
and affects their mobility.
Proteins
The proteins of biological membranes behave as specific functional molecules. They can
serve, for example, as ion pumps, gates, receptors, energy transducers and enzymes.
Membrane proteins can be classified into two categories according to their association
with the lipid bilayer. Peripheral or extrinsic membrane proteins are loosely bound to
the membrane and can be removed by relatively mild procedures that leave the
membrane intact. Examples of extrinsic membrane proteins include antigens. Integral or
intrinsic membrane proteins are the second class of membrane protein. These proteins
are embedded in the lipid bilayer of the membrane. Some only just penetrate the bilayer,
others penetrate nearly half way whilst others span the entire lipid bilayer and may even
traverse the bilayer several times. These proteins can only be removed by disruption of
the membrane with treatments such as detergent. Some integral proteins act as
transmembrane transporters or ion channels for example the sodium-glucose co
transporter.
Proteins as well as lipids can change position in the membrane. A protein can diffuse
laterally or rotate about its axis but it does not move from one side of the membrane to
the other i.e. it does not flip-flop. Indeed once a membrane protein has been inserted
into a membrane it usually retains its orientation indefinitely and thus membranes are
both structurally and functionally asymmetric.
Extracellular Space
Extrinsic Protein
Giycolipid
Phospholipid Cholesterol
Intrinsic Protein Cytosolic Space
U)
2.3 Regulation of Membrane Fluidity
The phospholipid composition of membranes is known to affect their fluidity. For
example, increasing the concentrations of phosphatidylcholines relative to
sphingomyelins results in increased membrane fluidity (Borochov et al., 1977). In mammals, phospholipids commonly possess one saturated and one unsaturated fatty
acyl chain of between 16-24 carbons in size. The length and degree of unsaturation of
these fatty acyl side chains is another major determinant of membrane fluidity (Cooper,
1977). Long chain fatty acids are able to interact more strongly (with one another) than
shorter ones and, therefore, produce less fluid membranes. This is also true of saturated
fatty acids. However, with unsaturated acyl chains the presence of cis double bonds introduces kinks which prevents the close packing of the fatty acids and thus enhances
fluidity.
Cholesterol also plays a key role in controlling membrane fluidity. It has been shown
that an increase in cholesterol concentrations relative to phospholipids decreases
membrane fluidity in both liposomes and biological membranes (Cooper et at., 1978). Thus, the cholesterol/phospholipid (C/PL) ratio has a major influence upon the physical
properties of a membrane. Mature red blood cells (RBC) are not capable of de novo
cholesterol and phospholipid synthesis and thus lack the specific adaptive processes
necessary to control membrane fluidity. Instead they depend on the lipid composition of
plasma lipoproteins (Cooper, 1977). The cholesterol and phospholipids from
lipoproteins readily exchange with their counterparts in membranes. As a result of this
exchange any changes in circulating plasma lipid composition are associated with
corresponding changes in the erythrocyte membrane composition which may affect the
membrane fluidity of the cell. The lipid emulsions used in TPN differ from the plasma
lipoproteins that normally bathe the cells in the body in that they contain significant
quantities of phytosterols whilst their phospholipids possess a greater proportion of
unsaturated fatty acids. Thus, in TPN patients receiving infusions of fat emulsions any
disturbance in the plasma lipid profile is likely to be reflected in both the composition
and membrane fluidity of their RBC. This makes the erythrocyte an ideal cell to study.
2.4 Theory of Membrane Fluidity
Membrane fluidity is a complex, ill defined concept, which in general terms can be
considered as describing the relative motional freedom of lipid molecules within a
biological membrane (Cogan and Schachter, 1981). Despite the complexities, the
measurement of membrane fluidity is often used to investigate the physical dynamics of
cell membranes. There are a number of techniques available for the measurement of
specific movements of molecules in membranes that contribute towards its overall
fluidity. For example, fluorescence recovery after photobleaching is a technique used to
measure the lateral diffusion coefficients of fluorometrically labelled membrane
components (Housley and Stanley, 1990) and electron spin resonance (ESR) has been
used to determine the rate of flip-flop of nitroxide labelled phospholipids in liposomes
and erythrocytes (Houslay and Stanley, 1990). There are also a range of methods that
provide information on the overall degree of mobility or fluidity o f membrane bilayers.
For instance the melting or transition of bilayers from the crystalline to the liquid
crystalline phase with change in temperature can be followed using differential scanning
calorimetry. The mobility of molecules at various depths in membrane bilayers may be
measured using nuclear magnetic resonance (NMR) or by fluorescence polarisation
techniques that utilise labelled phospholipids or probes incorporated into a bilayer. In
this study, fluorescence polarisation using 1,6-diphenyl-1,3,5-hexatriene (DPH) as the
probe was used as a measure of membrane fluidity.
2.4.1 1,6-Diphenyl-1,3,5-Hexatriene
Fluorescence probes (ftuorophores) are often employed to obtain information regarding
molecular interactions within membranes. One of the most common fluorescence
probes used in fluidity studies is DPH (Figure 2-2a). Like other hydrophobic probes,
DPH is insoluble in water and so it partitions into the hydrophobic interior of biological
membranes and lipid bilayers. Most of the DPH molecules orientate themselves parallel
to the phospholipid acyl chains although, a minority are orientated perpendicular to the
membrane surface (van Ginkel, 1989).
2.4.2 Fluorescence Polarisation
different directions) is a measure of the degree of movement (rotation) of an extrinsic
fluorophore. Fluorophores fluoresce when excited by light of a specific wavelength,
which corresponds to a peak in their absorption spectrum (Schachter, 1984). Excitation
of a “static” fluorophore with polarised light results in the emission of light which is
also polarised. However, once incorporated into a biological membrane the fluorophore
is free to rotate. If the probe rotates during the lifetime of this excited state then the
emitted light will be depolarised. This rotation is in turn directly influenced by the
structural order of the membrane i.e. the resistance of the membrane to the probe’s
movement (van Ginkel et al., 1986). Thus, the degree of depolarisation of emitted light can be used as a measure of the rotation of the probe which in turn is related to its ease
of movement in the membrane. Figure 2-2b is a representation of the excitation and
emission of a fluorophore such as DPH. Excitation of the fluorophore parallel to the
plane of polarisation will result in emission of light polarised in the same direction
unless the fluorophore rotates. The degree of depolarisation of the emitted light can be
measured by positioning an emission polariser both at right angles parallel (Iw ) and
perpendicular ( I v h ) to the plane of polarisation of the excitation light. Steady-state
anisotropy (rs) is the ratio of intensities of the polarised component of emitted light to
the total emitted light and is determined from the equation below;
rs = Iw - Ivh
Iw + 2 I v h
where:
rs = Steady-state anisotropy
Iv h = Intensity of light when both the excitation and emission polarisers are vertically
positioned.
Iw = Intensity of light when the excitation polariser is in the vertical position and the emission polariser is horizontal.
The steady-state anisotropy is inversely related to the fluidity of a membrane.
a)
b)
Rotation ofProbe
V
Plane ofPolarisation
Ivh
Excitation Light
Figure 2-2. a) Structure of 1,6-diphenyl-1,3,5-hexatriene.
2.5 Materials and Reagents
Isotonie lOmM phosphate buffered saline (PBS) pH7.4, Img/ml bovine serum albumin
(BSA) protein standard, bicinchoninic acid (BCA), 1,6-diphenyl-1,3,5-hexatriene
(DPH), 5a-cholestane, cholesterol, campesterol, stigmasterol, sitosterol, fucosterol and
tétraméthylammonium hydroxide in methanol were all purchased from the Sigma
Chemical Company (Poole, UK). Di-sodium hydrogen orthophosphate 2-hydrate,
sodium di-hydrogen orthophosphate 1-hydrate and copper sulphate 5-hydrate were
purchased from BDH Laboratory Supplies (Poole, UK). HPLC grade propan-2-ol and
tetrahydrofuran were bought from Merck Chemical Ltd., (Lutterworth, UK).
Tetrachloroethylene and methylbutyrate were purchased from the Aldrich Chemical
Company, (Gillingham, UK). Tri-sil was purchased from Pierce (Luton, UK) and the
phospholipid kit from Boehringer Mannheim (Lewes, UK).
2.6 Methods
2.6.1 Blood Samples from Patients Receiving Total Parenteral Nutrition
Eight patients, two male and six female, aged between 4 and 27 months were studied
(see Table 2-1 for details). All the patients were hospitalised and were receiving 20%
Intralipid. Three of the eight patients showed biochemical evidence of severe cholestatic
liver disease (aspartate aminotransferase (AST), >200Units/L [normal: 20-60]; total
bilirubin >100pM [normal: <17]). These patients were being considered for gut-liver
transplantation. Another four patients had only mild elevations of liver function tests.
One control patient was studied who was receiving TPN but who appeared to show no
signs o f liver disease. Three other controls used for the study were healthy adult
volunteers from the Biochemistry Unit, Institute of Child Health. Samples of l-2ml of
fresh venous blood were drawn from patients and control subjects into lithium heparin
tubes.
Table 2-1. Details of Patients Receiving TPN
Patient Number
Sex Age AST
(Months) (Units/L)
Bilirubin (^M)
Presenting Condition
Severe Liver Dysfunction
1 F 20 656 534 Gut failure
2 F 9 627 148 Short gut
3 F 16 403 482 Gut failure
Mild Liver Dysfunction
4 F 17 167 2 2 Enteropathy
5 M 27 62 8 Bone marrow
transplant
6 F 4 60 65 Necrotising
enterocolitis
7 F 10 81 7 Gastrectomy
Controls
8 M 23 42 12 Bone marrow
transplant
9 M
10 M Normal Adult Controls
2.6.2 Preparation of Erythrocyte Membrane Ghosts
Erythrocyte ghosts were prepared by a modification of the method of Burton et al.
C ^ - G O a )
(1981). Whole blood samples were centrifuged at 2000fpm for 5 minutes and the
plasma removed. The erythrocytes were then washed three times with 2ml isotonic
lOmM phosphate buffered saline (PBS) pH7.4. (Note: PBS was isotonic to body fluids
and consisted of lOmM Na2HP0 4/NaH2P0 4 buffer; 138mM NaCl and 2.7mM KCl at
pH7.4). Membrane ghosts were prepared by the lysis of 250-1 OOOjiil RBC. The
erythrocytes were diluted 1:5 volume/volume (v/v) with chilled 2.5mM phosphate
buffer pH8.0 and stirred for 15 minutes. The erythrocyte ghost pellet obtained after
centrifuging at 18000rpm for 20 minutes at 4°C was then washed and centrifuged twice
more with 5ml 1.25mM phosphate buffer pH8.0 as above. This removed the
haemoglobin i.e. pellet was creamy white to the naked eye. The red cell ghosts were
then resuspended in 500pl isotonic lOmM PBS pH7.4 gassed under nitrogen gas and
stored at -20“C. To minimise any potential effects of storage and inter-assay variation
all samples were studied on the same occasion and within 2 months of preparation.
2.6.3 Protein Determination of Erythrocyte Membrane Ghosts
This method was based on the bicinchoninic acid (BCA) method of Smith et al. (1985). The method combines the biuret reaction with unique characteristics of BCA. In the
reaction proteins react with alkaline Cu^^ to produce Cu^. Two molecules of BCA then
react with one cuprous ion to produce an intense purple colour from which the
spectrophotometric quantitation of protein in the aqueous solution can be determined.
All assays were carried out in duplicate. A standard curve was prepared containing 5-
50|ig of 1 mg/ml BSA standard in 50p,l distilled water. For samples 5pi RBC membrane
preparation was diluted to 50pl with distilled water. After the addition of 1ml BCA the
samples and standards were incubated at 37”C for 10 minutes. 20pl o f copper sulphate
solution was added and the samples incubated at 37°C for at least 20 minutes. The
absorbance was then read at 562nm and the protein concentration of the sample in
pg/pl was calculated from the standard curve.
2.6.4 Determination of Membrane Fluidity
A 2mM stock solution of DPH in tetrahydrofuran was stored in the dark at -20°C. A fresh 0.5fj,M working solution was made by diluting the stock DPH solution 1:4000
(v/v) with isotonic lOmM PBS pH7.4. This was kept in the dark at 4°C and stirred for
at least 2 hours prior to use to ensure adequate mixing. A 50pl aliquot of the red cell
ghost suspension was incubated with 2ml O.SpM DPH at 37°C for Ihour. Fluorescence
was then measured in a 1cm cuvette heated to 37“C in a Perkin-Elmer LS3 fluorimeter
using an excitation wavelength of 360nm and an emission wavelength of 430nm. Four
measurements were made with each sample i.e.vertical (0°) and horizontal (90°)
polarised excitation with either vertical (0°) or horizontal (90°) polarisation of the
emission filter. Steady-state anisotropy was then determined using the equation:
0 90) (9 0 0
Ô" W I V %
rs
0 90/ I 0 90
Blank readings of the fluorescence 5pM DPH in isotonic lOmM PBS pH7.4 without
membranes were made in an identical manner and subtracted from readings given by
DPH and membranes for each polariser setting. Due to a limited amount of material it
was not possible to take blank readings of membranes incubated in PBS without 5pM
DPH. However, validation studies previously undertaken in the Biochemistry Unit,
showed that the fluorescence produced by these samples was negligible.
2.6.5 Gas Chromatography-Mass Spectrometry of Phytosterols and Cholesterol
Plasma total (free and esterified) phytosterol and cholesterol concentrations were
measured by gas chromatography-mass spectrometry (GC-MS) by the method of
Clayton et al. (1993). The procedure which used 5a-cholestane as the internal standard (ISTD) is shown schematically in Figure 2-3.
Sterol Extraction
1ml of a saponification mixture containing 0.0372mg 5a-cholestane, mixed with 0.25ml
Plasma
Saponify (5a-choles
2nd
Extract ane, ISTD)Total Sterols
Concentrate îind Derivatise
Analytical Sample
GO -MS
Response Ratio
Compare with (Calibration Curve
Sterol Quantitation
Figure 2-3. Quantitation of phytosterols and cholesterol by GC-MS.
was added to 2 0 0|al of plasma and then heated at 80°C for 15 minutes. The saponified
sterols were then extracted by the addition of 500|il tetrachloroethylene/methylbutyrate
1:3 (v/v) and 2ml distilled water. After centrifuging at 2000'ipm for 10 minutes, lOOpl
of the tetrachloroethylene/methylbutyrate lower phase was taken and dried down under
vacuum at 60°C.
GC-MS o f Phytosterols and Cholesterol
Trimethylsilyl ethers of sterols were made by derivatising with 200^1 of Tri-sil and
heating at 60°C for 1 hour. These derivatives are formed by replacing the active
hydrogen of the C3 hydroxyl group of the sterols with a trimethylsilyl group (Si(CH3)3).
Using a splitless technique, Ipl was injected into a Hewlett-Packard 5890 Series II gas
chromatograph containing a 0.25 mm ID 30m fused silica column lined with a 0.25p.m
film thickness of D Bl. After a delay of 2 minutes with the oven at 120°C, the oven
temperature was ramped to 200°C at 20°C/min and then to 300°C at 2°C/min. The gas
chromatograph was coupled to a Hewlett-Packard 5970 mass-selective detector and
Chem Station data system. The ionisation energy was 70eV and the source temperature
was 170°C. A typical GC trace of plasma phytosterols is shown in Figure 2-4.
Sterol Standards and Calibration Curves
ImM solutions of each sterol and internal standard were made up in propan-2-ol. A
standard curve of 5-lOOOpM was constructed by addition of the appropriate amounts of
each sterol and ISTD in a total volume of 200pl. Standards were dried down under
vacuum at 60°C, derivatised and analysed by GC-MS as described above. Quality
control was performed by running a calibration curve for each sterol with each batch of
analysis. Calibration curves based on the ion currents ratios of the sterol of interest to
ISTD were linear for concentrations upto ImM. A typical calibration curve for
sitosterol is shown in Figure 2-5. For quantitation of the sterols in samples the mass
spectrometer was operated in selected ion monitoring (SIM) mode. The following ions
were used, 5a-cholestane, mass/charge ratio (m/z) 372; cholesterol, 458; campesterol,
382; stigmasterol, 484; sitosterol, 396; and iso-fucosterol, 386. The response ratio of
4^
1.8e+5
1.6e+5
1.4e+5
1.2e+5 -(U
o
l.Oe+5 -§
1
< 8.0e+4
6.0e+4
4.0e+4
2.0e+4
-0 -r
20
ISTD
l
L
—I 1---1---1---1---- 1---1---- 1---r
25 30
- I 1---1---1---1---1---1--- 1--- 1--- 1--- 1---1---1---r
35 40 45
Time (Minutes)
^---- 1---- 1---- 1---1---1---- 1---- 1--- 1— 1---- r1
50
r
55
—r
60
«J
c o
Q-C / 5
D
2. On
0.5-0.0
0 250 500 750 1000
Concentration of Sitosterol (|oM)