Comparative Analysis on Algorithm that can
be used for Stock Market Prediction
Abhishek Kapratwar, Ahad Patel, Rushikesh Helwade, Nikita Khandagale, Prof. Amol Kamble StudentatModern Education Society’s College of Engineering Pune, 19, Late Prin. V.K. Joag Path, Wadia
College Campus, Off, Bund Garden Rd, Pune, Maharashtra 411001, India.
StudentatModern Education Society’s College of Engineering Pune, 19, Late Prin. V.K. Joag Path, Wadia College Campus, Off, Bund Garden Rd, Pune, Maharashtra 411001, India.
StudentatModern Education Society’s College of Engineering Pune, 19, Late Prin. V.K. Joag Path, Wadia College Campus, Off, Bund Garden Rd, Pune, Maharashtra 411001, India.
StudentatModern Education Society’s College of Engineering Pune, 19, Late Prin. V.K. Joag Path, Wadia College Campus, Off, Bund Garden Rd, Pune, Maharashtra 411001, India.
ProfessoratModern Education Society’s College of Engineering Pune, 19, Late Prin. V.K. Joag Path, Wadia College Campus, Off, Bund Garden Rd, Pune, Maharashtra 411001, India.
Abstract
Stock market keeps on changing with time and making prediction of stock market has proven to be one of the major problems of the financial industry. The traditional method for making predictions of the stock market is with the help of data mining techniques. In this paper the aim is to cover the various algorithms that are already being used for making prediction of stock market. The paper gives an idea about how different machine learning algorithm such as the SVM, Regression, ARIMA, Random Forest, Decision Tree are used for making predictions and also tells how the various Neural Networks that have been employed to help predicting stock market trends. The paper also contains a proposed idea of using Naïve Bayes algorithm for making stock market prediction.
Keywords - Stock Market Prediction, Supervised Learning, Classification, Regression, Naïve Bayes.
I. INTRODUCTION
Stock market is an integral part of the financial industry. The two techniques to predict stock market is either to predict future price values of a stock or to predict future price direction of stock. Many of the big giants of the industry such as Facebook, Apple, Microsoft have special people appointed just to keep a watch and do analysis on the trends of the stock market. But it is also known that stock market is extremely expensive and complicated in itself. Several factors affect the stock market such as news related to the loss, profits and possible earnings in the near future of a company, introduction of any new product by the company in near future, stability of market, economic growth etc. Stock market has a very prominent role in expansion of today’s industry’s which in turn leads to the growth in the economy of the nation. Any individual or organization would be keen to know whether the stock value of a particular company will fall or rise over a period of time so that it will help them in
making their decision whether to invest in that particular company. For many organizations or companies stock market is a vital source to raise business funds for the expansion of their businesses.
Apart from the traditional methods such as outlier detection[4] there are various machine learning algorithms that are discussed in this paper, section I explains how decision tree and random forest algorithms are used for making stock market prediction and how with multiple decision trees a random forest is built which increases the accuracy of making predictions. But for combining multiple decision tree and forming a random forest is complicated process and it is error prone [8]. To solve this issue of combining multiple decision tree and forming a random forest, a method known as LSboost is used which is explained in section II. Section III explains the most common method that is used for making prediction in financial sector which is ARIMA. In section IV the limitations of only using ARIMA and a hybrid model that can be used to overcome these limitations are explained. The techniques that are employed in making predictions of stock market trends with ANN and its types and these are explained in section V. And finally, in section VI, how one can learn an optimal naïve Bayes network is discussed. And also, what are the area is in which the related work is classified.
1. Section I
Random Forest is a renowned machine learning algorithm that is used for supervised learning
[16]
classifier is not that much suitable to classify the test data correctly.
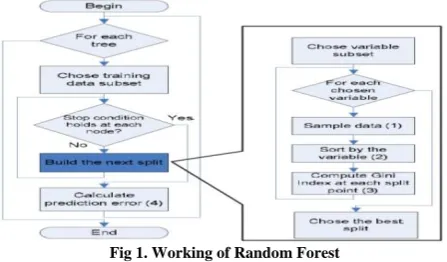
From the dataset a set of k bootstrap of samples D is created. Using sampling with replacement, samples of the same size are created for Bootstrap [6]. Sampling with replacement states that elements of samples can be used many times and a single element can be appeared in many samples. Then a decision tree is constructed by choosing randomly selected features for each Bootstrap sample. Random forest uses these generated Decision Trees which are constructed from the selected attributes to predict the class label of unknown tuples. Most of the times the CART (Classification and Regression Tree) algorithm is used for making multiple decision trees
[13]
.
Using Random Forest results in various benefits such as parallelism. The performance of Random Forest is better than other methods such as Adaboost and can easily work on noisy data which contains outliers. Also, Random Forest is faster than Boosting and Bagging. The working of Random Forest is shown in fig 1.
Fig 1. Working of Random Forest
2. Section II
Support Vector Machine is also a renowned Machine learning algorithm that is used for stock market prediction and it is a type of regression analysis. In case of the stock market prediction the datasets are highly variable and hence a single regression model is not ample to make the prediction and hence an ensemble of various regression models are used to generate prediction. The result which is generated from such ensemble of various regression model is generally gives a more accurate result in comparison to a single one. So, for this reason in the random forest, the input dataset is made to fit in different subsets by making use of the CART (Classification and Regression Tree) algorithm and the combined result of the forest is used for making the prediction. The random forest also calculates the weights of the autonomous variables which is then used to model the dependent variables. But the Mean Squared Error (MSE) in random forest which is also known as the training loss function tends to give poor assessment in some cases.
Hence to eliminate the drawbacks that are present in the MSE, LSboost can be used as a
substitute. The LSboost is a type of gradient boosting technique [3]. Gradient boosting is widely used in classification and regression problems and it is type of machine learning algorithm. In LSboost the training loss function helps in improving the assessment and also makes better prediction. Also, it is used to reduce the variance and also the overfitting of the decision tree.
3. Section III
ARIMA (AutoRegressive Integrated Moving Average) model is a linear technique of regression which is especially used for the purpose of analysis and prediction of time series data. ARIMA [5] explicitly creates set of structures in time series data for providing effective method for forecasting. This model is generally applied to static (stationary) time series. In the case if the data is not static (stationary) time it mostly contains randomness then data is differentiated until it gets converted to stationary [14]. ARIMA involves five steps:
1. Visualize the time series 2. Stationaries the series 3. Find optimal parameters 4. Build ARIMA model 5. Make prediction
Some parameters of ARIMA are p: number of lag terms of AutoRegressive model, d: degree of differentiation, q: moving average order.
4. Section IV
To make predictions regarding the behaviour of the stock market prices is not easy as the data of stock market has both linear as well as non-linear patterns, so there arises a need to of a hybrid method that can handle both the linear and non-linear patterns efficiently and this hybrid method can be useful in making predictions about the stock market more efficiently. As know, ARIMA is a linear technique which are used in forecasting the time series. But the non-linear patterns cannot be easily understood by the ARIMA. For solving this problem of non-linear pattern estimation SVM (Support Vector Machine) is used [1].The ARIMA model considers the future value of a variable as a linear consolidation of the past value and past error. It can be considered as a data-oriented approach. But if there is any non-linear pattern in dataset then it may limit the performance of the ARIMA. SVM follows the SRM (structured risk minimization) principle [12]. SVM’s try to diminish the upper bound of generalization error rather than minimizing the upper bound of empirical error. The SVM’s usually achieve the regression function by using a set of greater dimensional linear function.
II. WORKING
ARIMA is used to predict the stock prices of companies[15]. The SVM model has three parameters namely: α, ε, and C and these are adjusted based on the validation set. In this hybrid model the ARIMA works as the pre-processor to filter out the linear data patterns form the dataset and then the errors that are generated in the ARIMA is given as an input to the SVM. The SVM’s are used to reduce these error terms generated in the ARIMA.
5. Section V
In this current day the neural networks are said to be most commonly used method for data mining in different areas like business, science, etc. The most common application of the neural network is in the prediction systems due to their characteristics. Old methods like regression (logical regression, linear regression) are called as model based whereas neural network is based on training data so they are called as self-adjusting method which uses small knowledge and without adding more assumptions on prediction model. The generalization property of neural network makes them recognize new patterns without contained themselves in training data.
Most efficient method in neural network is termed as ANN. Whereas NN is complex concept which can be seen as black box, because it allows to view input and output of NN without having internal knowledge. Number of simple processing units are operated in parallel in NN.
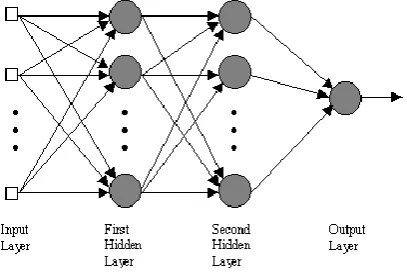
The feed forward network is constructed using various kind of neurons in which starting layer is attached to input data followed by two or more middle layers which are termed as hidden layers and finally the last layer is attached to output data or results. The back-propagation technique takes input as training vector from training dataset and transfers this data through input layer to output layer. The error is computed and transferred backward to correct the connections weight [7].
In this suggested model two mode of neural networks is used which are a multilayer perceptron feed forward and Elman recurrent. To train both the networks back propagation algorithm is used. This model can be perceived as time series model of prediction. The working of ANN is shown in fig 2.
FIG. 2: Working of ANN
The suggested model makes use of three-layer neural network which has input three-layer of 3D neurons which are lowest, average and highest stocks. In next layer that is hidden layer consist of h neurons which are attached to input layer and output layer. Finally, single neuron of output layer predicts stock value for next day.
III. TYPES OF ANN
A. TDNN
For the prediction of stock market trends feed forward multilayer perceptron’s are used as TDNN in which the finite impulse response represent the internal weights. This helps in building a memory that can be used for time series prediction[2] . The goal of this is actually to anticipate the trend in stock market and not the price, and this can be expressed as pattern classification problem. In this the output “1” indicates an ascending flow of 2% or more, where as an output of “-1” assimilate to a descending flow or ascending flow that is less than 2%.
There are various methods to train the TDNN one of them is converting the network to a static network and unfold it in time. But this method creates redundant weights and it’s a drawback of this method and hence it requires a technique called as the bookkeeping to avoid these redundant weights and to add to it this method also doesn’t have any symmetry between the backward and forward propagation. One other method to train the TDNN is temporal backpropagation. In this method while minimizing the total cost, the dependency of the future step cost is added to the current step state.
B. PNN
This is an algorithm that is used for approximating the Bayesian decision rule. The PNN is a feedforward NN, and this is frequently used for pattern recognition and classification. In PNN, for each class the parent probability distribution function (PDF) is calculated by PARZEN window and a non-parametric function. And then with the help of this PDF, for the new input data the class probability is predicted and then a Bayesian rule is used of to assign the class which has the maximum posterior probability to the input data. The main idea behind using this technique is that it can be assumed that the stock market price series to be made out of cycles which are of different frequency. If the data is sampled out that are present at different frequency, these sample will carry all the data in series. Hence, to achieve this, sample block of data can be made use of. The more far the box is in the past, the more it is dispersed from the next block and due to this the box size will get larger.
C. RNN
directed graph that is along a sequence. RNN in general are used for voice recognition or handwriting recognition. But here for the purpose of predicting the stock market trend it is considered as a discrete-time recurrent multilayer perceptron. This type of network has the advantage of temporal representation that can be superior than purely feedforward networks. Beside this the RNN is adequate for representing and encoding the states that are deeply hidden.
D. Comparison between TDNN, PNN and RNN
It is probable to restrict the false alarm rate and it can also be reduced to zero, in case of PNN it can be done through the loss factor and in TDNN and RNN it can be done through penalty factor. The TDNN can be considered as moderate in regards to the implementation complexity and also the memory needs. The PNN has the leverage of intense implementation complexity and also has a low false alarm rate even for stocks which are having low monotony. The only small disadvantage it has is of the memory requirements. The PNN is adversely suited for stocks that do not require the training on the long historical data for example the PNN can be used efficiently to predict the trends in Apples stock. In case of RNN it has the competence to dynamically embody the past understanding due to intramural recurrence and it can be considered the most compelling among the three. Unlike the TDNN, RNN doesn’t need that much memory but it has a small disadvantage which is its implementation complexity.
6. Section VI
A Bayesian network is skeletal model and it contains a set of provisional probabilities. The skeletal model is a directed graph that contains nodes and edges where the nodes depict attributes and the edges depict the dependency between the attributes. The Bayesian network is usually used for classification, in which the learning element tries to build a classifier from training dataset. The straightforward design of Bayesian network is the Naïve Bayes. The conditional independence hypothesis is barely true in real life, and this could hamper its performance in real life application that may have complicated dependencies.
The Tree-augmented Naïve Bayes (TNB) is considered as an increment of tree-like Naïve Bayes in which nodes precisely point to all other nodes and a single node is allowed to have only one parent from other node[11]. In the Bayesian network classifier, the TAN can be considered as a distinct case in that the class node points beeline to the other entire attribute nodes and it does not have any constrain on the arch among the attribute nodes. The utmost sluggish process in learning the Bayesian network is learning the structure. The main problem with TAN is that only a single parent is permitted for every attribute, and this leads to ignoring the influence of other attributes.
In the Hidden Naïve Bayes (HNB), for each and every attribute a hidden pattern is built that incorporates the impact of all the other attributes. The results of this paper show that the HNB can be better suited for classification, class probability reckoning, ranking in contrast to Naïve Bayes.
To relax the assumption of conditional independences of the Naïve Bayes adequately, there is need of an apt language and adequate machinery that will help represent and manipulate it in the independence assertion. Both these things are provided by the Bayesian network. But it has been verified that learning an optimal Bayesian network is NP-hard. So, in order to bypass these uncompromising difficulties for learning the Bayesian network, learning-improved Naïve Bayes has gained much scrutiny. The analogous work to this area can be predominantly classified into five groups.
IV. FIVE GROUPS OF RELATED WORK
A. Structure extension
In the real word data-mining application the assumptions can be unrealistic. And hence, spanning the design of Naïve Bayes using directed arcs to notably show attribute dependencies can be seen as a natural way to relax the unrealistic assumptions.
B. Feature Selection
This approach helps to enhance Naïve Bayes by abolishing the extravagant or insignificant attributes from the dataset, and selects only those attributes that are most explanatory in learning a task. The main challenge in this approach is selecting the attribute that is most informative for learning, for this there are various feature selection algorithms have been developed.
C. Attribute weighting
In feature selection approach the least informative attribute is completely ignored from the attribute space but in attribute weighting each attributes weight is weighed differently with regards to its contribution to classification.
D. Local Learning
In the local learning accession, the key idea is of piling a Naïve Bayes on subset of training dataset rather than the whole dataset. Here the attribute independence hypothesis of the Naïve Bayes is considered to be broken with regards to the whole training data. But it can be anticipated that the dependencies within the local training data are weaker than that of the whole training data. And hence, the Naïve Bayes can work better on local training data than the whole training data.
E. Data expansion
which is due to dearth of training data. When the training data is not large enough, the prime dissemination would not be distinctly emulated. Thus, if more training data is made available if it has same pattern, the prime dissemination would be augmented in the training data, which could in turn lead to more efficient learning. And thus, adding more data pattern to training data is called data expansion, which could be useful in learning the algorithm more easily. But to add more data pattern to the training data the underlying dissemination should be known, which is not that easy in real life situation.
F. Hidden Naïve Bayes
The motivation here is to build a novel model which can elude the unmanageable computational ramification for learning an optimal Bayesian network and still consider the influence from all attributes into consideration. The idea here is to construct a hidden parent for each attribute, which incorporates the leverage from all other attributes. The model is thus called the hidden naive Bayes (simply HNB).
7. Section VII
The Naïve Bayes classifiers is not just a single class of classifier but actually they are a family of classifier that are based on the same principle which is, each of the feature that is being classified is not dependent on the other feature that is being classified by the classifier. The Naïve Bayes is a probabilistic classifier [9].
For the proposed system historical data would be collected which is available on various websites, then on this data the Naïve Bayes algorithm will be applied in order to get predictions. Now, knowing that the Naïve Bayes algorithm considers each variables probability of contribution for prediction independently, it might be beneficial, as stock market relays on various factors that affect it and with the help of Naïve Bayes the more influential factor can be made known and also the predictability of Naïve Bayes algorithm is considered as the highest amongst the other predication algorithms.
In order to automate the mechanism of collecting the data related to stock market on which the predication is to be made, various libraries that are available in python can be made use off. The final outcome of the system will be a statistical representation which might be in the form of pie chart, bar graph, or line graph of the prediction made by the Naïve Bayes algorithm.
REFERENCES
[1] Ping-Feng Pai∗, Chih-Sheng Lin,“A Hybrid ARIMA and Support Vector Machines Model in Stock Price Forecasting”, Omega-The International Journal of Management Science, 16th September 2004.
[2] Emad W. Saad,Danil V. Prokhorov, Donald C. Wunsch, “Comparative Study of Stock Trend Prediction Using Time Delay, Recurrent and Probabilistic Neural Networks”, IEEE TRANSACTIONS ON NEURAL NETWORKS, 6th
November 1998.
[3] Nonita Sharma, Akanksha Juneja “Combining of Random Forest Estimates using LSboost for Stock Market Index Prediction”, 2nd International Conference for Convergence in Technology (I2CT),2017.
[4] ZhaoLei, Wang Lin “Price Trend Prediction of Stock Market Using Outlier Data Mining Algorithm”, IEEE Fifth International Conference on Big Data and Cloud Computing,2015.
[5] AakankshaSharaff, Meenakshi Choudhary, “Comparative Analysis of Various Stock Prediction Techniques”, International Conference on Trends in Electronics and Informatics, 2018.
[6] T.Manojlović, I. Štajduhar, “Predicting Stock Market Trends Using Random Forests: A Sample of the Zagreb Stock Exchange”, MIPRO 2015, 25-29 May 2015.
[7] MahdiPakdamanNaeini, HamidrezaTaremian, HomaBaradaran Hashemi, “Stock Market Value Prediction Using Neural Networks”, International Conference on Computer Information Systems and Industrial Management Applications, 2010.
[8] Indu Kumar, Kiran Dogra, Chetna Utreja, Premlata Yadav, “A Comparative Study Of Supervised Machine Learning Algorithms For Stock Market Trend Prediction”, International Conference on Inventive Communication and Computational Technologies, 2018
[9] Liangxiao Jiang, Harry Zhang, and Zhihua Cai, “A Novel Bayes Model: Hidden Naive Bayes”, IEEE TRANSACTIONS ON KNOWLEDGE AND DATA ENGINEERING, OCTOBER 2009.
[10] ENGINEERING, OCTOBER 2009.
[11] Binoy B. Nair, N.MohanaDharini, V.P. Mohandas, "A Stock market trend prediction system using a hybrid decision tree-neuro-fuzzy system", International Conference on Advances in Recent Technologies in Communication and Computing, 2010.
[12] Umadevi.K.S, AbhijitsinghGaonka, Ritwik Kulkarni, R. Jagadeesh Kannan, "Analysis of Stock Market using Streaming data Framework", ICACCI, September 2018. [13] Li Xiong, Yue Lu, "Hybrid ARIMA-BPNN Model for Time
Series Prediction of the Chinese Stock Market", International Conference on Information Management, 2017.
[14] Mr. Rupesh A. Kamble, "Short and Long Term Stock Trend Prediction using Decision Tree", International Conference on Intelligent Computing and Control Systems, 2017.
[15] Ayodele A. Adebiyi., Aderemi O. Adewumi, Charles K. Ayo, "Stock Price Prediction Using the ARIMA Model "International Conference on Computer Modelling and Simulation, 2014
[16] Jung-Hua Wang, Jia-Yann Leu, "Stock Market Trend Prediction Using ARIMA-based Neural Networks", International Conference on Neural Networks, 2002. [17] Prof. Dr. Kamran Raza, "Prediction of Stock Market