ESTIMATION OF LAND SURFACE
TEMPERATURE TO STUDY URBAN
HEAT ISLAND EFFECT USING
LANDSAT ETM+ IMAGE
*K. SUNDARA KUMAR1, Dr. P. UDAYA BHASKAR2, Dr. K. PADMAKUMARI3
1
Research Scholar, Dept of Civil Engg, JNTU-Kakinada, E.G, Andhrapradesh, India
2
Principal, College of Engineering, JNTU-Kakinada, E.G, Andhrapradesh, India
3
Associate Professor, Dept. of Civil Engineering, JNTU-Kakinada, E.G, Andhrapradesh, India *[email protected]
Abstract
The urban air temperature is gradually rising in all cities in the world. One of the possible causes is the drastic reduction in the greenery area in cities. The distinguished climatic condition termed ‘Urban Heat Island’ (UHI) is developing in the rapidly urbanized cities. Vijayawada city of Andhrapradesh is experiencing rapid urbanization that has resulted in remarkable UHI. Understanding the distribution of Land Surface Temperature (LST) and its spatial variation will be helpful to decipher its mechanism and find out possible solution. This study tries to investigate and identify land use types which have the most influence to the increase of ambient temperature in Vijayawada city. For the present study Landsat ETM+ images of 2001 was obtained from USGS for the study area. Using bands 1-5 and 7 of the pre-processed images the land use / cover pattern was mapped by supervised classification with the maximum likelihood classification algorithm of ERDAS imagine 9.1 software. Five classes considered for the study are Built-up land, Barren Land, Water bodies, Agricultural fields and Vegetation. Normalized Difference Vegetation Index (NDVI) image was developed. The digital number of thermal infrared band is converted in to spectral radiance using the equation supplied by the Landsat user’s hand book. The effective at-sensor brightness temperature is obtained from the spectral radiance using Plank’s inverse function. The surface emissivity based on NDVI classes is used to retrieve the final LST. It was noted that maximum air temperature was observed in built up areas of the city and minimum temperatures are observed in areas where vegetation cover is more. Urban heat island phenomenon is evident from the LST images. NDVI is found to have negative correlation with LST. The study reveals that appropriate strategies are necessary for the sustainable management of the urban area.
Key words: Urban Heat Island, Land Surface Temperature, Land Use/Cover, NDVI
1. INTRODUCTION
Urban growth and sprawl have severely altered the biophysical environment. Rapid urbanization has significant influence on different aspects of the quality of life and research in determining the patterns of urbanization and quantifying their impacts is the need of the hour. Unplanned urbanization an urban sprawl will directly affect the land use and land cover of the area. The changes in land use/cover include loss of agricultural lands, loss of forest lands, increase of barren area, increase of impermeable surface of the area because of the built up area, etc. Development of land use land cover is very much useful to the city planner and policy makers. For the sustainable urban ecosystems the amount of land required for growing the vegetation can be estimated from these studies. One of the major implications of urbanization is increase of surface temperature and development of Urban Heat Island. Surface temperature is increased by anthropogenic heat discharges due to energy consumption, increased land surface coverage by artificial materials having high heat capacities and conductivities, and the associated decrease in vegetation and water pervious surfaces which reduce the surface temperature through evapotranspiration. Landsat ETM images are widely used to observe and model the biophysical characteristics of the land surface. In addition to the development of Land use/cover maps band 6 of the Landsat imagery is useful for deriving the surface temperature.
and Land Cover Changes in Mississauga using Landsat TM images.[2] Tamilenthi1, J. Punithavathi1, R. Baskaran1 and K. Chandra Mohan have studied the dynamics of urban sprawl, changing direction and mapping using a case study of Salem city, Tamilnadu, India.[3] H.S. Sudhira, T.V. Ramachandra and K.S. Jagadish , studied about Urban sprawl metrics, Land cover dynamics and modelling using GIS for Udupi Mangalore.[4] M. Turker and O.Asik studied Land Use Change Detection At The Rural- Urban Fringe Using Multi-Sensor Data In Ankara, Turkey.[5] Bassam Saleh and Samih Al Rawashdeh studied about Study of urban expansion in Jordanian cities using GIS and RS[6]. Javed Mallik, Yogesh Kant and B.D.Bharath estimated land surface temperature over Delhi using Landsat-7 ETM+ [7].
2. STUDYAREA
Vijayawada is a historical city situated at the geographical centre of Andhra Pradesh state in India on the banks of Krishna River with latitude 160311 N and longitude 800 391 E. The climate is tropical, with hot summers and moderate winters. The peak temperature reaches 47 °C in May-June, while the winter temperature is 20-270 C. The average humidity is 78% and the average annual rainfall is 103 cm. Vijayawada gets its rainfall from both the south-west monsoon and north-east monsoon. The topography of Vijayawada is flat, with a few small to medium sized hills. It is also a major railway junction connecting all states in the country. The Vijayawada city is the commercial capital of the state of Andhrapradesh. The city’s population is expected to increase to 16.5 lakh by 2021.With ever increasing population and unprecedented growth of urban area the city’s landscape is undergoing unwanted changes. Urban Heat Island is one of the upcoming urban climatological problems developing in the city. Build up of such excess heat in the urban area due to reduced vegetative cover and increased built-up surfaces with concrete, asphalt, etc. Because of these phenomena certain parts of the urban area of the city are becoming extremely hot during day time and particularly during summer seasons, causing lot of discomfort to the citizens. The present study attempts to find the relation between the land use/cover and land surface temperature of Vijayawada city. The geographical location study area of Vijayawada is shown in Fig. 1.
Fig.1 Location of the Study Area
3. METHODOLOGY
For the present study the following methodology is adopted which involves satellite data collection, classification of the imagery, development of land use/cover maps, preparation of NDVI maps, retrieval of Land Surface Temperature maps and correlation studies. These are briefly outlined here.
DATA COLLECTION
Table.1 : Details of Landsat data collected
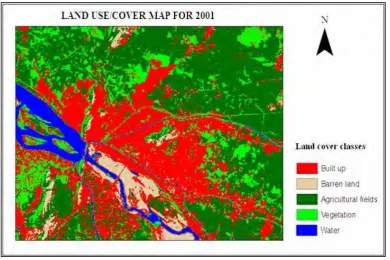
The Landsat satellite image of the study area down loaded for the year 2001 is shown in the Fig.2 below. The study area is obtained by sub setting the image with a rectangular area of interest (AOI). The reason for selecting rectangular AOI is to include the non urban and agricultural/vegetative areas in the study area so that the variation of temperature can be seen clearly.
Fig.2 Landsat ETM+ image of the study area for the year 2001
DEVELOPMENT OF LAND USE/COVER MAP
Using bands 1-5 and 7 of the pre-processed images the land use / cover pattern was mapped by supervised classification with the maximum likelihood classification algorithm of ERDAS imagine 9.1 software. The Five classes considered for the study area are Built-up area, Barren land, Agriculture fields, Vegetation and Water. The supervised classification involves pixel categorisation by (i) Training, (ii) Classification and (iii) Output. Classification Accuracy assessments were done with field knowledge, visual interpretation and also referring the Google Earth. The classification accuracy was also calculated for the Land use/cover map.
DERIVATION OF NDVI IMAGE
The Normalized Difference Vegetation Index (NDVI) is a measure of the amount and vigour of vegetation at the surface. The reason NDVI is related to vegetation is that healthy vegetation reflects very well in the near infrared part of the spectrum. Green leaves have a reflectance of 20 % or less in the 0.5 to 0.7 range (green to red) and about 60 % in the 0.7 to 1.3 μm range (near infrared). The value is then normalized to -1<=NDVI<=1 to partially account for differences in illumination and surface slope. The index is defined by equation 1.
NDVI = (1) RETRIEVAL OF LST
The digital number (DN) of thermal infrared band is converted in to spectral radiance (Lλ) using the
equation supplied by the Landsat user’s hand book.[8] Date of
Image Satellite/ Sensor
Reference system/Path/ Row
Lλ =
–
LMIN (2)
LMAX = the spectral radiance that is scaled to QCALMAX in W/(m2 * sr * μm)
LMIN =the spectral radiance that is scaled to QCALMIN in W/(m2 * sr * μm)
QCALMAX = the maximum quantized calibrated pixel value (corresponding to LMAX) in DN = 255
QCALMIN = the minimum quantized calibrated pixel value (corresponding to LMIN) in DN = 1
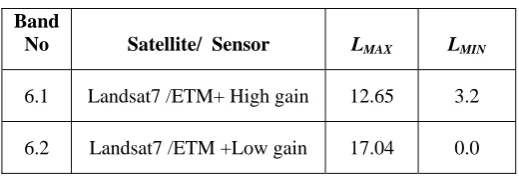
LMAX and LMINare obtained from the Meta data file available with the image and are given in the Table 2
below.
Table 2. LMAX and LMIN values of Landsat data
Band
No Satellite/ Sensor LMAX LMIN
6.1 Landsat7 /ETM+ High gain 12.65 3.2
6.2 Landsat7 /ETM +Low gain 17.04 0.0
The effective at-sensor brightness temperature (TB) also known as black body temperature is obtained from
the spectral radiance using Plank’s inverse function.
TB = (Unit: Kelvin) (3)
The calibration constants K1 and K2 obtained from Landsat data user’s manual are given in the Table 3 below.
Table 3.Calibration constants for thermal band
Sensor K1 K2
Landsat7 /ETM+ 666.09 1282.71
The final Land Surface Temperature (LST) is estimated by the following equation(4).
LST = ⁄ (Unit: Kelvin) (4)
where, λ is the wavelength of the emitted radiance which is equal to 11.5µm. ρ = h.c/σ, σ = Stefan Boltzmann’s constant which is equal to 5.67 x 10⁻⁸ Wm-2 K -4, h = Plank’s constant(6.626 x 10 -34 J Sec), c = velocity of light (2.998 x 10⁸ m/sec) and ε is the spectral emissivity. In this study spectral emissivity coefficient is taken as unity. For all the calculations at pixel level of the image, models were developed using Spatial Modeller module of ERDAS Imagine 9.1.
4. RESULTS AND DISCUSSION
LAND USE/COVER MAPS
Fig.3 Land use/cover map of study area
The total area of the rectangular area of interest (AOI) is 22748.4 square kilometers. The details of the land cover of the area under study are given in the following Table 4. Below.
Table 4.Land cover areas
Sl.No. Land cover class Area in m2
1 Built-up area 7248.8
2 Barren land 1245.6
3 Agricultural 9686.4
4 Vegetation 3358.8 5 Water 1208.8
Using hand held GPS field survey is conducted in the study area and nearly 100 points were identified. The field knowledge and Google Earth were served as basis for estimation of classification accuracy. The classification accuracy assessment was performed and the results are shown in Table.5 below.
Table 5.Classification accuracy assessment report
LAND COVER CLASS
2001 PRODUCER’S
ACCURACY
USER’S ACCURACY
BUILT UP AREA 100% 60%
AGRICULTURE 87.5% 87.5%
VEGETATION 57.14% 100%
BARREN LAND 75% 100%
OVER ALL
ACCURACY 80%
KAPPA
NDVI IMAGE:
NDVI is one of the most widely used index of which applicability in satellite analysis and in monitoring of vegetation cover was sufficiently verified in the last two decades. The NDVI value of the pixels varies between -1 and +1. Higher values of NDVI indicate the richer and healthier vegetation. Vegetation affects the latent thermo flux of the surface intent to the atmosphere through the evapotranspiration. Lower LST(except water bodies) is usually measured in areas with higher NDVI values.
The Normalized Difference Vegetation Index (NDVI) image developed is shown in the Fig.4 below.
Fig.4 NDVI image of the study area for the year 2001
EMISSIVITY IMAGE:
Basing on the NDVI values of different land use classes, emissivity image was prepared by assigning emissivity values as 0.90 for Built up area and 0.98 for vegetation.[9]. The emissivity image is shown in Fig. 5 below.
LST IMAGE:
From brightness temperature (TB) and Emissivity images the final Land Surface Temperature image was
obtained by developing a model in ERDAS Imagine 9.1. The Final LST image is shown in the Fig.6 below.
Fig.6 Land Surface Temperature image of the study area for the year 2001
From the LST image it was observed that highest temperatures of about 320 o K are existing at urban built up areas and other impervious areas and lowest temperatures of about 299 o K are existing at vegetative areas. To show the profile of the Land Surface Temperature in the study area, two transacts were taken, one from east end to the west end and the second from north end to south end which are passing through the city. The temperature profiles shown in the Fig. 7 and 8 below, clearly demonstrates the Urban Heat Island effect.
Fig.7 Land Surface Temperature profile from West end to the East end of the study area
Fig.8 Land Surface Temperature profile from North end to the South end of the study area
5. CONCLUSION
Vijayawada is the third largest city in Andhrapradesh and commercial capital for the state. It is experiencing a rapid urbanization. With urbanization most of the land surface is covered with concrete, asphalt and other such impervious materials. This leads a variety of urban environmental issues like increase in runoff increase in land surface temperatures, etc. The cities are experiencing more heat than the surrounding rural areas mainly due lack of vegetative cover. In this study an attempted is made to identify relationship between land use/cover and land surface temperature. Remote sensing has the capability of monitoring such changes, extracting the change in information from satellite data. In this work Landsat ETM+ images of Vijayawada city was collected from USGS earth explorer web site. The land use land cover maps of the study area are developed by supervised classification of the images. Five land use classes have been identified as Urban (Built-up), Water body, Agricultural land, Barren land and Vegetation. Over all classification accuracy is 80%. Surface temperature is retrieved to understand the variation of temperature from rural areas to urban area. From the LST images it is clearly understood that surface temperature is more in urban area compared to rural areas. Also the correlation study shows that the LST is strongly and negatively correlated with NDVI. This information assists in monitoring the dynamics of land use resulting out of changing demands of increasing population and associated issues like Urban Heat Island.
6. REFERENCES
[1] K. C. Seto, C. E. Woodcock, C. Song, X. Huang, J. Lu And R. K. Kaufmann,(2002), Monitoring land-use change in the Pearl River
Delta using Landsat TM, Int. J. Remote Sensing, Vol. 23, No. 10, 1985–2004.
[2] J.Li and H.M.Zhao, (2003), Detecting Urban Land Use and LandCover Changes in Mississauga using Landsat TM images, 2(1),
38-47.
[3] S.Tamilenthi1, J. Punithavathi1, R. Baskaran1 and K. ChandraMohan(2011), Dynamics of urban sprawl, changing direction and
mapping: A case study of Salem city, Tamilnadu, India, Achieves of Applied Science Research, 3(1): 277-286
[4] H.S.Shdhira, T.V Ramachandra and K.S. Jagadeesh(2004), Urban sprawl: metrics, dynamics and modelling using GIS, International
Journal of Applied Earth Observation and Geoinformation,5,29-39
[5] M. Turker and O.Asik,(2005), Land Use Change Detection At The Rural- Urban Fringe Using Multi-Sensor Data In Ankara, Turkey,
International Journal of Geoinformatics, Vol.1, No.3.
[6] Bassam Saleh and Samih Al Rawashdeh(2007),Study of Urban Expansion in Jordanian Cities Using GIS and Remote Sensing,
International Journal of Applied Science and Engineering,5,1:41-52
[7] Javed Mallik, Yogesh Kant and B.D.Bharath,(2008), Estimation of land surface temperature over Delhi using landsat-7 ETM+,,
J.Ind.Geophysics Union, Vol.12, No.3, pp.131-140
[8] NASA, 2004, Landsat Project Science Office: Landsat 7 Science data users hand book, Chapter:11, Data Products.
http://www.gsfc.nasa.gov/IAS/handbook/handbook_htmls
[9] Thomas M.Lillesand, Ralph W. Keifer and Jonathan W.Chipman,(2007), Remote Sensing and Image Interpretation, Chapter:5, John