C A N C E R
Sporadic activation of an oxidative stress–dependent
NRF2-p53 signaling network in breast epithelial
spheroids and premalignancies
Elizabeth J. Pereira1, Joseph S. Burns1*, Christina Y. Lee1†, Taylor Marohl1, Delia Calderon2, Lixin Wang1, Kristen A. Atkins3, Chun-Chao Wang4, Kevin A. Janes1,5‡
Breast and mammary epithelial cells experience different local environments during tissue development and tu-morigenesis. Microenvironmental heterogeneity gives rise to distinct cell regulatory states whose identity and importance are just beginning to be appreciated. Cellular states diversify when clonal three-dimensional (3D) spheroids are cultured in basement membrane, and one such state is associated with stress tolerance and poor response to anticancer therapeutics. Here, we found that this state was jointly coordinated by the NRF2 and p53 pathways, which were costabilized by spontaneous oxidative stress within 3D cultures. Inhibition of NRF2 or p53 individually disrupted some of the transcripts defining the regulatory state but did not yield a notable phenotype in nontransformed breast epithelial cells. In contrast, combined perturbation prevented 3D growth in an oxidative stress–dependent manner. By integrating systems models of NRF2 and p53 signaling in a single oxidative stress network, we recapitulated these observations and made predictions about oxidative stress profiles during 3D growth. NRF2 and p53 signaling were similarly coordinated in normal breast epithelial tissue and hormone-negative ductal carcinoma in situ lesions but were uncoupled in triple-negative breast cancer (TNBC), a subtype in which p53 is usually mutated. Using the integrated model, we correlated the extent of this uncoupling in TNBC cell lines with the importance of NRF2 in the 3D growth of these cell lines and their predicted handling of oxidative stress. Our results point to an oxidative stress tolerance network that is important for single cells during glandular devel-opment and the early stages of breast cancer.
INTRODUCTION
Among glandular tissues, the breast-mammary epithelium is unique because of the marked expansion and reorganization that occur after birth (1). During puberty, a branched network of epithelial ducts is pioneered by terminal end buds (TEBs), which emerge from the ru-dimentary gland and extend into the surrounding mesenchyme (2). TEBs contain a mixture of proliferating stem-progenitor cells and differentiating cells fated to the secretory luminal-epithelial or con-tractile basal-myoepithelial lineages. During morphogenesis, TEB cells are dynamically exposed to different microenvironments that inform final organization of the gland (3). Some microenvironmental cues are supportive or instructive to cells [hormones (4), growth factors (5), and basement membrane (6)]. Others are deleterious or lethal [loss of polarity (7), detachment (8), and endoplasmic reticulum stress (9)]. All of these cues are reconfigured aberrantly and heterogeneously during the early stages of breast-mammary cancer (10–12).
Stress and survival signals also juxtapose when breast-mammary epithelial cells are grown in three-dimensional (3D) culture with re-constituted basement membrane extracellular matrix (ECM) (13, 14). Combining the appropriate adhesive and soluble cues yields TEB-like
behavior in 3D-cultured multicellular epithelial fragments from the mammary gland (7). For single-cell cultures that reliably organize as 3D structures, clones or progenitors must iteratively proliferate, main-tain cell-cell adhesions, and coordinate function to establish a multi-cellular ecosystem (15, 16). Cell regulatory states diversify within 3D organoids of primary breast-mammary epithelia (17–19) and also in the simplest 3D spheroids of isogenic cell lines (20–23). Identifying such cell regulatory heterogeneities is important, because there are parallels to in situ lesions of the breast, where premalignant cells must survive and proliferate in the duct (24, 25).
Previously, we identified a cluster of transcripts (Fig. 1A, top) that covaries heterogeneously among hormone-negative, basal breast ep-ithelial cells grown as 3D spheroids (20). The cluster contains KRT5
(a PAM50 classifier for basal-like breast cancer) (26) along with mul-tiple stress tolerance genes, including JUND (27), CDKN1A (28),
MUS81 (29), and HSPE1 (30). The transcripts in this cluster were among the strongest and most-negative predictors of breast cancer response to chemotherapy and targeted agents in an independent clinical trial (31). We reported that individual genes in the cluster have complex time- and microenvironment-dependent relationships in 3D spheroids, animal models of ductal carcinoma in situ (DCIS), and clinical hormone-negative premalignancies (24). However, the overarching regulation of the cluster was not determined.
Here, we found that regulatory state heterogeneity emerges from the coordinated action of two stress-responsive transcription fac-tors (TFs)—NFE2L2 (NRF2) (32, 33) and TP53 (p53) (34)—which become stabilized posttranslationally when breast epithelial cells vari-ably experience oxidative stress in 3D culture. Genetic disruption of NRF2 signaling altered the transcriptional cluster, but 3D phenotypes were buffered or redirected by compensatory increases in p53 signaling. Disabling p53 function synergized with NRF2 deficiency, suppressing
1Department of Biomedical Engineering, University of Virginia, Charlottesville, VA 22908, USA. 2Biology and Chemistry Programs, California State University Channel Islands, Camarillo, CA 93012, USA. 3Department of Pathology, University of Virginia, Charlottesville, VA 22908, USA. 4Institute of Molecular Medicine and Department of Medical Science, National Tsing Hua University, Hsinchu 30013, Taiwan. 5 Depart-ment of Biochemistry and Molecular Genetics, University of Virginia, Charlottesville, VA 22908, USA.
*Present address: Department of Biomedical Engineering, University of Wisconsin, Madison, WI 53706, USA.
†Present address: Department of Biomedical Engineering, University of Michigan, Ann Arbor, MI 48109, USA.
‡Corresponding author. Email: [email protected]
normal 3D proliferation and promoting irregular hyperproliferation in a transformed-yet-premalignant derivative. These observations were consistent with an integrated systems model of NRF2-p53 sig-naling that encoded a shared oxidative stress trigger and common pool of antioxidant target genes without any further cross-talk. Among clinical specimens, NRF2-p53 coordination was retained in normal primary breast tissue and hormone-negative DCIS. However, the two pathways were largely uncoupled in triple-negative breast can-cers (TNBCs), in which p53 is usually mutated (35). The integrated NRF2-p53 model predicted variable extents of uncoupling among TNBCs lines, and high uncoupling coincided with the most severe 3D growth alterations upon NRF2 knockdown. Past work on NRF2 in breast cancer has focused on its direct interactions with TNBC- associated tumor suppressors (36, 37). Our results suggest a broader
systems-level role for NRF2 and p53 in oxidative stress tolerance of nor-mal breast-mammary epithelia and hormone-negative prenor-malignancies.
RESULTS
Statistical bioinformatics links gene cluster regulation to NRF2 and p53
We began by looking within the gene cluster (Fig. 1A, top) for po-tential regulatory mechanisms. The only TF in the cluster is JUND, and we showed previously that its chronic knockdown in MCF10A-5E cells (20) causes specific morphometric defects during spheroid growth (24). We revisited these results by acutely knocking down the ex-pression of JUND with inducible short hairpin RNA (shRNA) and measuring transcript abundance of cluster genes by quantitative
Standard deviations from geometric mean
A
B
C D
0 100 200 300 400
3D-cultured cells in ECM
0 4 8 12
400 800
0 4 8 12
0
0 5 10 15
500 1000 1500 2000 API5
EIF3M KRT5 ATP5H RPS6 MUS81 ADIRF ALDH3B1 FAM89BJUND MARCKS CHCHD1 OAF TCEB2 ATP5E HSPE1 ILF2 RPL13 TMEM258 COX8A S100A6 RPL38 RPS21 MRPL33 NME2 EEF2 TBCA RPS27L RNH1 CDKN1A SLIRP RPS29 COPRS SEC61G NDUFA1 NOP10
−3 0 3
0 375 750 1125 1500
200 400 600 800
Low High
Rel. abundance
NRF2 pRB
Relative immunoreactivity
0 4 8 12
Expression frequency estimates
42% 58%
1200 1600
57%
43%
91%
9%
0 150 300 450 700
10%
90%
5 10 15
70%
30%
0 5 10 15
86%
14%
Relative immunoreactivity Random 10-cell samples of
ECM-attached 3D spheroids
Abundance
Density
90% CI:
2D-cultured cells
2D-cultured cells in ECM
NRF2 pRBDAPI
(56 to 61%) (40 to 45%)
DAPI
0 0
75%
25%
0 DiRE
Tomtom
X2K oPOSSUM
36 74 61
71 6
6
2 27
10 7
6 4
0 0
E2F1 NRF2
polymerase chain reaction (qPCR) (see Materials and Methods). Un-expectedly, other than JUND itself, no transcripts were reliably altered by its knockdown (see later in this section), supporting a regulatory role for other factors outside of the cluster.
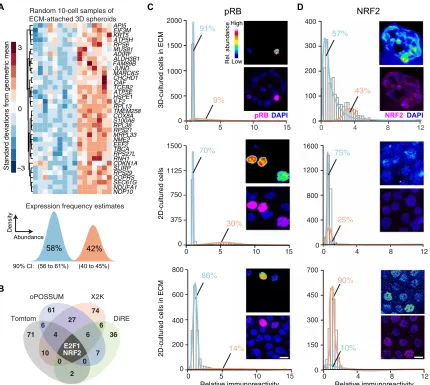
We constrained the search for candidate regulators by using max-imum likelihood inference (38) to estimate a frequency of bimodal transcriptional regulation (39) for the gene cluster. Given the 10-cell- averaged fluctuations from the original study (20), the maximum likelihood approach inferred two lognormal regulatory states defined by transcript abundance (Fig. 1A, bottom). The data supported a low- abundance regulatory state predominating in 58% of ECM-attached cells along with a second, high-abundance subpopulation in the re-maining 42%. The frequency estimates placed quantitative bounds on the bimodal characteristics of upstream regulatory mechanisms.
Next, we applied a panel of bioinformatics approaches to search for TFs that might impinge upon the gene cluster (see Materials and Methods). The informatic methods adopt different strategies for as-sessing binding site overrepresentation (40–43). Therefore, we in-tersected their respective outputs to arrive at predictions that were robust to algorithmic details. The analysis converged upon two TFs: the G1/S regulator E2F1 and the stress response effector NRF2 (Fig. 1B
and data file S1). We assessed the relative activation of the NRF2 and E2F1 pathways in single cells by quantitative immunofluorescence for the total stabilized NRF2 protein or phosphorylated RB1 (pRB in-dicates disinhibited E2F1; see Materials and Methods). In 3D spheroid cultures, pRB immunostaining was bimodal, but high-pRB cells were much rarer than the inferred regulatory frequency of the gene cluster (Fig. 1C, top). In 2D cultures, pRB staining was more than twice as immunoreactive and nearly twice as prevalent in the population (Fig. 1C, middle). The reduced proportion of high-pRB cells in 3D is consistent with the proliferative suppression of late-stage spheroid cultures (23). A 3D-like distribution of pRB was achieved in 2D cul-tures upon addition of dilute ECM (Fig. 1C, bottom), stemming from soluble proliferation-suppressing factors in the reconstituted base-ment membrane preparation (44). By contrast, NRF2 stabilization was only distinctly bimodal in 3D spheroids, and the observed fre-quency of low- and high-NRF2 states almost exactly coincided with that inferred for the gene cluster (Fig. 1D). Stabilization of hypoxia- inducible factor 1 (HIF-1) was negligible in 3D spheroids overall
(fig. S1, A and B), excluding irregular hypoxic stress as a contributor to the two-state distribution of NRF2. These results build a strong sta-tistical argument for NRF2 as a covarying regulator of the gene cluster. The NRF2-associated gene cluster (Fig. 1A, top) was originally identified by quantitative analysis of transcriptomic fluctuations among 4557 genes profiled by oligonucleotide microarray (20). The same samples were later reprofiled by 10-cell RNA sequencing (10cRNA-seq) (45), creating an opportunity to look more deeply at covariates with the NRF2-associated gene cluster. We used the median ranked fluctuations of the cluster across 10 cell samples (Fig. 1A, top) and surveyed the 10cRNA-seq data for genes that covaried (Spearman
> 0.5), identifying 633 candidates (Fig. 2A). When this expanded
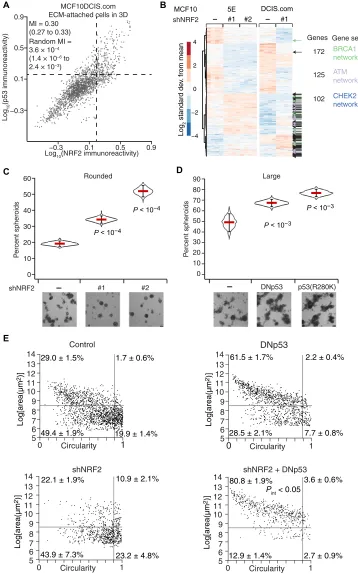
cluster was assessed for functional enrichments by Gene Ontology (GO) (data file S2) (46), we noted multiple GO terms linked to cell stress (“Response to stress” and “Oxidative stress”) and the TF p53 (“DNA damage response” and “p53 pathway”). p53 is sporadically stabilized in regenerating epithelia such as the intestine and skin, but p53 activation in quiescent tissues is rare (47). Recognizing the residual proliferation observed in 3D cultures (Fig. 1C), we immuno-stained for p53 and found nonuniform stabilization associated with
the abundance of NRF2 in single cells [Fig. 2B, estimated mutual information (MI) = 0.15 (0.12 to 0.18); see Materials and Methods]. The analysis raised the possibility of a coordinated NRF2-p53 regu-latory event triggered heterogeneously when breast epithelial cells proliferate and organize in reconstituted ECM.
NRF2 coimmunoprecipitates with p53 in TNBC cells harbor-ing gain-of-function p53 mutations, but this complex is absent in MCF10A cells with wild-type p53 (37). Loss of wild-type p53 function in MCF10A cells yields only minor 3D culture defects, but gain- of-function p53 mutants strongly perturb 3D architecture (48). Sus-pecting that some of p53’s effects could be explained through NRF2, we inducibly knocked down NRF2 with shRNA and inducibly coex-pressed a truncated p53 (49) that acts as a dominant negative (DNp53; Fig. 2C). Compared with the gene cluster response to JUND knock-down or constitutive E2F1 activation through RB inhibition with overexpressed human papillomavirus E7 protein, we observed sub-stantially more alterations upon NRF2 knockdown (66%) or inhibi-tion of p53 (31%; Fig. 2D and fig. S2, A to D). Using public chromatin immunoprecipitation sequencing (ChIP-seq) datasets (50, 51), we found significant enrichment of proximal NRF2 binding among tran-scripts reduced by NRF2 knockdown and a slight enrichment in p53 binding among those increased by NRF2 knockdown (fig. S2C). Compound perturbation of NRF2 and p53 elicited further nonaddi-tive changes to multiple genes in the cluster, including synergistic re-duction in CDKN1A, encoding a cyclin-dependent kinase inhibitor, and KRT5, encoding a basal cytokeratin. Although p53 can antagonize certain NRF2 target genes in reporter assays (52), significant antago-nism was detected for only one transcript in the cluster (MRPL33; fig. S2C). Phenotypically, disruption of NRF2 reduced mean 3D growth by 10 to 13% (fig. S3, A to D), but dual perturbation with p53 gave rise to an increase in aborted spheroids unable to grow in the culture (Fig. 2E). The penetrance of the phenotype (37%; range, 34 to 44%) was close to the percentage of cells showing stabilized NRF2 at the same time point in 3D culture (43%; Fig. 1E). For this clonal basal-like breast epithelial line (20), we conclude that 3D culture heterogeneously elicits NRF2- and p53-inducing stresses, which must be withstood for extended proliferation.
NRF2 disruption in basal-like premalignancy causes similar p53 adaptations but different 3D phenotypes
CHEK21100delC SUM102PT cells (56) and became even more pro-nounced when these cells were reconstituted with inducible wild-type CHEK2 (fig. S5, B and C), as expected, given the feedforward stabilization of p53 by ATM and ATM-activated CHEK2 (57). Thus, NRF2 impairment promotes p53 pathway activity in basal-like breast
epithelia without the need for specific oncogenic drivers.
Despite many transcriptomic alter-ations in common with MCF10A-5E cells (Fig. 3B), MCF10DCIS.com cells yielded very different 3D phenotypes when NRF2 or p53 was perturbed. NRF2 knockdown did not detectably alter 3D growth (fig. S6A) but instead gave rise to more rounded, organized MCF10DCIS. com spheroids of high circularity com-pared with control (Fig. 3C), which reverted upon addback of an RNA in-terference (RNAi)–resistant (RR) NRF2 mutant (fig. S6B). NRF2 deficiency also increased rounding in 3D cultures of SUM102PT cells with or without CHEK2 reconstitution (fig. S6C). By contrast, p53 disruption in MCF10DCIS.com cells with either DNp53 or a gain-of-function
p53R280K mutant increased the
preva-lence of hyper-enlarged outgrowths (Fig. 3D). Combined NRF2-p53 perturbation elicited a synergistic increase in non-spherical hyper-enlargement (Fig. 3E), starkly contrasting the proliferative sup-pression observed with the same combina-tion in nontransformed MCF10A-5E cells (Fig. 2E). The data suggested that the coordinate transcriptional adaptations of NRF2 and p53 are conserved in pre-malignant cells but insufficient to buffer the cellular phenotypes caused by single- gene perturbations in either pathway.
NRF2 and p53 are coordinately stabilized by sporadic
oxidative stress
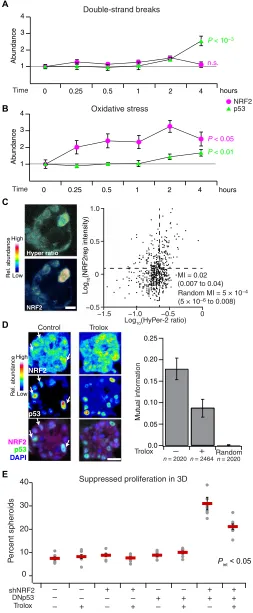
Coordination of the NRF2-p53 path-ways could be achieved if they shared the same inducer. We thus considered various potential upstream and inter-mediate triggers for NRF2 and p53 sta-bilization in basal-like breast epithelia. Inhibition of KEAP1 with the electro-phile sulforaphane (58) stabilized NRF2 but not p53, and pharmacologic inhibi-tion of MDM2 with nutlin-3 (59) stabi-lized p53 but not NRF2 (fig. S4, B to E), suggesting they act as parallel pathways downstream of a common inducer. An obvious candidate was DNA damage, given CDKN1A and MUS81 in the gene cluster (Fig. 1A, top) and the most rec-ognized function of p53 (60). However, chemotherapy-induced double-strand breaks did not appreciably stabilize NRF2 in cells with wild-type p53 (Fig. 4A and fig. S7, A and B), and genetically driving increased proliferation (61) did not detectably affect regula-tion of the gene cluster in 3D spheroids (fig. S2, B and D). The lack
B
C A
Standard dev. from geometric mean −3 0 3 p53 pathway Response to stress DNA damage response Oxidative stress
Log expression relative to control
GO term 100 100 Vinculin NRF2 20 20 DNp53 D E shNRF2 DNp53 0 10 20 30 40 50 + + + +
Pint < 10−6 Suppressed proliferation in 3D Random 10-cell RNA-seq
Signature ρ > 0.5 Gene enrichment Genes 7 15 76 24 Percent spheroids DNp53 shNRF2 + + ++ −1 −0.5 0 0.5 1 Low Rel. abundance DAPI shNRF2 + DNp53 + NRF2 p53 50 37 p21 Tubulin p38 50 Tubulin
ECM-attached cells in 3D
NQO1 * * * * * * ** * ** * * * * * * ** * * * * * * * TCEB2 JUND KRT5 EEF2 RPS29 RPS21 ATP5E CDKN1A ALDH3B1 MRPL33 RPS27L MUS81 S100A6 SEC61G SLIRP MARCKS COPRS EIF3M OAF TBCA * * * ** * *
MI = 0.15 (0.12 to 0.18)
Log10(NRF2 immunoreactivity)
Log
10
(p53 immunoreactivity) −0.1 0.1 0.3 0.5
−0.3 −0.1 0.1 0.3 0.5 NRF2
p53
Random MI = 5.3 × 10⁻⁵ (1.5 × 10⁻⁶ to 1.9 × 10⁻³) High
of NRF2-p53 coinduction by conventional agonists prompted a search for less ca-nonical activators.
One shared inducer of the KEAP1-NRF2 and ATM-CHEK2-p53 pathways is oxidative stress (62, 63). In human breast tissue, increased levels of reactive oxygen species (ROS) are generated and tolerated by basoluminal progenitors (64), which are the cells of origin for basal-
like breast cancer (65). We documented local niches of Nrf2 stabili-zation in the murine mammary gland during puberty (fig. S8, A to F), potentially linking NRF2 and oxidative stress in expanding pro-genitor(-like) cells, such as MCF10A. When MCF10A-5E cells were exogenously stimulated with H2O2, NRF2 was rapidly stabilized, and
p53 also accumulated after several hours (Fig. 4B and fig. S7, A and B). Recognizing oxidative stress heterogeneities in 3D spheroids (21, 22, 66), we used the genetically encoded sensor HyPer-2 (67) together with an engineered mRFP1-NRF2 reporter (NRF2rep) to colocalize intracellular H2O2 with stabilized NRF2 (see Materials MCF10DCIS.com
ECM-attached cells in 3D
A B −4 −2 0 2 4 Log 2 standard de v. from mean 5E
shNRF2 #1 #2
DCIS.com #1 Gene set Genes 125 172 102 BRCA1 network CHEK2 network ATM network P ercent spheroids
shNRF2 #1 #2
C Rounded D
E DNp53
shNRF2 shNRF2 + DNp53
MI = 0.30 (0.27 to 0.33) Random MI = 3.6 × 10⁻⁴ (1.4 × 10⁻⁶ to 2.4 × 10⁻³)
P
ercent spheroids
Large
DNp53 p53(R280K)
Log10(NRF2 immunoreactivity)
Log 10 (p53 immunoreactivity) −0.3 0.1 0.5 0.9
−0.3 0.1 0.5 0.9
0 10 20 30 40 50 60 70 80 90
61.5 ± 1.7%
28.5 ± 2.1%
2.2 ± 0.4%
7.7 ± 0.8%
22.1 ± 1.9%
43.9 ± 7.3%
10.9 ± 2.1%
23.2 ± 4.8%
80.8 ± 1.9%
12.9 ± 1.4%
3.6 ± 0.6%
2.7 ± 0.9%
MCF10
P < 10−3
5 6 7 8 9 11 12 13 14 1 0 Circularity 10
29.0 ± 1.5%
49.4 ± 1.9%
1.7 ± 0.6%
19.9 ± 1.4% Control 5 6 7 8 9 11 12 13 14 10 5 6 7 8 9 11 12 13 14 10 1 0 Circularity 1 0 Circularity 5 6 7 8 9 11 12 13 14 10 1 0 Circularity 0 10 20 30 40 50 60
Pint < 0.05
P < 10−3
P < 10−4
P < 10−4
and Methods and fig. S9, A to F). We observed a small but nonzero MI between HyPer-2 fluorescence ratios and NRF2rep [MI = 0.05 (0.02 to 0.10); randomized MI = 0.0004 (0.0001 to 0.0007); Fig. 4C], suggesting a complex connection between the two reporters (see next section). Next, we evaluated whether oxidative stress resided upstream of NRF2-p53 coordination by using the cell-permeable, vitamin E analog Trolox to quench overall ROS in the 3D cultures. Trolox treat-ment halved the MI between stabilized NRF2-p53 and significantly reduced the synergistic proliferative suppression caused by dual per-turbation of NRF2 and p53 (Fig. 4, D and E, and fig. S10). Together, the data suggested that the NRF2 and p53 pathway coregulation in-volves upstream heterogeneities in oxidative stress.
An integrated NRF2-p53 model of oxidative stress reconciles pathway coordination with 3D phenotypes
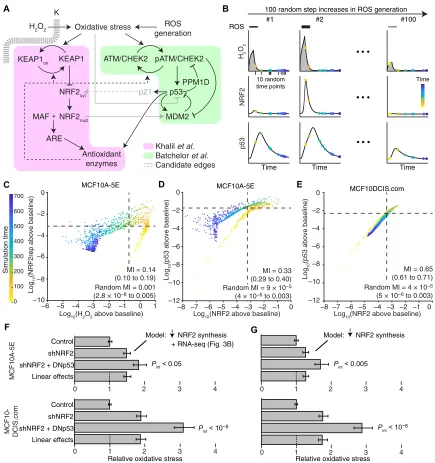
To connect NRF2 and p53 costabilization with spontaneous hetero-geneities in oxidative stress, we assembled an integrated computa-tional systems model. The model expands or condenses isolated modules of NRF2 and p53 signaling from the literature, fusing them through known or reported mechanisms of cross-talk and conver-gence (Fig. 5A). For the NRF2 pathway, we streamlined the detailed model of Khalil et al. (68) at several points. Instead of relying on ill-defined kinetic parameters for KEAP1-mediated ubiquitination, KEAP1-NRF2 complexes were modeled as separate oxidized or re-duced species with distinct half-lives estimated by experiment (see Materials and Methods). We likewise abandoned the elaborate multi-step encoding of thioredoxins, peroxiredoxins, and glutathione transferases (68) by substituting a simpler, lumped pool of antioxidant enzymes in the model. The resulting architecture is similar to the general negative-feedback control scheme of stress response gene regulatory networks described by Zhang and Andersen (69). Last, we retained the nucleocytoplasmic trafficking of stabilized NRF2 to
MI = 0.02 (0.007 to 0.04)
NRF2 A
C
D
Hyper ratio
Trolox 0.20
0.15
0.10
0.05
0.0
n = 2020n = 2464
Mutu
al inf
or
mation
Trolox
Low
Rel. abundance
Log10(HyPer-2 ratio)
Log
10
(NRF2rep intensity)
E
shNRF2 DNp53
0 10 20 30
40 Suppressed proliferation in 3D
P
ercent spheroids
Trolox – + – + – + – +
–
– +– +– + +
Pint < 0.05
– +
– + – +
– – + +
Time 1 2 3
Double-strand breaks
p53 NRF2
0 0.25 0.5 1 2 4 hours
Oxidative stress B
1 2 3 4
Ab
undance
Time 0 0.25 0.5 1 2 4 hours
Ab
undance
Random Random MI = 5 × 10⁻⁴ (5 × 10⁻⁶ to 0.008) Low
High
Rel. abundance
n = 2020 4
Control
P < 10−3
P < 0.01 P < 0.05 n.s.
0.25 −0.5
0 0.5 1.0
−1.5 −1.0 −0.5 0
DAPI NRF2 p53
NRF2
p53 High Fig. 4. NRF2-p53 signaling coordination and 3D phenotypes arise from
account for observations that H2O2 stimulation retains NRF2 in
the cytoplasm longer than treatment with the electrophilic stress, sulforaphane (fig. S11, A to C). Oxidative stress feeds directly into the NRF2 module according to a basal production rate of ROS, which
was adjusted in the final model to yield steady-state intracellular H2O2
concentrations consistent with the literature (70).
For the p53 pathway, we built upon the base model of Batchelor et al. (71), which was originally used to describe oscillations in p53 abundance
A
Oxidative stress
KEAP1ox KEAP1
NRF2cyt
NRF2nucl + MAF
ARE
Antioxidant enzymes
ATM/CHEK2 pATM/CHEK2
p53
p21
MDM2 PPM1D
B
C
Log10(H2O2 above baseline)
NRF2
p53
H2 O2
#1 #2 #100
Time Time Time
F
100 random step increases in ROS generation
Model: NRF2 synthesis
MCF10A-5E
MCF10- DCIS.com
G
Control shNRF2 shNRF2 + DNp53 Linear effects
0 1 2 3 4
Relative oxidative stress D
Log10(NRF2 above baseline)
Log
10
(p53 above baseline)
Log10(NRF2 above baseline)
Log
10
(p53 above baseline)
MCF10A-5E
−6 −4 −2 0
−6 −4 −2 0
Log
10
(NRF2rep above baseline)
0 100 200 300 400 500 600 700
E
Simulation time
–8 –7 –6 –5 –4 –3 –2 –1 0 –12
–10 –8 –6 –4 –2 0
–12 –10 –8 –6 –4 –2 0
–8 –7 –6 –5 –4 –3 –2 –1 0
–5 –3 –1 1
ROS generation H2O2
K
Pint < 0.05
Pint < 10−8 −8
−10
Random MI = 0.001 (2.8 × 10⁻⁶ to 0.005) MI = 0.14
(0.10 to 0.19) (0.29 to 0.40)MI = 0.33 Random MI = 9 × 10⁻⁵ (4 × 10⁻⁶ to 0.003)
MCF10DCIS.com
MI = 0.65 (0.61 to 0.71) Random MI = 4 × 10⁻⁵ (5 × 10⁻⁶ to 0.003) MCF10A-5E
Pint < 10−8 Pint < 0.005
0 1 2 3 4
0 1 2 3 4
Control shNRF2 shNRF2 + DNp53 Linear effects
0 1 2 3 4
Relative oxidative stress ROS
Khalil et al. Batchelor et al.
10 random
time points Time
+ RNA-seq (Fig. 3B)
Model: NRF2 synthesis Candidate edges
after ionizing radiation. In this model, the kinases ATM and CHEK2 act as aggregate sensor transducers of the DNA damage response (Fig. 5A). They phosphorylate and stabilize p53 against degradation triggered by the ubiquitin ligase MDM2, which is also directly phos-phorylated and inactivated by ATM. Stabilized p53 promotes its own degradation by inducing the expression of MDM2 transcripts and deactivates ATM-CHEK2 by enhancing transcription of the phosphatase-encoding gene PPM1D. For the integrated model, ox-idative stress replaced DNA double-strand breaks as the pathway trigger, recognizing that ATM autoactivates in the presence of oxidants (63). Furthermore, in response to oxidative stress, proper induction of many antioxidant enzymes requires p53 (72), which contributes to the overall antioxidant pool along with antioxidant response element (ARE) target genes (Fig. 5A). Oxidative stress has also been reported to inhibit p53 DNA binding (73), but we found that p53 stabilized by H2O2 treatment was as capable at increasing MDM2 abundance
as was p53 stabilized by nutlin-3 (fig. S12). Likewise, NRF2 increases MDM2 abundance in some settings (Fig. 5A, gray) (74, 75), but we were unable to detect changes in MDM2 when NRF2 was knocked down with shRNA or stabilized with sulforaphane (fig. S13, A to D). As a final candidate for NRF2-p53 cross-talk that was conditionally incorporated in the model, we considered reports that p21, encoded by the p53 target gene CDKN1A, directly stabilizes NRF2 by inter-fering with KEAP1- catalyzed turnover (Fig. 5A, gray) (76, 77). To-gether, the modifications provided an integrated model of NRF2- p53 signaling downstream of oxidative stress with enough molecular detail to enable kinetic and functional predictions.
We revisited the oxidative stress time course (Fig. 4B) to append immunoblot quantification of ATM-CHEK2 phosphorylation and p21 abundance after H2O2 addition (fig. S14A). Exogenous H2O2
was encoded as an extracellular spike-in that decayed rapidly and spontaneously (78) amidst a basal ROS generation rate, yielding a realistic intracellular H2O2 burden at steady state (70). The H2O2
partition coefficient in the model was calibrated to capture the mag-nitude of NRF2 stabilization (see Materials and Methods). Likewise, the parameters for H2O2-induced autoactivation of ATM-CHEK2
and signal inactivation were defined to align with the time-delayed kinetics and duration of p53 stabilization (fig. S14B). In this model, addition of p53-p21-NRF2 cross-talk (76) caused NRF2 stabilization to peak earlier and deactivate faster than observations (fig. S14C). We were also unable to detect even transient short-range interactions be-tween inducible BirA*-fused versions of p21 or NRF2 and endoge-nous NRF2 or p21 by proximity ligation (fig. S15, A to C). The results, thus, argued against p53-p21-NRF2 cross-talk during oxidative stress in these cells.
With the provisionally calibrated base model, we sought to test whether the encoded mechanisms of regulation were sufficient to capture prior observations relating NRF2, p53, and oxidative stress. The data obtained by quantitative fluorescence microscopy (Figs. 2B, 3A, and 4C) presumably arose from spontaneous oxidative stress that was occurring transiently and asynchronously during imaging. We mimicked oxidative stress transients by triggering a step increase in the rate of ROS production for 2 hours, followed by relaxation of the system for an additional 10 hours (Fig. 5B). The magnitude of the step was sampled lognormally to elicit intracellular H2O2
concentra-tions within the range of HyPer-2 ratios observed experimentally (see Materials and Methods). We represented the asynchrony of im-age acquisition by randomly selecting 10 snapshots of the network for each model iteration. This collection of 1000 snapshots (100 random
generation rates × 10 random time points) was used to quantify co-ordination of species within the model.
For connecting oxidative stress to NRF2 stabilization (Fig. 4C), we expanded the base model to include the mRFP1-NRF2 reporter, which does not bind DNA or interact with MAF proteins and re-quires ~1 hour to mature fully (see Materials and Methods) (79). By contrast, HyPer-2 becomes fully oxidized within ~1 min of H2O2
addition (67), enabling intracellular H2O2 concentration in the model
to be used directly as a surrogate of HyPer-2 fluorescence ratio. We calculated the MI from 1000 simulated snapshots and found that the two reporters were statistically coupled in the model [MI = 0.14 (0.10 to 0.19); randomized MI = 0.001 (2.8 × 10⁻⁶ to 0.0005); Fig. 5C].
As-sociations were stronger than those observed by experiment (Fig. 4C) due to the early time points sampled in the model (yellow-orange times in Fig. 5C), suggesting that peak H2O2 transients may be
diffi-cult to observe in practice. We next compared endogenous NRF2-p53 costabilization between MCF10A-5E and MCF10DCIS.com cells. The base MCF10A-5E model was adjusted to reflect (i) proportional differences in species abundance estimated from RNA-seq (see Mate-rials and Methods) and (ii) an increased ROS generation rate estimated from HyPer-2 imaging (fig. S9D). NRF2-p53 MI was much less de-pendent on signaling transients, and coupling was substantially higher in MCF10DCIS.com cells. The simulations were consistent with our immunofluorescence data (Figs. 3A, 4C, and 5, D and E) and support that NRF2-p53 pathway kinetics were accurately encoded in the base model.
We then investigated whether the base model could also relate to the synergistic phenotypes observed upon dual NRF2-p53 perturba-tion in MCF10A-5E and MCF10DCIS.com cells (Figs. 2E and 3E). We mimicked shNRF2-mediated knockdown by reducing the NRF2 production rate fivefold in the model (fig. S3B) and encoding sec-ondary transcriptional adaptations in other components by using the associated RNA-seq data (Fig. 3B). For DNp53, the p53 species was rendered unable to induce transcription of MDM2, PPM1D, p21, and its share of the antioxidant enzyme pool. After reestablishing steady state, the perturbed models were challenged with the random step increase in ROS production described above. We used the time- integrated intracellular H2O2 concentration as the overall measure
of oxidative stress experienced during simulation with either the MCF10A-5E or the MCF10DCIS.com initial conditions. For both cell lines, the base model predicted synergistic increases in oxidative stress beyond the linear superposition of shNRF2 and DNp53 effects (Fig. 5F). Encouragingly, the same conclusions were reached with models that simply encoded the reduced NRF2 production rate with-out secondary adaptations (Fig. 5G). Beyond oxidative stress inducers and antioxidant target enzymes, we conclude that the NRF2-p53 network does not require any additional mechanisms to capture sig-naling coordination or phenotypic interactions.
NRF2-p53 coregulation occurs in normal breast tissue and hormone-negative DCIS but not in invasive TNBC
carcinomas was inconclusive (81), owing to an NRF2 antibody that was later shown to be nonspecific (82). There was an opportunity to revisit NRF2-p53 abundance heterogeneities from the perspec-tive of costabilization, with a fo-cus on TNBC and its precursor lesions.
Using a knockout-verified com-mercial antibody (83), we immu-noblotted with our production lot and confirmed detection of basal and induced NRF2 with only ~35% immunoreactivity attributed to nonspecific bands (fig. S16, A to C). By immunohistochemistry, the antibody-detected endogenous
NRF2 stabilized with electrophiles in paraffin sections of cell pellets (fig. S16D). The antibody has also been used independently to track NRF2 abundance in other solid tumors (84). However, when we stained adjacent normal epithelium immunohistochemically, NRF2 was not clearly discernible (Fig. 6A, top). In MCF10A 3D spheroids, stabilized p53 is not detected by immunohistochemistry either (85), and yet we readily visualized it by immunofluorescence
(Fig. 2B). Therefore, to improve signal- to-background and facili-tate multiplex quantification, we used two- color immunofluo-rescence after antigen retrieval, segmenting 24,949 normal and transformed epithelial cells in 15 cases of TNBC and hormone- negative DCIS.
In adjacent normal epithelium, we observed local niches of sta-bilized NRF2 in lobules and ducts, which often corresponded with
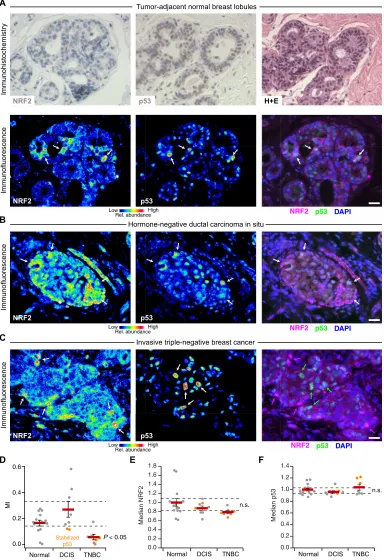
Fig. 6. NRF2 and p53 are costabilized in breast epithelial tissue and prema-lignant lesions but uncoupled in TNBC.
(A) Immunohistochemistry (top) and im-munofluorescence (bottom) for NRF2 and p53 in tumor-adjacent normal breast lob-ules. Hematoxylin and eosin (H+E, top right) histology is from a serial paraffin section for p53. Images from a tumor- adjacent normal breast duct are shown in fig. S17. (B and C) Multicolor immuno-fluorescence for NRF2 and p53 in (B) hormone-negative DCIS and (C) TNBC. (D) Quantification of the association be-tween NRF2 and p53 immunoreactivities represented in (A) to (C). (E and F) Median NRF2 and p53 immunoreactivities for the designated tissue type in each clinical case. n.s., not significant (P > 0.05). For (A) to (C), immunofluorescence is shown as representative pseudocolored images for NRF2 (left) and p53 (middle) are shown merged with DAPI nuclear counterstain (right). White arrows indicate concurrent NRF2 and p53 stabilization, and magenta or green arrows indicate stabilization of NRF2 or p53 separately. Scale bars, 20 m. For (D) to (F) data are means ± SEM of
n = 14 cases with tumor-adjacent normal epithelium (Normal), 8 cases with DCIS, and 7 cases with TNBC. Multigroup com-parison was made by Kruskal-Wallis rank sum test with Šidák correction for multi-ple hypothesis testing.
A
Immunohistochemistry
Immunofluorescence
Tumor-adjacent normal breast lobules
NRF2 p53
NRF2 p53 H+E
B
Immunofluorescence
Hormone-negative ductal carcinoma in situ
NRF2 p53
C
Immunofluorescence
Invasive triple-negative breast cancer
NRF2 p53
D E F
0.0 0.2 0.4 0.6
Normal DCIS TNBC
MI
P < 0.05 Stabilized
p53
Normal DCIS TNBC 0.0 Normal DCIS TNBC
0.2 0.4 0.6 0.8 1.0 1.2 1.4
Median p53
0.0 0.2 0.4 0.6 0.8 1.0 1.2 1.4 1.6 1.8
Median NRF2
n.s.
n.s. DAPI NRF2 p53
DAPI NRF2 p53
DAPI NRF2 p53
Low High
Rel. abundance
Low High
Rel. abundance
Low High
stabilized p53 (Fig. 6A, bottom; and fig. S17). Stabilized NRF2 was frequently detected in the cytoplasm, consistent with the prolonged cytoplasmic localization observed in H2O2-treated cells compared
with cells stressed with an electrophile (fig. S11). The results corrob-orated findings that KEAP1 senses oxidative stress differently than electrophilic stress (62). The patterns of NRF2-p53 coaccumulation were largely preserved in hormone-negative DCIS (Fig. 6B and fig. S18, A to C), even in cases with abundantly stabilized p53 that was likely mutated (see later in this section). Nuclear localization of NRF2 was also more prominent, perhaps reflecting the stronger ROS generation rates of transformed cells (86). NRF2 and p53 were almost completely uncoupled in invasive TNBCs (Fig. 6C and fig. S18D), reflecting a profound shift in single-cell regulation. We quantified NRF2-p53 coordination by MI and found that it was largely eliminated in re-gions of invasive TNBC, irrespective of whether p53 was chronically stabilized (Fig. 6D). Such alterations were not apparent in regional estimates of protein abundance by cell population–averaged fluores-cence, where neither NRF2 nor p53 was reproducibly different among groups (Fig. 6, E and F). We conclude that 3D culture in reconstituted basement membrane costimulates the NRF2-p53 pathways akin to that observed in normal breast tissue and hormone-negative prema-lignancy. Full-blown TNBC, by contrast, evokes a different set of dependencies.
TNBC adaptations to p53 disruption predict variable NRF2 miscoordination, NRF2-deficient oxidative stress profiles, and 3D growth responses
TP53 is the most frequently mutated gene in TNBC (35), and tran-scriptomic analyses support it as a prevalent founder mutation in the disease (87). Disrupting p53 would undoubtedly affect transcrip-tional feedback and the overall cellular response to oxidative stress (Fig. 5A). Conversely, neither NFE2L2 nor KEAP1 is mutated in breast cancer (88), but it is unclear whether wild-type NRF2 might serve as a transient “non-oncogene” (89) that promotes stress toler-ance during early tumorigenesis. Compared with in situ lesions, the stromal environment of invasive tumors is stiffer and more mesen-chymal (90), which may render NRF2 signaling dispensable at later stages. We wondered whether the fragmentation of the NRF2-p53 network in TNBC cells and its origins could be reconciled with the systems model.
A
−1 −0.5 0 0.5 1
Log
2
st. deviation from mean
B TNBC Lines:
0 0.45 0.75 Model:
0.25
MDAMB157BT20HCC1937HCC70MDAMB436SUM159PTHCC1143BT549HS578TMDAMB231SUM149PTHCC1806MDAMB46
8
SUM1315 HCC38
MI
ROS tolerance
C HCC1937
HCC1806
MDAMB468 SUM159PT
D
MDAMB231
0 10,000 20,000 30,000 40,000 50,000 60,000 0 2000 4000 6000 8000
0 300 600 900 1200 1500 0 4000 8000 12,000 16,000 20,000
0 6000 12,000 18,000 24,000 30,000
shNRF2:
Mean spheroid area (µm
2)
Mean spheroid area (µm
2)
#1 #2
shNRF2: #1 #2
shNRF2: #1 #2
shNRF2: #1 #2
shNRF2: #1 #2 P <10−5
P <10−3
P < 0.05
P <10−5
HMOX1 NFE2L2 MAFK CHEK2 MDM2 MAFF CDKN1A KEAP1 TP53 PRDX1 TXN PPM1D MAFG ATM SOD1
MDAMB157BT20HCC1937HCC70MDAMB436SUM1315SUM159PTHCC1143BT549HS578TMDAMB231SUM149PTHCC1806MDAMB468HCC38
E
F
G
0 0.25 >0.25 MI
ROS
tolerance 0.45
0.75 CHEK2 KEAP1 PRDX1 TXN SOD1 MAFF TP53 CDKN1A HMOX1 ATM MAFG MAFK PPM1D NFE2L2 MDM2
Log
2
st. deviation from mean −1 −0.5 0 0.5 1 >1
<−1 H
HCC1937
p53 mutation
R306* SUM159PT S158insS MDAMB231 R280K
HCC1806 T256fs*90 R273H MDAMB468
Cell line
TNBC: Lines Tumors
I
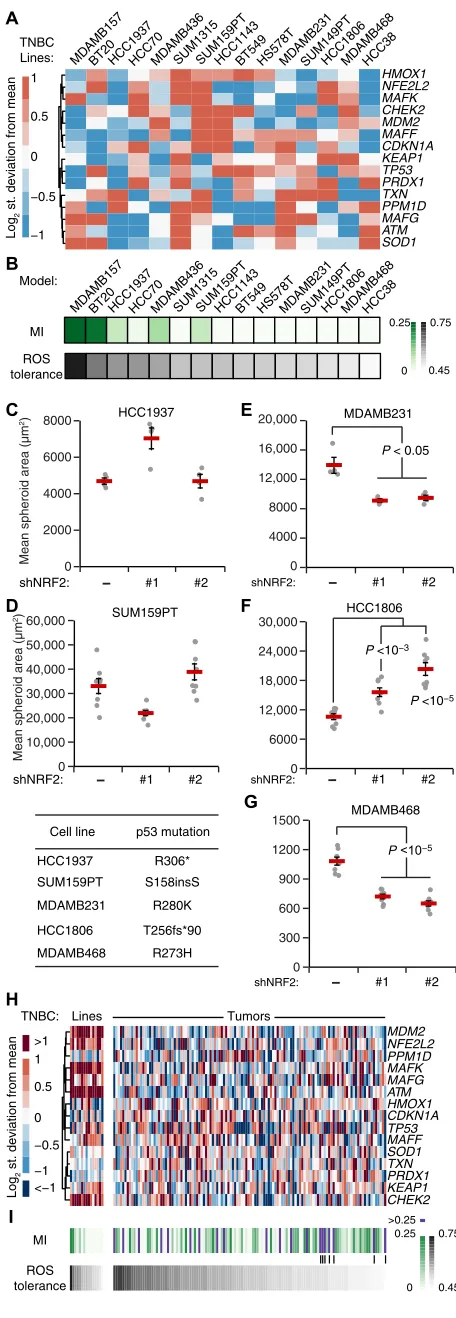
| | | | || | Fig. 7. TNBC-specific signatures of the oxidative stress network predict NRF2-p53
Using RNA-seq data from the National Institutes of Health (NIH) Library of Integrated Network-Based Cellular Signatures (LINCS) consortium (91) on 15 TNBC lines with mutated p53 (six claudin-low subtype and nine basal-like subtype), we adjusted initial conditions from the original MCF10A model and removed all transcriptional processes downstream of p53 (Fig. 7A; see Materials and Methods). The individual TNBC models were run to steady state and then chal-lenged with increased ROS generation rates as in Fig. 5B. The coordi-nation between NRF2 and mutant p53 was calculated by MI, and the integrated H2O2 response was scaled to that of MCF10A-5E cells as
a relative measure of ROS tolerance. The goal was to associate the model-derived predictions with NRF2-knockdown phenotype in ROS-generating environments such as 3D culture. To the extent pos-sible, we hoped that 3D growth in reconstituted basement membrane might quantify any vestigial requirements for NRF2 signaling from the in situ stage of the TNBC lines.
For all TNBC lines, the model predicted substantially reduced covariation between mutant p53 and NRF2 compared with MCF10-DCIS.com cells with wild-type p53 (MI < 0.25; Fig. 7B). We noted a spectrum of residual NRF2-p53 costabilization from weak (HCC1937 and SUM159PT) to virtually nonexistent (MDA-MB-468 and MDA-MB- 231). Despite complete p53 deficiency in the model, this residual NRF2-p53 MI correlated strongly with the simulated relative increase in oxidative stress when ROS generation rate was increased (Fig. 7B). Neither of these predictions mapped directly to specific transcripts in the TNBC-specific RNA-seq data (Fig. 7A), reinforcing that the models were making nonobvious predictions about oxidative stress handling.
To connect the model predictions with a continued role for NRF2 signaling in TNBC behavior, we selected five lines along the spectrum of MI and ROS tolerance. HCC1937 and SUM159PT cells were both predicted to have residual NRF2-p53 coordination and moderate ROS tolerance (Fig. 7B). Accordingly, inducible knockdown of NRF2 in these lines did not lead to any consistent changes in 3D growth (Fig. 7, C and D). By contrast, MB-231, HCC1806, and MDA-MB-468 cells were predicted to have among the least NRF2-p53 costabilization and ROS tolerance (Fig. 7B). Knockdown of NRF2 in these lines with two different shRNAs caused significant increases or decreases in overall cell growth (Fig. 7, E to G). Thus, model and exper-iment support that, despite p53 mutation, residual NRF2-p53 coupling indicates the primordial susceptibility of triple-negative cell lines to perturbations in the NRF2 pathway.
Last, we sought to extend model predictions to 122 cases of TNBC sequenced by The Cancer Genome Atlas (TCGA) (35). Compared with the TNBC lines, we noted reduced abundance of MDM2, the NRF2 binding partner MAFK, ATM, and CHEK2 (Fig. 7H), which suggested that TCGA tumors would be a considerable deviation from prior simulations. There was also more variability in the abundance of multiple antioxidant genes (SOD1, TXN, and PRDX1), anticipating a greater breadth in model outcomes. Unexpectedly, when tumor- derived profiles were encoded and simulated (see Materials and Methods), the models predicted ROS tolerances that were largely within the range of TNBC lines analyzed before (Fig. 7I). The associated NRF2-p53 coordination, by contrast, was qualitatively different, with various TCGA cases giving rise to strong coordina-tion despite pervasive TP53 mutation (Fig. 7I, purple). The high- coordination, low-tolerance TNBC cases (Fig. 7I, vertical lines) form a subset that could be especially sensitive to changes in NRF2 activation.
DISCUSSION
This work posits ROS as an endogenous, spatially heterogeneous trigger of dual NRF2-p53 activation in breast-mammary epithelia sur-rounded by basement membrane ECM. NRF2 and p53 regulate target gene abundance—both cooperatively and independently—to promote stress tolerance and adaptation. NRF2 deficits are buf fered by com-pensatory increases in p53 signaling, and notable ROS- dependent phenotypes arise when both pathways are perturbed. In hormone- negative premalignant lesions, stabilization of NRF2-p53 remains coordinated, even in cases where p53 has likely mutated. At this pre-invasive stage, NRF2 should be most important for tumorigenesis. After invasion through basement membrane and progression to TNBC, the stromal microenvironment reduces the overall NRF2 signaling and often uncouples it from (now mutant) p53. Here, the effect of activating or inhibiting NRF2 will depend more on the exact cellular context and, thus, be unpredictable (for example, Fig. 7, E to G). Despite the overall complexity of NRF2- and p53-mediated tran-scriptional programs (92, 93), the coordinated response to oxidative stress is captured by a relatively simple mathematical encoding. Known core mechanisms of NRF2-p53 regulation are brought together by a shared ROS inducer and a common pool of detoxifying target genes without the need for any further cross-talk. Therefore, oxidative stress handling in normal breast-mammary epithelia is usefully abstracted as two stability-regulated TFs working independently toward a com-mon homeostatic goal.
Although NRF2 is not an oncogene for breast cancer, it has been connected with multiple breast cancer tumor suppressors previously. In mouse mammary epithelial cells, loss of Brca1 (a predisposing event for basal-subtype TNBC) destabilizes Nrf2 and causes an increase in ROS, favoring the future acquisition of p53 mutations (36, 94). In human breast cancer cells, gain-of-function p53 mutants inter-act directly with NRF2 and may help retain NRF2 in the nucleus (37). If certain p53 mutations were also to promote NRF2 stabilization, then it would provide a two-for-one benefit to cancer progression by reliev-ing tumor suppression and conferrreliev-ing ROS tolerance constitutively. However, we did not note any association between gain-of-function p53 mutants and NRF2 abundance in TNBC lines, suggesting that KEAP1 regulation predominates, as indicated by the TNBC models. Chronic activation of the NRF2 pathway (for example, by activating
NFE2L2 mutation or KEAP1 loss) may be disfavored if increased intra-cellular ROS is not permanent. The models suggest that supraphys-iological activation of NRF2 would lead to runaway induction of antioxidant enzymes, causing reductive stress as documented for NRF2 in other tissues (95). Wild-type NRF2 function must be sufficient to buffer cells from the early stresses of premalignancy and p53 disrup-tion, allowing invasive TNBCs to deactivate the pathway when it is no longer needed. There are parallels to FOXO TFs (96), which are revers-ibly inactivated by mitogenic signals yet provide critical oxidative stress tolerance when the breast cancer tumor suppressor RUNX1 is disrupted (22, 97, 98).
of complexity and tractability makes 3D spheroid-organoid cultures a compelling platform for systems-level dissection of cell state het-erogeneity and early tumorigenesis.
The 3D behavior of breast-mammary cancer cells is highly de-pendent on the surrounding ECM (102). Invasive cancers no longer encounter basement membrane ECM but must have bypassed it upon progression to carcinoma. Although multiple TNBC lines will grow as 3D colonies in reconstituted basement membrane, others cannot, suggesting a type of cellular “amnesia” toward that past en-counter. For cancers that do grow in 3D, the use of reconstituted basement membrane (as a more normal-like microenvironment) may give rise to cellular changes reminiscent of premalignancy. We exploited these changes to evaluate the relative importance of NRF2 signaling in different TNBC backgrounds. There are likely other op-portunities to examine hurdles of premalignancy by using basement membrane 3D cultures. For 3D organoid biobanks (19), however, it is a reminder that such cultures are not propagating the primary breast tumor but rather tumor-derived cells in a more primitive state.
Cancer mutations engage and cooperate with cell signaling in ways that are not captured by DNA sequencing (103). The coupling of the NRF2 and p53 pathways described here provides a robust oxidative stress–handling network for glandular morphogenesis and mainte-nance. However, this same coupling creates a redundancy upon which p53 mutations can occur and neoplasms can evolve. Our results give pause to the nutraceutical use of sulforaphane as a potent NRF2 stabi-lizer (104)—in lung cancer, where KEAP1-NRF2 mutations are com-mon and TP53 mutation is secondary, antioxidants accelerate tumor progression (105). The extraordinary complexity of ROS generation and its cellular effects reinforce the value of modeling redox networks at a granularity suited to a given physiology or pathology (106).
MATERIALS AND METHODS Plasmids
shRNA targeting sequences from the RNAi consortium (107) were cloned into tet-pLKO.1-puro as previously described (38) for shLuc (TRCN0000072250, Addgene #136587), shNRF2 #1 (TRCN0000281950, Addgene #136584), shNRF2 #2 (TRCN0000284998, Addgene #136585), shJUND #1 (TRCN0000416347, Addgene #136581), and shJUND #2 (TRCN0000416920, Addgene #136583).
For the mRFP1-NRF2 reporter (Addgene #136580), the DNA bind-ing domain of NRF2 was mutated (C506S) along with four leucines (L4A) in the leucine zipper region of the bZIP (basic leucine zipper) domain by site-directed mutagenesis of the pBabe mRFP1-NRF2 hygro plasmid (Addgene #136579) originally prepared by subcloning into pBabe mRFP1 hygro. The RR version of NRF2 (Addgene #136522) was prepared by introducing four silent mutations into the sequence targeted by shNRF2 #1 in pEN_TT 3xFLAG-NRF2 (Addgene #136527). Site- directed mutagenesis was performed with the QuikChange II XL kit (Agilent).
pDONR223 CHEK2 was obtained from the human Orfeome V5.1 (108). CHEK2 amplicon was prepared with Xba I and Mfe I restriction sites and cloned into pEN_TTmiRc2 3xFLAG (Addgene #83274) that had been digested with Spe I and Mfe I (Addgene #136526). BirA* was cloned out of pcDNA3.1 mycBioID (Addgene) (109) with Xba I and Spe I restriction sites and cloned into pEN_ TTmiRc2 digested with Spe I and Mfe I (Addgene #136521). CDKN1A and NRF2 PCR amplicons were prepared with Spe I and Mfe I restric-tion sites and cloned into pEN_TTmiRc2 BirA* (Addgene #136521).
Luciferase PCR amplicon was prepared with Spe I and Eco RI re-striction sites and cloned into pEN_TTmiRc2 3xFLAG digested with Spe I and Mfe I sites (Addgene #136519). p53DD (p53DN) and p53(R280K)-V5 PCR amplicon was prepared with Spe I and Mfe I restriction sites and cloned into pEN_TTmiRc2 (Addgene #25752), digested with Spe I and Mfe I (Addgene #136520 and #136525).
pEN_TT donor vectors were recombined into pSLIK neo (Addgene #25735), pSLIK zeo (Addgene #25736), or pSLIK hygro (Addgene #25737) by LR recombination to obtain pSLIK 3xFLAG-Luciferase zeo (Addgene #136533), pSLIK p53DD zeo (Addgene #136534), pSLIK Luciferase hygro (Addgene #136528), pSLIK 3xFLAG-NRF2(RR) hygro (Addgene #136535), pSLIK BirA* hygro (Addgene #136537), pSLIK BirA*-CDKN1A hygro (Addgene #136538), pSLIK BirA*-NRF2 hygro (Addgene #136539), pSLIK p53(R280K)-V5 hygro (Addgene #136540), and pSLIK 3xFLAG-CHEK2 neo (Addgene #136536).
pLXSN HPV16E7 (110) and the ∆DLYC mutant (Addgene #136588) were provided by S. Vande Pol (University of Virginia). pCDH– HyPer-2–puro (66) was provided by J. Brugge (Harvard Medical School).
Cell lines
The MCF10A-5E clone was previously reported and cultured as de-scribed for MCF-10A cells (13, 20). MCF10DCIS.com cells were obtained from Wayne State University and cultured in Dulbecco’s modified Eagle’s medium/F-12 medium (Gibco) plus 5% horse serum (Gibco). SUM102PT cells were obtained from Asterand Biosciences and cultured in Ham’s F-12 (Gibco) plus 10 mM Hepes (Gibco), epi-dermal growth factor (10 ng/ml; PeproTech), 5 mM ethanolamine (Sigma-Aldrich), 50 nM sodium selenite (Sigma-Aldrich), apo- Transferrin (5 g/ml; Sigma-Aldrich), 10 nM triiodo-l-thyronine (VWR),
insulin (5 g/ml; Sigma-Aldrich), hydrocortisone (1 g/ml; Sigma- Aldrich), and 5% fatty acid–free bovine serum albumin (VWR). SUM159PT cells were obtained from Asterand Biosciences and cultured in Ham’s F-12 (Gibco) plus 10 mM Hepes (Gibco), insulin (5 g/ml; Sigma-Aldrich), hydrocortisone (1 g/ml; Sigma-Aldrich), and 5% fetal bovine serum (Hyclone). All other cell lines were ob-tained directly from the American Type Culture Collection (ATCC). MDA-MB-231 and MDA-MB-468 cells were cultured in L-15 medium plus 10% fetal bovine serum without supplemental CO2. HCC1806
and HCC1937 cells were cultured in RPMI 1640 medium plus 10% fetal bovine serum. All base media were further supplemented with 1× penicillin and streptomycin (Gibco). All cell lines are female, were grown at 37°C, authenticated by short tandem repeat profiling by ATCC, and confirmed negative for mycoplasma contamination.
Viral transduction and selection
Lentiviruses were prepared in human embryonic kidney 293 T cells (ATCC) by triple transfection of the viral vector with psPAX2 + pMD.2G (Addgene) and transduced into MCF10A-5E, MCF10-DCIS.com, HCC1937, SUM159PT, MDA-MB-231, HCC1806, and MDA-MB-468 as previously described (25). Retroviruses were pre-pared similarly by double transfection of the viral vector with pCL ampho (Addgene) and transduced into MCF10A-5E cells as previ-ously described (22). Transduced cells were selected in growth medium containing puromycin (2 g/ml), G418 (300 g/ml), hygromycin (100 g/ml), or zeocin (25 g/ml) until control plates had
fluorescent reporter, we used the minimum viral titer that gave sufficient signal in sulforaphane-treated cells compared with di-methyl sulfoxide (DMSO)–treated cells. Reporter abundance was roughly equal to endogenous NRF2 expression (fig. S9F).
3D culture
3D overlay cultures were performed on top of Matrigel (BD Biosciences) as described previously for MCF-10A cells (111) with culture media previously optimized for each cell line (25). In addition, HCC1806 cells were cultured in MCF10A assay media (111), and SUM159PT cells were cultured in SUM159PT growth media (described above) plus 2% fetal bovine serum. For each culture, 45 l of Matrigel was spread with a pipette tip on the bottom of an eight-well chamber slide. A suspen-sion of 5000 single cells per well was laid on top of the Matrigel in cul-ture media supplemented with 2% Matrigel. 3D culcul-ture medium was replaced every 4 days as originally described (111). For antioxidant supplementation, cells were treated with 50 M Trolox (Calbiochem)
for 2 days before 3D culture, and Trolox was included in media refeeds and supplemented every 2 days between refeeds. For long-term knock-down experiments, cells were treated with doxycycline (1 g/ml; Sigma-Aldrich) for 3 days before 3D culture, and doxycycline was maintained in the 3D culture medium throughout the experiment. For experiments with long-term knockdown and inducible overexpres-sion, cells were treated with doxycycline (1 g/ml) for 2 days before 3D culture, and doxycycline was maintained in the 3D culture medium throughout the experiment.
RNA purification
RNA from cultured cells was isolated with the RNeasy Plus Mini Kit (QIAGEN) according to the manufacturer’s protocol. RNA from 3D cultures at day 10 was extracted by lysing individual wells in 500 l
of RNA STAT-60 (Tel-Test) and purified as described previously (25).
RNA-seq and analysis
Total RNA was diluted to 50 ng/l and prepared using the TruSeq
Stranded mRNA Library Preparation Kit (Illumina). Samples were sequenced on a NextSeq 500 instrument with NextSeq 500/550 High Output v2.5 kits (Illumina) to obtain 75–base pair (bp) paired-end reads at an average depth of 15 million reads per sample. Adapters were trimmed using fastq-mcf in the EAutils package (version ea-utils.1.1.2-537) with the following options: -q 10 -t 0.01 -k 0 (quality threshold 10, 0.01% occurrence frequency, and no nucleo-tide skew causing cycle removal). Quality checks were performed with FastQC (version 0.11.7) and multiqc (version 1.5). Datasets were aligned to the human (GRCh38.86) genome using HISAT2 with the option: --rna-strandness RF (for paired-end reads gen-erated by the TruSeq strand–specific library). Alignments were assembled into transcripts using StringTie (version 1.3.4) with the reference guided option. Transcripts that were expressed at greater than five transcripts per million across all samples were retained for downstream analysis. Differential gene expression analysis was car-ried out using edgeR (version 3.8) (112) on raw read counts corre-sponding to transcripts that passed the abundance-filtering step. Trimmed mean of M values normalization using the calcNormFactors function was performed before differential expression analysis using exactTest in edgeR. The 1132 transcripts that were commonly differentially expressed [5% false discovery rate (FDR)] between MCF10A-5E shControl and shNRF2 #1, shControl and shNRF2 #2, and MCF10DCIS.com shControl and shNRF2 #1 are shown in
Fig. 3B. Gene set enrichment analysis was done on transcripts that were differentially increased or decreased in shNRF2 compared with shControl using the Molecular Signatures database collections C1, C2, C3, C4, C6, and C7 (113, 114). The full list of enrichments (5% FDR) is provided in data file S2.
Quantitative PCR
cDNA synthesis and qPCR were performed as previously described (25, 115) with the primers listed in table S1. Human samples were normalized to the geometric mean of ACTB, HINT1, PP1A, and TBP
(Fig. 2D and fig. S2C); B2M, GAPDH, GUSB, HINT1, and PRDX6
(fig. S2A); or ACTB, B2M, GUSB, PPIA, and PRDX6 (fig. S2B).
Brightfield imaging and quantification of spheroid phenotypes
Brightfield 3D images were acquired on an Olympus CKX41 inverted microscope with a 4× plan objective (four fields per chamber) and a qColor3 camera (Q-Imaging). Images were segmented using OrganoSeg (116) to produce morphometric measures for each segmented spheroid. “Rounded” spheres were classified as having circularity greater than 0.9 (Fig. 3, C and E; and fig. S6, B and C). “Hyper- enlarged” spheres were classified as having an area greater than e8.5 ≈
5000 µm2 (Fig. 3, D and E). “Proliferation suppressed” spheres were classified as having an area less than 1600 m2 for MCF10A-5E cells
after 10 days of 3D culture (Figs. 2E and 4E).
Clinical samples
Cases were identified from the pathology archives at the University of Virginia and build upon a cohort of samples previously described (24, 25). Hormone-negative DCIS lesions were deemed negative (less than 10% expression frequency) for estrogen receptor and progesterone receptor by clinical immunohistochemistry, and TNBC cases were additionally scored negative for HER2 amplification by clinical DNA chromogenic in situ hybridization. All clinical work was done according to the Institutional Review Board for Health Sciences Research approval #14176 and Protocol Review Committee approval #1363 (502-09).
Immunofluorescence
MCF10A-5E and MCF10DCIS.com 3D cultures were embedded at day 10 of morphogenesis, and 5-m sections were cut and mounted
on Superfrost Plus slides (Fisher Scientific). For clinical samples, paraffin tissue sections were dewaxed and antigens were retrieved on a PT Link (Dako) with low-pH EnVision FLEX Target Retrieval Solution (Dako) for 20 min at 97°C. Immunofluorescence on cryo-sections and antigen-retrieved slides was performed as previously described (20) with the following primary antibodies: NRF2 (1:100; Santa Cruz Biotechnology, #sc-13032), phospho-Rb (1:1600; Cell Signaling, #8516), HIF-1 (1:800; Cell Signaling, #79233), and p53
(1:200; Santa Cruz Biotechnology, #sc-126). Slides were incubated the next day for 1 hour in the following secondary antibodies: Alexa Fluor 555–conjugated goat anti-rabbit (1:200; Invitrogen) and Alexa Fluor 647–conjugated goat anti-mouse (1:200; Invitrogen).
Image acquisition analysis and MI calculation
segmented in CellProfiler (117) using 4′,6-diamidino-2-phenylindole (DAPI) to identify nuclei. Nuclear objects were dilated to a median diameter of 15 m to capture about one whole cell. NRF2 staining
was quantified in the nucleus, the whole cell, and the cytoplasm (whole cell area − nuclear area). p53 staining was quantified in the whole cell. Immunoreactivity was quantified as the median fluorescence inten-sity of the whole cell unless otherwise noted.
For pRB and NRF2 immunofluorescence (Fig. 1, D and E), log- transformed distributions were analyzed with the MClust function in R using the unequal variance model with either one or two mix-ture components specified. Model fit was evaluated by F test.
MCF10A-5E cells stably expressing pCDH–HyPer-2–puro were imaged at 37°C in Hanks’ balanced salt solution (Gibco) with a 40× 1.3 NA EC plan Neofluar oil immersion objective on a Zeiss LSM 700 laser scanning confocal microscope. Lasers (405 and 488 nm) were used to sequentially excite two excitation peaks of HyPer-2 and collect fluorescence emission from 500 to 550 nm. To calculate HyPer-2 ratios on a pixel-by-pixel basis, 488-nm images were divided by 405-nm images and thresholded in ImageJ to remove background pixel values (~10%). For quantification of cells cultured in 2D (fig. S9, B to D), the mean HyPer-2 ratio per image was used for analysis. For quantification of cells cultured as spheroids (Fig. 4C), cells were manually segmented to calculate the median HyPer-2 ratio per cell.
Clinical samples were imaged on an Olympus BX51 fluorescence microscope with a 40× 1.3 NA UPlanFL oil immersion objective and an Orca R2 CCD camera (Hamamatsu) with 2 × 2 binning and fixed exposure times for NRF2 (150 ms) and p53 (50 ms). Images were autoexposed in the DAPI channel for nuclear segmentation and in the unlabeled fluorescein isothiocyanate (FITC) channel for auto-fluorescence estimation. Image fields were classified as follows: normal—bilayered epithelium, intact basement membrane (visualized by FITC autofluorescence), and normal cytoarchitecture; DCIS— multilayered and disorganized epithelium (with partial or complete luminal filling), intact basement membrane, and cytologic atypia; and TNBC—invasive carcinoma cells with cytologic atypia and no discernable basement membrane. All images were segmented in CellProfiler as described above. After nuclear identification, nuclei out-side of the ductal epithelium (fibroblasts, endothelial cells, and im-mune cells) were manually removed using the IdentifyObjectManually module. Because paraffin fixation of tissue increases autofluores-cence (118), the analysis excluded images that were dominated by autofluorescent bleedthrough into the Alexa 555 channel localizing NRF2. Spearman correlation was calculated between cellular FITC-555 channels and FITC-DAPI channels on a pixel-by-pixel basis for each image. Images with a FITC-555 correlation coefficient above the 95th percentile for FITC-DAPI correlation (in which autofluo-rescent artifacts were negligible due to the low exposure time) were excluded from further analysis.
For NRF2 quantification in neighboring cells (fig. S8), spheroid and mouse mammary gland images were loaded into CellProfiler, and the IdentifyObjectManually module was used to manually identify regions of ductal epithelium. The images were cropped manually, and cell nuclei within the cropped area were identified by DAPI staining. Nuclear area was dilated to a median diameter of ~15 m to define a cell. Position, area, and median NRF2 staining intensity were measured for each cell. Measurements were loaded into MATLAB, and single-cell NRF2 intensities were normalized to the median in-tensity of all exposure-matched cells. Neighboring cells were defined as cells located within a radius of 1.5 times the median cell diameter.
For more distant neighbors, annular areas of 3 to 5 and 5 to 10 times the median cell diameter were used. Cells that fell within the applied search area were used to calculate the median neighbor NRF2 tensity. The original cell at the center of the search area was not in-cluded in the intensity calculations, and cells with NRF2 intensity values equal to 0 or lacking neighboring cells within the defined search area were excluded from calculations.
To quantify the association between fluorescence channels, we used MI in lieu of standard correlation measures (Pearson and Spearman). After appropriate transformation and binning into dis-crete high-low states, MI provides greater flexibility to capture non-linear relationships (119) and more stringency to detect compressions in dynamic range (120). Median fluorescence intensity distributions were transformed by their respective cumulative distribution func-tions (probability integral transform) to produce uniformly distributed random variables (121). The uniform distributions were split into low and high states at the 67th percentile, and the joint marginal state probabilities estimated for the two fluorescence channels (R and G) were used to calculate the MI as follows
MI = ∑∑ p RG log ( ─ppR RG p G )
MI confidence intervals were estimated by bootstrapping the seg-mented cell population 1000 times. To create a randomized (null) dataset, the values of one fluorescence channel were randomly shuffled before analysis.
Clinical samples often had fewer areas of classified cells for im-aging, which require an added analysis step in the MI calculation. For a classification (normal, DCIS, and TNBC) composed of two images from one case, we evaluated batch effects by hypergeometric test to determine if the two images separated by high versus low stain-ing intensity. If so, the case for that classification was excluded.
Quantitative immunoblotting
Quantitative immunoblotting was performed as previously described (122). Primary antibodies recognizing the following proteins or epi-topes were used: NRF2 (1:1000; Santa Cruz Biotechnology, #sc-13032), p53 (1:1000; Santa Cruz Biotechnology, #sc-126), p21 (1:1000; ProteinTech, #10355-1-AP), total Chk2 (1:1000; Cell Signaling, #2662), phospho-Chk2 (Thr68; 1:1000; Cell Signaling, #2197), phospho-
ATM (Ser1981; 1:1000; Abcam, #ab81292), KEAP1 (1:1000; Santa Cruz Biotechnology, #sc-15246), CDK4 (1:1000; Cell Signaling, #12790), CDK2 (1:200; Santa Cruz Biotechnology, #sc-6248), vinculin (1:10,000; Millipore, #05-386), glyceraldehyde-3-phosphate dehydrogenase (GAPDH; 1:20,000; Ambion, #AM4300), tubulin (1:20,000; Abcam, #ab89984), p38 (1:5000; Santa Cruz Biotechnology, #sc-535), and Hsp90 (1:5000; Santa Cruz Biotechnology, #sc-7947).
Proximity ligation using BirA* fusions of p21 and NRF2