Cycle Time and Idle Time Reduction in an Engine
Assembly Line
Amith J Prakash Aneesh K S
PG Scholar Associate Professor
Department of Industrial Engineering & Management Department of Mechanical Engineering Mangalam college of Engineeering Ettumanoor Mangalam college of Engineeering Ettumanoor
Abstract
This paper focuses on productivity improvement of a tiller assembly line by using operational analysis and assembly line balancing .The existing standard time in the assembly line is too old and inaccurate. A proposal of new standard time has been given to reduce the ineffective time. A heuristic method called Ranked Positional Weighted method is used for assembly line balancing. After the analysis of the existing time required for each tasks non value added time, value added time and production time has been found using stop watch time study. Micro motion study is done to find the ineffective time in each operation. Keywords: Idle Time, Standard Time Cycle Time, Line Balancing
________________________________________________________________________________________________________
I.
INTRODUCTION
An important problem faced in the production system is that of determining the time it takes to produce a unit of product, in order to thoroughly analyze the problem, the production process for each of product is analyzed. For every manufacturing organization, price of the product primarily compromises of manufacturing cost and desired profit. If a company wishes to increase its profit, one way is to reduce the manufacturing cost with maintaining the quality of the product. Waste reduction, especially the time waste, is an important factor to reduce the manufacturing cost.
II.
NEED FOR LINE BALANCING
In an Assembly Line if the workers are not utilized effectively then it results in less efficiency. If the Cycle Time of one work station is high them it will affect the production rate of the whole product, if the line balancing is done in the assembly line. It will result in smooth functioning of the plant without bottleneck. Here this paper focus to do Assembly Line Balancing by heuristic method Rank Position Weighted method (RPW)
III.
LITERATURE SUMMARY
Patange Vidyut Chandra, [2013] [7] this paper focuses on the crucial area of productivity improvement with the use of work study technique mixed with modern soft skills. Knowing what is unnecessary is important than knowing what is the most important in production and operation. Based on those, we can eliminate insignificant tasks and non-productive activities. Management needs to understand its application not just from angle of Production improvement or finance improvement or resource utilization, but also should address critically the soft side of workers psychology to give the best to not only for accepting the productivity solutions, but also be a part on fore front during actual implementation to make the study really worth its time and effort. Prathamesh P Kulkarni [2014] [8] the objective of this paper is to present an overview on a new combined methodology for the efficient improvement in productivity with the help of various Work Study Methods associated with Lean Manufacturing Principles & Tools. S.H Eryuruk [2008] [9] explains two heuristic assembly line balancing techniques known as the “Ranked Positional Weight Technique”, and the “Probabilistic Line Balancing Technique”, were applied to solve the problem of multi-model assembly line balancing in a clothing company for two models. The aim of this article is the comparison of the efficiencies of two different procedures applied for the first time to solve line balancing in a clothing company. S.A. Oke [2006] [10] The study’s most important finding is that the time of producing a unit of product is directly proportional to the number of production stages involved and the time spent at each stage. In this paper, the time study concept in a production process is modeled mathematically
IV.
PROBLEM IDENTIFICATION AND PROBLEM STATEMENT
The After observation and analyzing production department the production rate of Power Tiller is reducing yearly, and not able to meet the required demand. The following are the main problems observed which cause this.
1) Idle times occurring in the assembly line is not controlled
2) The existing time standards are too old and inaccurate in present practices 3) The cycle time is not reduced in the assembly line
Problem Statement - “Excessive cycle time and uncontrolled idle time increases waste of time and reduce the productivity of a firm”
V.
PROBLEM DEFINITION
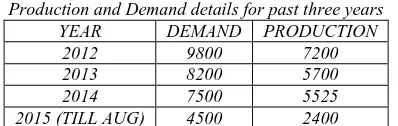
The production department consists of three Assembly sections. Transmission Assembly section, Engine assembly section and KMB-series section. The main problem of firm is the inability to meet the current demand of Power tillers. Production and demand details for the past three years are shown in the table below.
Table - 1
Production and Demand details for past three years
YEAR DEMAND PRODUCTION
2012 9800 7200
2013 8200 5700
2014 7500 5525
2015 (TILL AUG) 4500 2400
When the Production and demand for the past few years was analyzed, it is clear that the production is showing a down trend and not able to meet the demand. The table II shows the present Basic time of each section in the existing plant.
Table - 2
Time taken of sub-assemblies for Transmission assembly in 2 shifts Day No: of sub
assembly
Shift 1 Shift 2 Total (hr)
Time (min
Day 1 10 4:30 4.41 9:11 551
Day 2 10 4:35 4.38 9:13 553
Day 3 8 4:25 4.45 9:10 550
Day 4 10 4:40 4.35 9:15 555
Day 5 8 4:38 4.30 9:08 548
Total 46 22:48 23:09 45:57 2757
Average 9.2 9:114 551.4
Basic time = Average actual time/Average no: of sub-assemblies completed =570/19.2 =29.68 min for one sub assembly
Table - 3
Time taken for sub-assemblies for KMB series in 2 shifts
Day No: of sub
assembly Shift 1 Shift 2 Total
(hr) Time
(min
Day 1 23 4:42 4:47 9:39 579
Day 2 25 4:35 4:32 9:07 547
Day 3 22 4:44 4:55 9:39 579
Day 5 25 4:32 4:36 9:08 548
Total 115 23:23 23:33 46:56 2816
Average 23 9:23 563.2
Basic time = Average actual time/Average no: of part Assemblies completed =563.2/23 = 24.48 min for one sub assembly
Table - 4
Time taken for sub-assemblies in Engine Assembly line
Day No: of sub
assembly Shift 1 Shift 2 Total
(hr) Time
(min
Day 1 10 4:30 4.41 9:11 551
Day 2 10 4:35 4.38 9:13 553
Day 3 8 4:25 4.45 9:10 550
Day 4 10 4:40 4.35 9:15 555
Day 5 8 4:38 4.30 9:08 548
Total 46 22:48 23:09 45:57 2757
Average 19.2 9:114 551.4
Basic time = Average actual time/Average no: of part assemblies completed =551.4/9.2 =59.93 min for one sub assembly
After calculation of overall basic time of the three sections in assembly line it is clear that the bottleneck is occurring in the Engine Assembly line. If the cycle time, idle time is reduced and the standard time is modified in these sections then the productivity can be improved.
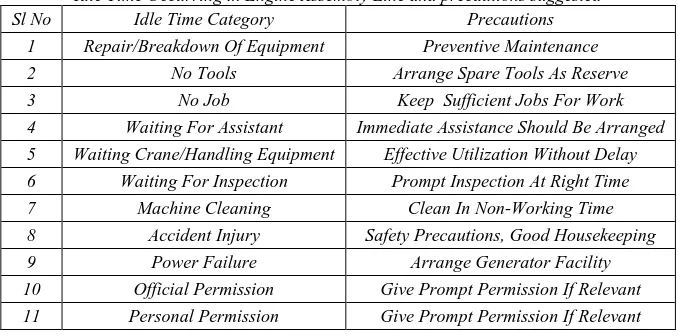
Table - 5
Idle Time Occurring in Engine Assembly Line and precautions suggested
Sl No Idle Time Category Precautions
1 Repair/Breakdown Of Equipment Preventive Maintenance
2 No Tools Arrange Spare Tools As Reserve
3 No Job Keep Sufficient Jobs For Work
4 Waiting For Assistant Immediate Assistance Should Be Arranged 5 Waiting Crane/Handling Equipment Effective Utilization Without Delay 6 Waiting For Inspection Prompt Inspection At Right Time
7 Machine Cleaning Clean In Non-Working Time
8 Accident Injury Safety Precautions, Good Housekeeping
9 Power Failure Arrange Generator Facility
10 Official Permission Give Prompt Permission If Relevant
11 Personal Permission Give Prompt Permission If Relevant
VI.
PROCEDURE
Stage 1 A.
In this stage the existing Assembly Line is studied to know whether it is efficient or not. Observation method and stop watch time study is used to check overall time of each section. In this stage the idle time is also noted. The existing process sheet is analyzed to find the area to be improved. Operation analysis is done in the present engine assembly line in order to find the Non-Value added time, Non-Value added time and production time which will help to reduce the wastage of time.
Stage 2 B.
In this stage the standard time for E1, E2 and ET found by giving a rating factor of 6% of which 3% is skill and effort rating factor and 3% is performance rating factor, and an Allowance of 10% is given of which 6% is personal allowance and 4% is fatigue allowance. Standard time calculation in ET has shown in the table below.
Table – 7
Standard time calculation of Engine testing (ET)
SL
NO TASK
PRESENT TIME
RATING FACTOR
BASIC TIME (MIN)
FATIGUE ALLOWANCE
(4%)
PERSONAL ALLOWANCE
(6%)
STD TIME
1 MOUNT ENGINE ON TEST BED 4.5 1.06 4.77 0.1908 0.2862 5.247
2 CONNECT FUEL LINE TO DIESEL
FILTER AND BLEED 3 1.06 3.18 0.1272 0.1908 3.498
4 COUPLE DYNAMOMETER TO ENGINE
FLY WHEEL 4 1.06 4.24 0.1696 0.2544 4.664
5 FIX BREAK SHOES AND WATER PIPES 3.5 1.06 3.71 0.1484 0.2226 4.081
6 START ENGINE 4 1.06 4.24 0.1696 0.2544 4.664
7 FILL ENGINE TEST RECORD ON
VERIFICATION 4.5 1.06 4.77 0.1908 0.2862 5.247
8 LOAD ENGINE GRADUALLY IN STEP 2
AND RUN ENGINE 5 1.06 5.3 0.212 0.318 5.83
9
ADJUST LOAD,CORRESPONDING TO RPM,RECORD TIME AND FUEL
CONSUMPTION
4.5 1.06 4.77 0.1908 0.2862 5.247
10 CALCULATE AND RECORD SPECIFIC
FUEL CONSUMPTION 4 1.06 4.24 0.1696 0.2544 4.664
11 LOAD THE ENGINE FOR MAXIMUM
AND RECORD MAX HP 4.5 1.06 4.77 0.1908 0.2862 5.247
12 INCASE OF VARIATION REPORT TO
SUPERIORS FOR RECTIFICATION 4 1.06 4.24 0.1696 0.2544 4.664
13 CHECK CYLINDER HEAD BOLT AND
VALVE-CLEARANCE 3.5 1.06 3.71 0.1484 0.2226 4.081
14 WRITE THE TAG ,CLOSE AIR
CLEAANER FLANGE 2.5 1.06 2.65 0.106 0.159 2.915
TIME FOR ONE ENGINE 54 min 63 min
Stage 3 C.
Final Stage 1)
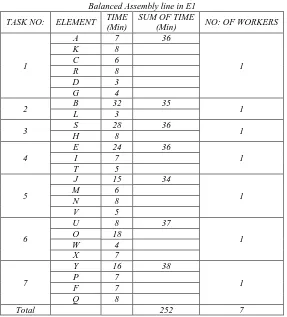
In this stage the assembly line balancing is done in E1 and E2 by the aid of a heuristic method Rank positional weighted method. The table below shows the balanced Assembly line E1with a reduced cycle time 38 minutes instead of 52 minutes in the existing case. Similarly the line balancing in E2 is also done
Table – 6
Balanced Assembly line in E1
TASK NO: ELEMENT TIME
(Min)
SUM OF TIME
(Min) NO: OF WORKERS
1
A 7 36
1
K 8
C 6
R 8
D 3
G 4
2 B 32 35 1
L 3
3 S 28 36 1
H 8
4
E 24 36
1
I 7
T 5
5
J 15 34
1
M 6
N 8
V 5
6
U 8 37
1
O 18
W 4
X 7
7
Y 16 38
1
P 7
F 7
Q 8
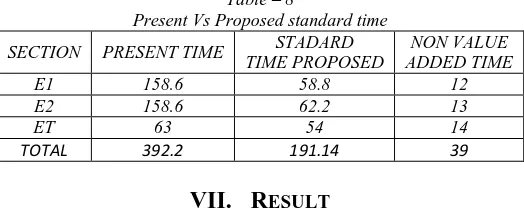
Table – 8
Present Vs Proposed standard time
SECTION PRESENT TIME STADARD
TIME PROPOSED
NON VALUE ADDED TIME
E1 158.6 58.8 12
E2 158.6 62.2 13
ET 63 54 14
TOTAL 392.2 191.14 39
VII.
RESULT
The existing system was analyzed using Method Study and Time Study. Found that there is bottleneck in E1 and E2 engine assembly sections. In order to avoid that standard time has been proposed along with operational analysis and Line balancing is done in the E1, E2 assembly sections which ultimately helps to improve productivity
VIII.
CONCLUSION
Detailed study in the existing assembly line shows that the engine assembly line should improve in order to achieve yearly demand. So time standards are proposed and it can be used to reduce cycle time in the current assembly line. The idle times occurring in the assembly line also need to control with the suggested precautions. Cycle time of E1 and E2 is reduced so as to meet the yearly demand. The study shows that Engine Testing (ET) and Engine finishing (EF) need not modify. And the bottleneck is occurring in Engine section one (E1) and section two (E2)
REFERENCES
[1] Santosh T Ghutukade, Dr. Suresh M. Sawant, The use of Ranked Position weighted Method for Assembly Line Balancing, Ghutukade, International Journal of Advanced Engineering Research and Studies E-ISSN 2249–8974, Int. J. Adv. Engg. Res. Studies / II/ IV/July-Sept., 2013/01-03
[2] Vrittika Pachghar, R. S. Dalu The Review of assembly line balancing methods, International Journal of Science and Research (IJSR) March, ISSN (Online): 2319-7064,Volume 3 Issue 3, March , (2014)
[3] Riyadh Mohammed Ali Hamza, Jassim Yousif Al-Manaa, A study imitating a Procedure Of A Two Stages Gear Box (2SGB) Assembly Line, Global Perspectives On Engineering Management, Vol.2, Issue 2,pp.70-81(2013)
[4] Mahbubur Rahman, Farjana Nur An Integrated Framework of Applying Line Balancing In Apparel Manufacturing Organization: A Case Study, Journal of Mechanical Engineering, Vol ME 44, NO. 2, DECEMBER 2014
[5] Satish Keru Raut, A Case Study of Productivity Improvement by using IE Tools, International Journal Of Innovations in Engineering Research and Technology Volume 1, Issue 1 November, [2014]
[6] Sandip K Khumbhar, Niranjan M R, Sanjay T Satpute, Assembly Line production improvement by optimization of cycle time, Proceedings of 10th IRF International Conference, 1st June, [2014]
[7] Patange Vidyut Chandra, An Effort to Apply Work And Time Study Techniques in a Manufacturing Unit for Enhancing Productivity, International a Journal of Innovative Research in Science, Engineering And Technology, Vol. 2, Issue 8, August [2013]
[8] Prathamesh P Kulkarni, Sagar S Kshire, Kailas V Chandratre, Productivity Improvement Through Lean Deployememnt And Work Study Methods, International Journal Of Research And Technology, Feb[2014]
[9] S.H Eryuruk, S. H Eryuruk, A Research On The Effect Of Method Study On Production Volume And Assembly Line Efficiency, [2014]