ISSN (e): 2250-3021, ISSN (p): 2278-8719 Vol. 05, Issue 11 (November. 2015), ||V2|| PP 43-48
The Application of Load Curve Segment Technology in Dynamic
Reactive Power Optimization of Distribution Network
Huang Sheng qi
1Zhang Ling yu
2Zhu Wen feng
1Wu Dan
3(1.Northeast petroleum university,School of Electrical Engineering & Information , Heilongjiang Daqing 163318, China; 2. Daqing Oil Field Co storage and transportation sales branch south three oil depot, Heilongjiang Daqing 163000, China 3. Daqing Electricity Power Group Oil Field Thermal Power Plant,Daqing 163000,China)
Abstract:Dynamic reactive power optimization is about the continuous variation of the load,and considers the problem of the optimization of the motion numbers of reactive power compensation equipment action. Set up the objective function and constraint conditions in the process of dynamic optimization, and divide the load curve into segments. The objective function is the minimum of network loss and compensation capacity in the limit of the voltage, and the constraints includes the maximum numbers of compensation equipments and so on. In addition, the paper improves the segmentation technology on the basis of further researching the advantages and disadvantages of the existing load curve segmentation methods. Normalize the reactive load in the whole day and compare the difference of average and original data with threshold value for segmentation again. Apply the improved segmentation method and the multi-agent ant colony algorithm which are put forward in this paper to dynamic reactive power optimization in distribution network. The experimental results verify the effectiveness of this method.
Keywords: power system; dynamic reactive power optimization; load segmentation technology; intelligent algorithm
I.
INTRODUCTION
In the field of power system, reactive power optimization is a hot issue. Consider the load which varies with time, on a particular moment, fixed load of static reactive power optimization cannot meet the demand of practical engineering.So the dynamic reactive power optimization can be wide application and all-round development. Realizing the dynamic reactive power optimization needs to make load curve transform into discrete curves, namely the load curve is segmented according to certain strategy. In this way, too complicated dynamic reactive power optimization problems can turn into a number of interrelated periods of static reactive power optimization problems, and simplify the space-time coupling problems.
II.
THE MATHEMATICAL MODEL OF REACTIVE POWER OPTIMIZATION
The mathematical mode of reactive power optimization is composed of the objective function and constraint conditions. The objective function needs to consider various factors, such as the minimum loss of system network; the minimum investment of total net; the maximum number of reactive power compensation equipment action allows at least[1].
The objective function is the minimum of network loss and compensation capacity in the limit of the voltage, the following formulas:
m i ci ni t t
loss Q U U U t P F 1 1 2 min max ) ( ) ( min
min (1)
T t t P t P t P B G i S
Di S
i Gi
loss ( )
( )
( ) 1,2,, (2) ) ( ) ( 0 ) ( min min max min max max i i i i i i i i i i U U U U U U U U U U U U ; ; ; (3)
In these formulas: Ploss(t) means the active loss of line ; Uimax and Uimin are respectively the upper and
shows respectively the weighted coefficient of active network loss, the limit coefficient of node voltage, the
capacity coefficient of reactive power compensation;PGi (t)is active power of the first i generator at t
time;PDi(t)is active load of the first i node at t time.
Equality constraint conditions:
) ( 0 ) cos sin ( 0 ) sin cos ( B S j ij ij ij ij j i Di Gi S j ij ij ij ij j i Di Gi S i B G U U Q Q B G U U P P B B
(4)In these formulas:PGi (t),QGi (t) is active power and reactive power of the first i generator at t
time;PDi(t),QDi(t)shows active load and reactive load of the first i node at t time. SBis the total number of
nodes in the system; Ui , Uj represents voltage amplitude of the node i , j; δi , δj shows phase Angle of the node i ,
j; δiij is phase Angle difference between the node i and j; Gij , Bij is respectively system node admittance matrix
of the first i row first j column element in the real part and imaginary part.
Inequality constraints include the generator reactive power output, the compensation device of reactive power compensation capacity, the variable ratio of on-load voltage regulating transformer, the action number constraints of two types of equipment ,load node voltage, they are shown in the following formulas:
max min Gi Gi
Gi Q Q
Q (5)
max min Ci Ci
Ci Q Q
Q (6)
max min i i
i T T
T (7)
max min i i
i u u
u (8)
In these formulas,QGiis the reactive power generator of the node i ,QGimax ,QGimin shows the upper and lower
limits for the reactive power generator of the node i;QCi is reactive power compensation capacity of the first i
reactive compensation devices,QCimax ,QCimin shows the upper and lower limits on the capacity of the first i
reactive power compensation devices;uiis voltage of the node i,uimax ,uimin means the upper and lower limits
for voltage of the node j; Ti is variable ratio of the first i on-load voltage regulating
transformer,Timax ,Timin shows the upper and lower limits for the variable ratio of the first i on-load voltage regulating transformer.
According to inequality constraints of the dynamic reactive power optimization, as shown below:
T t t m tm C C
C
0
max ,
1
, (9)
T t t l tl T T
T
0
max , 1
, (10)
In these formulas, T is a total number of segments; Cm,t means the switching state of the first m
capacitor at t time,0 , 1 shows respectively the opening and closing; Cmax is the allowed maximum number of
capacitor switch; Tl,t means values of the first l on-load voltage regulating transformer tap gear ; Tmax shows
the allowed maximum number of tap.
III.
LOAD CURVE SEGMENTATION TECHNOLOGY
There are two kinds of segmentation of methods for load curve segmentation in theory:
(1) According to 24 hours a day, the load curve is divided into 24 segments in the whole day, integral mean value is used to determine the equivalent load of each period [2].
(2) The load curve will be segmented according to monotone [3]. Start-stop time points are usually selected as curve peaks and troughs. In addition, inflection points are also used as the start-stop time points of curve section. In this paper, based on the existing segmentation methods, new ideas strike the segmentation method. Specific segmentation method is as follows:
load curve;
Normalize the formula is as follows:
) (
)
( min
max min x x
x x
y (11)
In this formula, y , x is respectively processing data before the normalization and normalized processing of data,y [0,1];xminandx max mean the minimum and maximum of reactive load;
(2) Calculate the reactive load average which is after the normalization of the adjacent two time stages within 24 hours:
23 , , 2 , 1 2
1
t
t Q Q
Qav t t (12)
In this formula,Qavt shows the average of the reactive load which is between two time stages;Qt,Qt1 refers
to respectively reactive load at t, t+1 time;Qavt ,Qt,Qt1 is the normalized reactive load value.
(3) JudgeQavt Qt , is the threshold value, determine the size of its value through repeated experiments. (4) Determine the equivalent load: If the difference is greater than the threshold value, keep the initial value of the reactive load unchanged; If less than or equal to the threshold value, the average of the initial value of reactive load is used as the reactive load value at this time; If reactive load around the adjacent value at a certain time is less than the threshold, select small numerical reactive load as the new load value at this time.
IV.
DYNAMIC REACTIVE POWER OPTIMIZATION PROCESSES
The specific process of dynamic reactive power optimization of distribution network is following: (1) Initialization: read the system of network data, set the initial parameters of optimization algorithm;
(2) Segment the system of reactive power load curve : the paper uses the improved segmentation technology to segment the curve, and set the threshold in advance to get the reactive load at each time period;
(3) The multi-agent ant colony algorithm[4] is applied in reactive power optimization, and the maximum allowable operating frequency and the active power loss value of the transformer tap and load regulating transformer tap at each time period are obtained.
(4) Finally determine whether meet the terminative conditions according to the constraint conditions and the number of iterations, so the optimization strategy is obtained.
V.
THE EXAMPLE ANALYSIS
Take a certain regional power distribution network with 14 nodes as an example, a numerical example is analyzed, and the wiring diagram of system is shown in Figure 1:
Figure1 the wiring diagram of a regional power distribution network with 14 nodes
Figure2 load diurnal variation curve in the whole network
The reactive load curve is normalized according to Formula (11) , the result is shown in Figure 3:
Figure3 the daily changed curve of reactive load after normalization
When the threshold is 0.01, 5 ~ 6 times, 15 ~ 18 is respectively combined into a segment, the reactive load curve is divided into 20 sections, the result is shown in figure 4; When the threshold is 0.02, 4 ~ 7 times, 15 ~ 19, 20 ~ 22, 23 ~ 24 is respectively merged into the other segment, the reactive load curve includes 14 sections in total, which is shown in figure 5. When the threshold is 0.03, 1 ~ 2 times, 3 ~ 7, 11 ~ 12, 14 ~ 18, 19 ~ 22, 23 ~ 24 is respectively combined into a segment, the reactive load curve is divided into 10 sections, which is shown in figure 6:
Figure 4 =0.01 Figure 5 =0.02 Figure 6 =0.03
The selection of the threshold is directly related to the number of segments from figure 1.4~1.6, so the threshold is set to 0.02 through repeated experiments. With respect to =0.01, the computation scale and operation time are reduced, and the operation time is saved. Compared with =0.03, the result is closer to the actual load curve, meanwhile the operation precision and accuracy can be improved.
Reactive power optimization of the power distribution network is carried out by using multi-agent ant colony algorithm, and the result is as follows:
When the reactive load curve are divided into different segments, the action times in each of the capacitor bank is listed on the table 1, the conversion of the N capacitor bank is n times.
Table 1 the number of the capacitor bank actions in different cases
Max action times Segments
Site1 Site2 Site3 Site4 Site5 Site6
10 4 2 4 0 2 0
14 6 4 4 2 4 2
20 6 4 4 2 4 2
Static 6 4 4 2 4 2
When the reactive load curve are divided into different segments, the number of transformer tap actions in each site is listed on the table 2, the conversion of the N transformer tap adjusting gear is n times.
Table 2 the number of transformer tap actions in different cases
Max action times Segments
Site2 Site3 Site4 Site5 Site6
10 4 4 2 4 4
14 8 6 4 8 6
20 8 6 4 8 6
Static 8 6 4 8 6
The table1~2shows:
(1) The number of segments is 10, although the capacitors and transformer action times are less, the constraints are too harsh not to fully realize the optimization, there is still a lot of reactive power flow in the line;
(2) When the number of segments is 14, the number of action times of the capacitors is consistent with that of the static optimization. That is to say, the input of the capacitors and the location of the transformer taps are to meet the requirements of the system.
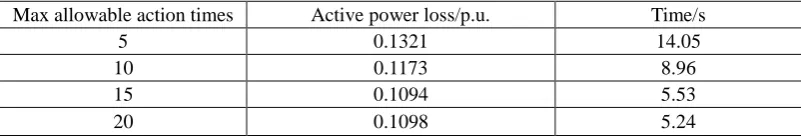
(3) The number of amplification segment is again limited to 20 segments, the number of switching capacitors and transformer tap actions are not changed. This suggests that segmenting the load curve is not the more the better, excessive segmentation is no practical significance, and the operation time will increase greatly. When the number of segments is 14, the result is listed on the table 3. According to the Formula (9), (10) which lies in the constraint conditions, set the relationships between the maximum allowable number of different devices action, the active power loss throughout the day and the average calculating time:
Table 3 Active power loss and calculating time of dynamic reactive power optimization
Max allowable action times Active power loss/p.u. Time/s
5 0.1321 14.05
10 0.1173 8.96
15 0.1094 5.53
20 0.1098 5.24
From the table 3, the maximum allowable number of devices action is set to 15 to meet the actual needs. If Beyond the number of segments is too large, it is no practical significance. In addition, but also because the device moves too frequent, this case will lead to the reciprocating phenomenon of active network loss. Not only does it not reduce operation scale, but also it can add the calcualting time. The experimental results show: when the threshold is set to 0.02, and the load curve is divided into 14 segments, which can meet the demand of reactive power optimization of the distribution network.
VI.
CONCLUSION
REFERENCES
[1]. Zhu Jianjun. Research and application of reactive power optimization of distribution network based on Improved Ant Colony Optimization Algorithm [D].Hebei, North China Electric Power University, 2007. [2]. Yang Junjun. Study on dynamic reactive power optimization of power distribution system based on
PSO_DP algorithm[D]. Shandong: Shandong University, 2011.
[3]. Li Jiwei. Study on reactive power optimization of the western power grid in Shengli Oilfield [D]. Shandong: Shandong University, 2012.
[4]. Yao Jianhong, Zhang Lingyu, Sun Daxing. Application of improved multi_agent ant colony algorithm in reactive power optimization of power system[J].Chemical industry automation and instrumentation, 2014, 41(5): 520-523