Road Detection Using Classification Algorithms
Şafak Altay Açar
1*, Şafak Bayır
21 The Department of Electronics and Computer Education, Faculty of Technical Education, Karabük University, Karabük, Turkey.
2 Department of Computer Engineering, Faculty of Engineering, Karabük University, Karabük, Turkey. * Corresponding author. Tel.: 05546174183; email: [email protected]
Manuscript submitted January 9, 2015; accepted March 5, 2015. doi: 10.17706/jcp.10.3.147-154
Abstract: In this study, we present a road detection method. Proposed method consists of two phases. In the first phase, a binary image is obtained by utilizing greyscale transformation and thresholding processes. In the second phase, K-Nearest Neighbours and Naive Bayes classifiers are applied on image by utilizing colour features. Road and non-road regions are determined and these two classifiers are compared with each other. Google Maps satellite images are used since they are easily accessible on the Internet. C# based software is developed for realizing and testing the methods mentioned above.
Key words: K-nearest neighbours, naive bayes, road detection.
1.
Introduction
Since the developments in satellite technology increases rapidly, various academic studies on satellite images have been carried out widely nowadays. Satellite images are used in many areas such as transportation, meteorology, geology, agriculture, regional planning etc. Road detection is one of the most important topics among them; therefore, obtaining information related to roads is a strategically important issue in urban areas. Public institutions, organizations and corporations such as hospitals, fire departments, police stations, schools etc. are connected each other by roads; consequently, analysing the existence of the roads on satellite images becomes gradually more important.
detects roads using multiple simple colour space components. They state that proposed system gives good and accurate results on the main road segments. Ünsalan and Sirmacek [6] present a study to detect road networks. System consists of three phases which are probabilistic road centre detection, road shape extraction, and graph-theory-based road network formation. After graph refinement process, they calculate completeness, correctness and quality for all test images as 0.75, 0.74 and 0.59 respectively. They reveal that obtained results indicate that their system can be used in detecting the road network on relevant images in a reliable and fast manner. Peeters and Etzion [7] propose an approach based on geographic information system for urban objects recognition. They use context-based recognition for a case study and they find out the overall classification accuracy as 80.30%. A study is presented by Revathi and Sharmila [8] which extracts roads using level set and mean shift methods. They compare these methods and mean shift performs (completeness value: 98.28% and correctness value: 95.31%) better than level set method (completeness value: 93.9% and correctness value: 87.89%). Abraham and Sasikumar [9] present an approach including a wavelet based segmentation method combined with a fuzzy based intelligent system for road network extraction. According to them, acceptable accuracy for the extracted features is obtained even for degraded and poor quality images. They obtained the quality percentages of the reference images as follows: image 1 (degraded) as 78.3%, image 2 (noise unaffected) as 87.7%, image 3 (noise affected) as 84.2%, image 4 (low resolution) as 65.4%, image 5 (without blurring) as 92.1% and image 6 (with blurring) as 90.8%. Gürbüz and Alatan [10] present a study based on tubularity tracking and graph cuts for road detection. They say that the most important feature of the proposed method is its local peak detection filter and the obtained average accuracy is 74.30%.
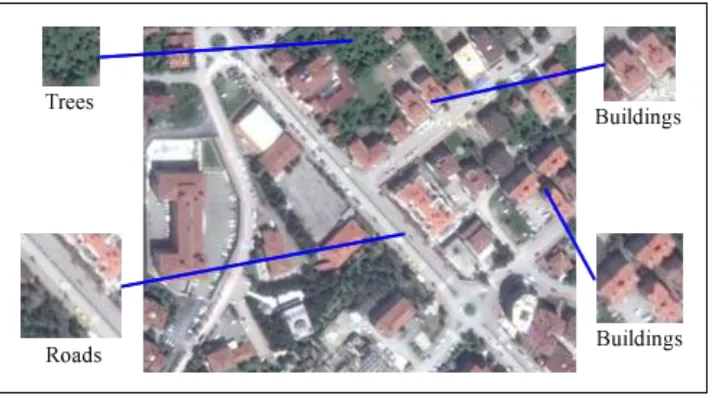
Fig. 1. Road and non-road regions.
66.33%. Kirthika and Mookambiga [15] propose an approach to extract road network using artificial neural network and the road detection correctness coefficient is calculated as 80.71. Shi et al. [16] propose an approach to extract urban main road centreline. Support vector machines, general adaptive neighbourhood, local Geary’s C algorithms and local linear kernel smoothing regression are utilized. Method is compared with other four existing road extraction methods and it is said that the proposed method is more suitable for urban main-road centreline extraction.
This paper presents a road detection method based on classification algorithms. Proposed method consists of two phases. In the first phase, a binary image is obtained by utilizing greyscale transformation and thresholding processes. In the second phase, K-Nearest Neighbours and Naive Bayes classifiers are applied on image by utilizing colour features. As a result of these processes, road and non-road regions are determined.
Road and non-road regions such as buildings, trees etc. are shown in Fig. 1.
2.
Greyscale Transformation and Thresholding
When we analyse satellite images, we see that roads are brighter than other regions and after thresholding process, roads turn into white colour. In order to use this feature, we apply thresholding to images after greyscale transformation and classification process is applied only to white colour regions in order to reduce runtime.
We use Otsu thresholding method [17]. In this method, binary image is obtained using threshold value (t1). Pixels which have a value less than t1 are accepted as black and other pixels are accepted as white.
During thresholding process, red, green and blue colour values of image pixels are analysed. Differences between these colours’ values are calculated separately. If one of them is higher than threshold value (t2), related pixel becomes black regardless of t1. After experimental studies, t2 is determined as 13. Also, if a pixel’s all colour values is higher than threshold value (t3), related pixel becomes black regardless of t1. After experimental studies, t3 is determined as 245. By means of these two threshold values (t2 and t3), regions which have a low probability of being road are eliminated.
3.
Road Detection
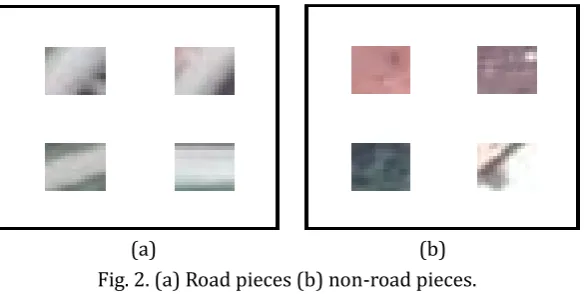
A town’s satellite images are obtained from Google Maps. Little square pieces are extracted from two of them. Some of these pieces include road regions and others include non-road regions. Images which are not utilized for extracting pieces are used for road detection. Total number of pieces is 120 (60 roads, 60 non-roads) and size of a one piece is 15×15 pixels. Sample pieces are shown in Fig. 2.
(a) (b) Fig. 2. (a) Road pieces (b) non-road pieces.
for three ranges and red-green-blue colour values. As a result, we obtain nine different mean values from one piece. Used formulas to obtain mean values are defined as follows:
(1)
(2)
(3)
C1(x,y), C2(x,y) and C3(x,y) denote piece’s total pixel colour values but each one relates different value range.
NC1, NC2 and NC3 denote number of values. Equations (1), (2) and (3) are calculated for red-green-blue colour values as explained above. Calculated mean values are used for classification.
We use two different classifiers for road detection. One of them is K-Nearest Neighbours and other one is Naive Bayes.
3.1.
K-Nearest Neighbours Classifier
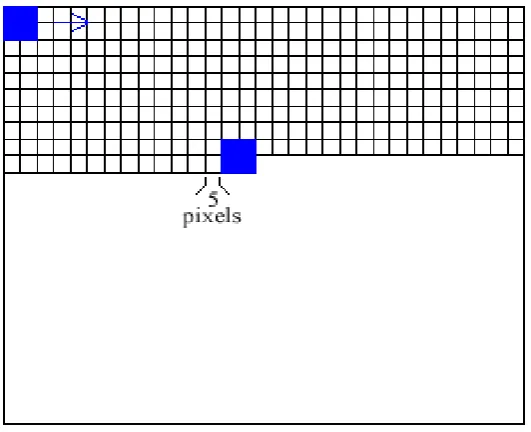
K-Nearest Neighbours algorithm is performed by shifting a N×N pixels block on satellite image. Shifting process starts on (0,0) point and shifting distance is 5 pixels. Block moves 5 pixels every step as shown in Fig. 3 and blue squares denote moving block.
Fig. 3. Moving block.
In every step, binary image is checked firstly. If binary image’s region which corresponds to block has at least 40% white colours, classification is applied on block’s region. There are two classes as road and non-road. We use Euclidean distance for class selection. Block’s nine mean values are calculated by utilizing (1), (2) and (3) and the closest 7 pieces are determined. If at least 6 of them are roads, block’s region is classified as road.
Algorithm is carried out and calculated separately for two different block sizes. These are 15×15 and 10×10 pixels. 10×10 pixels are extracted from centre of these pieces (15×15 pixels).
3.2.
Naive Bayes Classifier
(4)
(5)
(6)
Probabilities are calculated by utilizing these values and the block’s region is classified afterwards.
4.
Experimental Results
We evaluate proposed method on satellite images. 10 images of 390×300 pixels are used. K-Nearest Neighbours and Naive Bayes classifiers are compared with each other. Two different block sizes (15×15 and 10×10 pixels) are utilized. A sample of results is shown in Fig. 4.
(a) (b)
(c) (d) (e)
Fig. 4. (a) Original image, (b) binary image, (c) result of k-nearest neighbours (block size:15×15 pixels), (d) result of naive bayes (block size:15×15 pixels), (e) result of k-nearest neighbours (block size:10×10 pixels).
are obtained using 10×10 block size are not satisfying; therefore, the results are not reported within the settings of this study.
Table 1. Evaluation of K-Nearest Neighbours Classifier
(Block Size: 15×15 Pixels)
Image Completeness
(%)
Correctness (%)
1 88.11 26.39
2 76.67 27.95
3 77.73 43.01
4 84.75 34.07
5 92.15 33.61
6 84.18 32.91
7 81.43 38.22
8 78.92 36.47
9 87.27 30.77
10 77.58 27.44
Table 2. Evaluation of Naive Bayes Classifier (Block Size: 15×15 Pixels)
Image Completeness
(%)
Correctness (%)
1 80.03 31.41
2 60.28 26.93
3 57.59 46.84
4 62.28 34.65
5 49.36 42.79
6 41.57 34.79
7 65.31 40.14
8 70.01 39.28
9 68.68 32.19
10 44.31 31.37
Table 3. Evaluation of K-Nearest Neighbours Classifier (Block Size: 10×10 Pixels)
Image Completeness (%) Correctness (%)
1 72.02 31.35
2 54.08 30.52
3 71.43 51.65
4 79.95 39.35
5 82.27 43.05
6 75.63 41.08
7 68.23 45.42
8 71.58 45.42
9 66.49 33.48
10 67.35 34.41
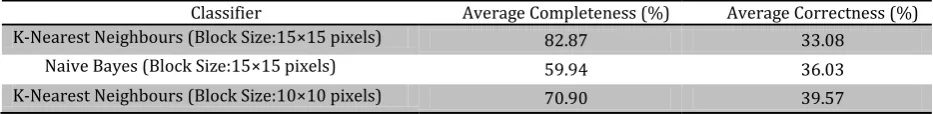
Table 4 shows the calculated averages of completeness and correctness values. Average completeness values of K-Nearest Neighbours (block size: 15×15 pixels), Naive Bayes (block size: 15×15 pixels) and K-Nearest Neighbours (block size: 10×10 pixels) are 82.87%, 59.94% and 70.90% respectively. Average correctness values of K-Nearest Neighbours (block size: 15×15 pixels), Naive Bayes (block size: 15×15 pixels) and K-Nearest Neighbours (block size: 10×10 pixels) are as follows 33.08%, 36.03% and 39.57%.
Table 4. Evaluation of Classifiers
Classifier Average Completeness (%) Average Correctness (%)
K-Nearest Neighbours (Block Size:15×15 pixels) 82.87 33.08
Naive Bayes (Block Size:15×15 pixels) 59.94 36.03
K-Nearest Neighbours (Block Size:10×10 pixels) 70.90 39.57
5.
Conclusion
Neighbours algorithm.
In future we will experiment with more features to improve our method in terms of correctness. Also we will use more classifiers to obtain more qualified evaluation.
References
[1] Xu, G., Zhang, D., & Liu, X. (2009). Road extraction in high resolution images from Google Earth.
Proceedings of International Conference on Information, Communications and Signal Processing (pp. 1-5).
[2] Poullis, C., & You, S. (2010). Delineation and geometric modeling of road networks. ISPRS Journal of Photogrammetry and Remote Sensing, 65(2), 165-181.
[3] Movaghati, S., Moghaddamjoo, A., & Tavakoli, A. (2010). Road extraction from satellite images using particle filtering and extended Kalman filtering. IEEE Transactions on Geoscience and Remote Sensing,
48(7), 2807-2817.
[4] Yuan, J., Wang, D., Wu, B., Yan, L., & Li, R. (2011). LEGION-based automatic road extraction from satellite imagery. IEEE Transactions on Geoscience and Remote Sensing, 49(11), 4528-4538.
[5] Arafat, S. Y., Butt, A. Y., & Liagat, N. (2011). Automatic road detection using MCSC. International Multitopic Conference (pp. 126-131).
[6] Ünsalan, C., & Sirmacek, B. (2012). Road network detection using probabilistic and graph theoretical methods. IEEE Transactions on Geoscience and Remote Sensing, 50(11), 4441-4453.
[7] Peeters, A., & Etzion, Y. (2010). Automated recognition of urban objects for morphological urban analysis. Computers, Environment and Urban Systems, 36(6), 573-582.
[8] Revathi, M., & Sharmila, M. (2013). Automatic road extraction using high resolution satellite images based on level set and mean shift methods. International Conference on Computing, Communications and Networking Technologies (pp. 1-7).
[9] Abraham, L., & Sasikumar, M. (2013). A fuzzy based road network extraction from degraded satellite images. Proceedings of International Conference on Advances in Computing, Communications and Informatics (pp. 2032–2036).
[10]Gürbüz, Y. Z., & Alatan, A. A. (2014). Uydu görüntülerinde tüpsellik takibi üzerinden otomatik yol tanıma. Proceedings ofSignal Processing and Communications Applications Conference (pp. 2190–2193). [11]Inglada, J. (2007). Automatic recognition of man-made objects in high resolution optical remote
sensing images by SVM classification of geometric image features. Photogrammetry and Remote Sensing, 62(3), 236-248.
[12]Mokhtarzade, M., & Valadan Zoej, M. J. (2007). Road detection from high-resolution satellite images using artificial neural networks. Applied Earth Observation and Geoinformation. 9(1), 32-40.
[13]Das, S., Mirnalinee, T. T., & Varghese, K. (2011). Use of salient features for the design of a multistage framework to extract roads from high-resolution multispectral satellite images. IEEE Transactions on Geoscience and Remote Sensing, 49(10), 3906-3931.
[14]Sırmaçek, B., & Ünsalan, C. (2011). Road detection from remotely sensed images using color features.
Proceedings ofInternational Conference on Recent Advances in Space Technologies (pp. 112-115).
[15]Kirthika, A., & Mookambiga, A. (2011). Automated road network extraction using artificial neural network. Proceedings of International Conference on Recent Trends in Information Technology (pp. 1061-1065).
[16]Shi, W., Miao, Z., & Debayle, J. (2014). An integrated method for urban main-road centerline extraction from optical remotely sensed imagery. IEEE Transactions on Geoscience and Remote Sensing, 52(6),
[17]Otsu, N. (1979). A thresholding selection method from gray-level histograms. IEEE Transactions on Systems, Man and Cybernetics, 9(1), 62-66.
[18]Laptev, I., Mayer, H., Lindeberg, T., Eckstein, W., Steger, C., & Baumgartner, A. (2000). Automatic extraction of roads from aerial images based on scale space and snakes. Machine Vision and Applications, 12, 23-31.
Şafak Altay Açar was born in Erzurum, Turkey on May 14, 1986. She is a PhD student at Karabük University, in the Computer Engineering Department. Also she is currently a research assistant at Karabük University, in the Electronics and Computer Education Department. Her research interest includes image processing, pattern recognition and artificial intelligence.