Open Access
Research article
A longitudinal study of gene expression in healthy individuals
Chris Karlovich*
†1, Guillemette Duchateau-Nguyen
†2, Andrea Johnson
†3,
Patricia McLoughlin
†2, Mercidita Navarro
4, Carole Fleurbaey
2, Lori Steiner
1,
Michel Tessier
2, Tracy Nguyen
1, Monika Wilhelm-Seiler
2and
John P Caulfield
5Address: 1Department of Genomics and Oncology, Roche Molecular Systems, Pleasanton, CA, USA, 2Pharma Development, Molecular Medicine Laboratories, F Hoffmann La Roche Ltd, Basel, Switzerland, 3Department of Biostatistics and Bioinformatics, Roche Molecular Systems, Pleasanton, CA, USA, 4Pharmaceutical Development, Methodology and Innovation, Biomathematics, Roche Palo Alto, LLC, Palo Alto, CA, USA and 5Pharma Development, Clinical, Inflammation Methodology and Innovation, Roche Palo Alto, LLC, Palo Alto, CA, USA
Email: Chris Karlovich* - [email protected]; Guillemette Duchateau-Nguyen - [email protected]; Andrea Johnson - [email protected]; Patricia McLoughlin - [email protected];
Mercidita Navarro - [email protected]; Carole Fleurbaey - [email protected]; Lori Steiner - [email protected]; Michel Tessier - [email protected]; Tracy Nguyen - [email protected]; Monika Wilhelm-Seiler -
[email protected]; John P Caulfield - [email protected] * Corresponding author †Equal contributors
Abstract
Background: The use of gene expression in venous blood either as a pharmacodynamic marker in clinical trials of drugs or as a diagnostic test requires knowledge of the variability in expression over time in healthy volunteers. Here we defined a normal range of gene expression over 6 months in the blood of four cohorts of healthy men and women who were stratified by age (22–55 years and > 55 years) and gender.
Methods: Eleven immunomodulatory genes likely to play important roles in inflammatory conditions such as rheumatoid arthritis and infection in addition to four genes typically used as reference genes were examined by quantitative reverse transcription-polymerase chain reaction (qRT-PCR), as well as the full genome as represented by Affymetrix HG U133 Plus 2.0 microarrays.
Results: Gene expression levels as assessed by qRT-PCR and microarray were relatively stable over time with ~2% of genes as measured by microarray showing intra-subject differences over time periods longer than one month. Fifteen genes varied by gender. The eleven genes examined by qRT-PCR remained within a limited dynamic range for all individuals. Specifically, for the seven most stably expressed genes (CXCL1, HMOX1, IL1RN, IL1B, IL6R, PTGS2, and TNF), 95% of all samples profiled fell within 1.5–2.5 Ct, the equivalent of a 4- to 6-fold dynamic range. Two subjects who experienced severe adverse events of cancer and anemia, had microarray gene expression profiles that were distinct from normal while subjects who experienced an infection had only slightly elevated levels of inflammatory markers.
Conclusion: This study defines the range and variability of gene expression in healthy men and women over a six-month period. These parameters can be used to estimate the number of subjects needed to observe significant differences from normal gene expression in clinical studies. A set of genes that varied by gender was also identified as were a set of genes with elevated expression in a subject with iron deficiency anemia and another subject being treated for lung cancer.
Published: 7 June 2009
BMC Medical Genomics 2009, 2:33 doi:10.1186/1755-8794-2-33
Received: 20 June 2008 Accepted: 7 June 2009
This article is available from: http://www.biomedcentral.com/1755-8794/2/33
© 2009 Karlovich et al; licensee BioMed Central Ltd.
Background
Gene expression profiling studies in venous blood are used to explore transcriptional differences between dis-eased and healthy individuals, identify biomarkers that may identify the appropriate therapy for individual patients, monitor a therapy and pharmacodynamic responses to new drugs, or define prognosis. For example, tumor molecular profiles have been identified that select preferred therapy and predict recurrence [1-3]. For autoimmune diseases, where the disease tissue is not read-ily accessible, peripheral blood has become a surrogate tissue by default [4]. Venous blood contains cells that will migrate into and/or have migrated from the inflamed tis-sue, potentially allowing the identification of patients with disease by expression profiling of whole blood. To date, studies of rheumatoid arthritis, systemic lupus ery-thematosus (SLE), Crohn's disease, and multiple sclerosis (MS) patients have identified expression profiles that may be useful in diagnosis [5,6].
Knowledge of the variability of gene expression over time in healthy men and women will help in the design of studies where drugs are expected to modulate gene expres-sion in the diseased population. It will be particularly important to clearly establish the extent of normal varia-tion for cases where the difference between normal and diseased gene expression profiles is subtle.
Clinical studies need to control for multiple sources of variability since gene expression can be influenced by psy-chological stress [7,8], exercise [9,10] and eating [11]. In vitro, inflammation markers are rapidly induced in peripheral blood mononuclear cells (PBMC) by infectious agents [12-14]. In vivo gene expression profiles of individ-uals exposed to a bacterial toxin appeared to be different from those of healthy individuals not exposed to the toxin [15]. Gene expression is also sensitive to the method by which the RNA from blood is isolated [16,17].
Several previous studies have examined gene expression in the peripheral blood of normal individuals [15,18-21]. These investigators found inter-individual variation as well as genes that uniquely identified the subjects being studied. The results were obtained using either peripheral blood mononuclear cells (PBMC) or whole blood. Gene expression profiles differ greatly among the different blood cell types [22,23]. However, the isolation of the dif-ferent cell types requires capable laboratories that are not always available at all centers involved in large clinical tri-als. Whole blood can be sampled reliably with the PAX-gene Blood RNA System [24,25]. Thus, the studies here were carried out using this collection method.
The gene expression studies mentioned previously were largely limited to a single platform for assays (microarray
or qRT-PCR), small numbers of subjects with analyses often restricted to a short sampling time frame, or even a single time point [15,18-21]. This study represents the largest reported study of longitudinal genomic sampling utilizing both microarray and qRT-PCR in an age and gen-der stratified healthy patient population, to the best of our knowledge. Moreover, the study was performed under controlled conditions with all samples drawn in the morning from fasted individuals at fixed times relative to the start of the study.
The present study extends the information base for healthy individuals by measuring the stability and dynamic range of gene expression in healthy subjects over an extended period of time, six months. qRT-PCR was used to define the range of gene expression in 28 individ-uals. Eleven immunomodulatory genes likely to play important roles in inflammatory conditions and four ref-erence genes were examined. In addition, 22 subjects were assessed by high-density oligonucleotide microarray, two of whom experienced a severe adverse event during the six-month study period.
Methods
The study was conducted in accordance with good clinical practice, the Declaration of Helsinki, and appropriate reg-ulatory guidelines. An independent ethics committee approved the protocol. Subjects gave written informed consent to participate in the study.
Subjects
Blood samples were obtained from 80 healthy volunteers enrolled at a single site in Strasbourg, France. All subjects were enrolled in January and early February, 2003 and had their last visit in August. Subjects were enrolled into one of four cohorts:
• Cohort 1: males 20–55 years of age
• Cohort 2: males > 55 years of age
• Cohort 3: females 20–55 years of age
• Cohort 4: females > 55 years of age
was also excluded. Former smoking status was not cap-tured.
A subset of 20 subjects was randomly selected from this study population for microarray analysis. The subset con-sisted of five subjects from each cohort. Two additional subjects who suffered from serious adverse events during the study were added subsequently. Samples from those 22 subjects were taken at five time points (Baseline, Day 14, Day 28, Day 90 and Day 180).
Quantitative RT-PCR was originally performed on all 80 subjects at each of the five time points for all analytes described in the study. An analysis of the data revealed that mean gene expression in all analytes varied signifi-cantly by time point. Due to flaws in the initial experi-mental design, we could not discern the degree to which the differences were attributable to a true biological effect (e.g. a seasonal effect of gene expression) or experimental bias (e.g. a "batch" effect).
The qPCR study was therefore repeated with 28 subjects chosen at random from the larger set of 80 where suffi-cient RNA remained. The 28-subject study was designed to distinguish between biological and experimental variabil-ity, and to minimize experimental variability. The 28 sub-jects were assayed by qRT-PCR at four time points (Baseline, Day 28, Day 90 and Day 180). Samples from eight subjects were analyzed on both qRT-PCR and micro-array platforms.
RNA processing and quantitation
Whole blood (2.5 mL) was collected into PAXgene tubes (Becton-Dickinson Diagnostics; Hombrechtikon, Switzer-land) and frozen immediately at -20°C. The tubes were shipped frozen and stored at -80°C for a period ranging from one week to six months before RNA was extracted. RNA extractions were performed in batches in the order in which the PAXgene tubes were received. Total RNA was extracted using the PAXgene 96 Blood RNA kit (Qiagen; Hilden, Germany) according to the manufacturer's instructions. RNA quality was assessed on an Agilent Bio-analyzer 2100 (Agilent Technologies; Palo Alto, CA). Any RNA sample with an RNA integrity number (RIN) < 6.5 was rejected and a replacement sample was obtained from a replicate PAXgene tube. The mean yield of RNA from all extractions with RIN ≥ 6.5 was 7.0 μg per tube (1 SD = 2.6
μg).
Quantitative RT-PCR
Quantitative RT-PCR assays used the fluorescent dye SYBR Green to monitor amplicon formation in a one step for-mat in which the RT step was performed in the same tube as the PCR. All 384-well plates were profiled on an ABI Prism 7900 HT Sequence Detection System (Applied
Bio-systems Inc.; Foster City, CA). All reactions were per-formed with a single reagent lot. The cycling parameters were as follows: Step 1: 50°C 2 min for Uracyl-N-Glycosy-lase (UNG) digest followed by 95°C 1 min to destroy UNG activity; Step 2: 60°C 30 minutes for reverse tran-scription; Step 3: 50 Cycles of two-step PCR. Each cycle included 95°C 30 sec (denaturation) followed by 60°C 30 sec (re-annealing and extension) Step 4: Slow ramp from 60°C to 95°C to collect data for dissociation curves. UNG was used to eliminate the possibility of carryover contamination.
One well of RNA diluent was run as a negative control for each RNA specimen. RNA diluent consisted of 10 mM TRIS pH 8.0, 0.1 mM EDTA, 0.020 mg/mL poly r(A) RNA (GE Healthcare), and 0.09% sodium azide (w/v). "High input" and "low input" positive controls assessing expres-sion of B2M were run on each plate. The target for the pos-itive controls was human blood peripheral leukocyte total RNA (Clontech) (100 ng for high input and 1 ng for low input). After a run, the plate was inspected to see that Ct values for high input and low input controls fell within a specified range.
Samples were quantified using ribogreen, a nucleic acid stain. After the concentration was determined, the sam-ples were diluted in RNA diluent. 2 ng of RNA were used in a 10 μl single-tube RT-PCR reaction for all assays except IL-6, where 20 ng were used. All reactions were set up in triplicate using a Biomek FX Laboratory Automation Workstation (Beckman Coulter; Fullerton, CA). The prim-ers used for each assay and gene accession numbprim-ers are shown in Additional File 1.
Microarray procedures
Promega SV 96 DNA isolation kit (automated method), as per the manufacturer's instructions (Promega Corpora-tion, Madison, WI) or Qiagen's RNeasy purification kit (manual method) (Qiagen GmbH; Hilden, Germany); performance equivalency of the manual versus automated methods were assessed in terms of yield, quality and reproducibility with control universal human reference RNA and control whole blood RNA (data not shown). The cRNA samples were hybridized overnight to Affymetrix U133 Plus 2.0 full genome oligonucleotide arrays and then stained with Streptavidin-Phycoerythrin according to the manufacturer's instructions (Affymetrix Inc, CA, USA). Arrays were scanned using a GeneChip Scanner 3000 (Affymetrix) and signal intensities were calculated auto-matically by GeneChip Operating Software (GCOS, ver-sion 1.0; Affymetrix). Gene signal intensities were computed using the MAS 5.0 algorithm (component of GCOS 1.0 software). Signal intensities were normalized using a quantile-quantile method [26]. All normalized data were log2-transformed prior to analysis to down-weight the influence of high expression values. The data have been deposited in NCBI's Gene Expression Omnibus (Edgar et al., 2002) and are accessible through GEO Series accession number GSE16028 http:// www.ncbi.nlm.nih.gov/geo/query/
acc.cgi?acc=GSE16028.
Statistical analysis qRT-PCR
Units of cycle threshold (Ct), were used for the expression data for all analyses. Outliers were defined as data points falling ≥ 3 standard deviations (SD) outside the mean Ct value, averaged over all time points and individuals, within a gene. A graphical assessment was performed to look for possible seasonal effects.
In addition to the normalization to total RNA input that was performed, a strategy of normalization to four refer-ence genes as a function of average gene expression weighted by their variances was considered. Several aspects of our study led us to conclude that reference gene normalization was introducing several sources of system-atic variability into the data. This variability was estimated to be of appreciable size (analyses not shown) and was not present in the total RNA normalized data because it had been controlled for through study design. This varia-bility was due to differences among reactions and differ-ences across plates. The differdiffer-ences among reactions were due to the necessity of having reference genes measured in external reactions, because SYBR green assays cannot be multiplexed. The differences among plates were due to our 28-subject substudy design where a single gene was assayed per plate, which allowed us to make all analyses on within-plate comparisons only. It is known that the precision that can be achieved with reference gene
nor-malization is limited by the variability present in the ref-erence genes [27]. Since we could not increase the precision of the immunomodulatory gene expression data with the reference genes, and we had alternatively control-led for appreciable amounts of systematic variability through study design, the strategy of normalization to ref-erence genes was abandoned.
A linear mixed model with fixed effects for gender, the interaction of gender and time, and age, and a random effect for subject was applied to the qRT-PCR data. From this model, effects were tested and within-individual vari-ation in gene expression over time was estimated. The analysis was implemented using SAS Proc Mixed.
Microarray
An exploratory analysis was first performed to assess out-liers and to determine if any clusters of subjects could be observed. For this purpose, a correspondence analysis was used. This analysis reduces the complexity of the data and facilitates their interpretation by finding combinations of genes that best explain the variability in the entire data set [28]. The analysis was performed using the statistical package XlStat 6.0 (Addinsoft; New York, NY).
Identification of differentially expressed genes
Of the potential 54,675 probe sets on the U133 Plus 2.0 microarray, 34,573 probe sets were present in at least one sample (among the 109 microarrays hybridized) and were used for the analysis. A statistical analysis was performed to determine if expression profiles could indicate signifi-cant gender, age, and time effects on gene expression. A linear mixed-effect model [29] was built independently for each of the 34,573 selected probe sets using log2 -trans-formed expression values and the analysis was imple-mented using the function lme in SPLUS.
The model used can be expressed as:
where y is the normalized signal intensity of probe set p in individual i at time t, βgender, βage, and βtime are respectively the gender, age and time effects and α is the individual random effect. The variances were denoted
(between-subjects variance) for and (within-subject variance) for εitp.
The significance of the effects was tested with t-tests. Because of the numerous t-tests performed, we needed to use a correction procedure, called the False Discovery Rate (FDR) [30], which controls the expected proportion of genes erroneously identified as differentially expressed
log (2yitp)=μp+αip+βgender p, genderi+βage p,agei+βtime p,timett+εitp,
σα,2p
genes. For this study, an FDR of 5% was chosen. For each probe set, a Shapiro test was performed to check whether the linear mixed-effect models correctly fit the data. Only 17,329 probe sets for which the Shapiro P-value > 0.1% were kept for further analysis.
Using the variance components estimated with the linear mixed-effect model built for each of the 17, 329 probe sets, we determined for each probe set p the intraclass cor-relation coefficient among expression measures within a
subject over time by calculating the term , with
the variance computed between subjects, and the within-subject variance. Values of the correlation range between 1 (i.e. no variation within subject) and 0 (i.e. high variation within subject).
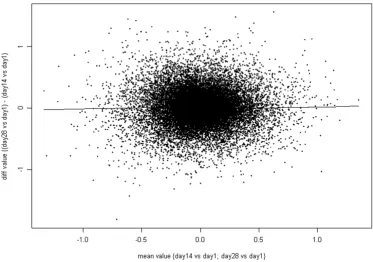
We used the graphical representation proposed by Bland and Altman [31] to determine the level of agreement between gene expression values measured at different time points. This type of graph plots the difference between two measures as a function of their means. A good agreement between different measures is observed when the cloud of data points is located around 0 and from the absence of a trend (i.e., slope of a robust linear fit of the scatter plot close to 0). In the graphs shown the differences on the vertical axis and the means on the hor-izontal axis were not computed from the normalized expression values but from the effects determined by the linear mixed-effect model using time as a factor.
Infections
Subjects who experienced an adverse event had an addi-tional sample collected following recovery from their infections. Eighteen of the eighty subjects in the study had a total of 24 infections. Infections in 7 patients were ongo-ing at the time of a scheduled sample collection, and infections in 11 patients ended within fourteen days before a collection. The other seven infections in these patients occurred outside these time frames and were not included in this analysis. There was a wide range of times
between the scheduled blood draw and the recovery blood draw (9–51 days), with most recovery period blood draws occurring between 9–22 days. The time between the end of the infection and the recovery period blood draw ranged from 14–97 days, with most occurring between 14 to 23 days after the end of the event.
Results and Discussion
An overview of the study population and hematology measures is presented first, followed by gene expression data from both individuals who remained healthy throughout the study, and those who experienced an adverse event.
Study population characteristics
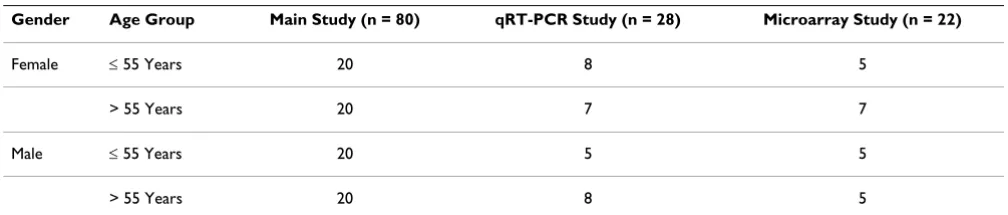
The healthy volunteers, 79 Caucasians and 1 Oriental, were from eastern France and stratified into four cohorts of 20 individuals each based on age (22 – 55 years and > 55 years) and gender (Table 1). The average age of males versus females in each of the two age groups was similar: 34.5 ± 7.8 (mean ± SD) years for males versus 32.3 ± 9.5 years for females in the age 20 – 55 years group, and 59.7 ± 3.1 versus 59.5 ± 4.5, respectively, in the over 55 group. Patients were excluded from the trial if they took medica-tion on a regular basis including birth control, hormone replacement therapy, or herbal medicines or used tobacco. The most frequently used medication for adverse events that occurred during the study was paracetamol (30 subjects), followed by hexetedine (4), phloroglucinol (4), and amoxicylline (4). One subject died from lung cancer prior to the end of the study, while all other subjects com-pleted the five scheduled visits on Days 1, 14, 28, 90, and 180 per protocol.
A subset of 28 individuals was chosen from the larger study population and analyzed for the expression of selected genes by qRT-PCR at four time points (Baseline, Day 28, Day 90 and Day 180) (Table 1). Gene expression of twenty-two subjects was assessed by high-density microarray. Samples from eight subjects were analyzed on both qRT-PCR and microarray platforms. All other sam-ples in the two subsets were assayed on only one platform.
σα σα σε
,
, ,
p
p p
2
2 + 2
σα,2p σ
ε,2p
Table 1: Counts of patient samples by study, gender and age group.
Gender Age Group Main Study (n = 80) qRT-PCR Study (n = 28) Microarray Study (n = 22)
Female ≤ 55 Years 20 8 5
> 55 Years 20 7 7
Male ≤ 55 Years 20 5 5
Hematology
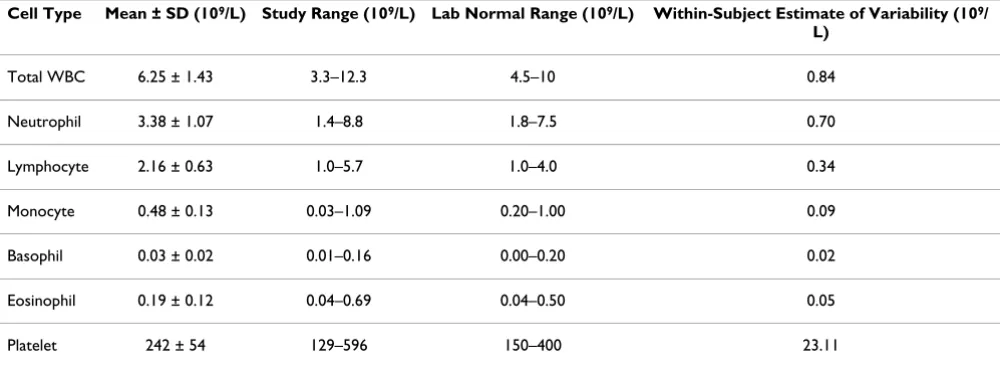
Complete blood cell counts were obtained from all 80 subjects at all five time points. Neutrophils and lym-phocytes, which together account for ~90% of white blood cells, had similar distributions (Table 2 and Addi-tional File 2). Most subjects had cell counts that were in the lower half of the normal laboratory range for each cell type. The within subject estimate of variability for neu-trophils was 21% of the mean, and was 16% for lym-phocytes. The ratio of the top to the bottom of the range of values measured in the study was 6.3 for neutrophils and 5.7 for lymphocytes.
Range of expression in selected immunomodulatory and reference genes by qRT-PCR
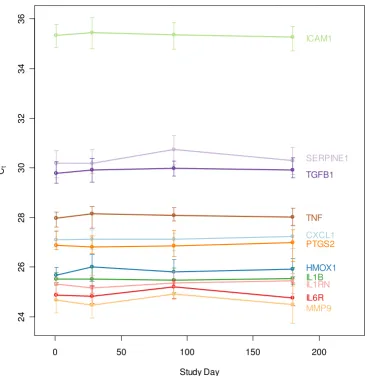
The RNA expression of eleven inflammatory markers (CXCL1, HMOX1, ICAM1, IL1B, IL1RN, IL6R, MMP9, PTGS2, SERPINE1, TGFB1, TNF), and four genes com-monly used as reference genes in blood [32,33] (B2M, 18S rRNA, GAPDH and PPP1CA), was evaluated by qRT-PCR (Figure 1). The dynamic range of expression for all the genes, both inflammatory and reference, was relatively narrow. More specifically, 95% of all samples profiled for CXCL1, HMOX1, IL1B, IL1RN, IL6R, PTGS2 and TNF had a range of gene expression that fell within 1.5–2.5 Ct, an approximately 4–6 fold range in transcript number, simi-lar to the range for neutrophil and lymphocyte cell num-bers. The gene that exhibited the highest variability was TGFB1, in which 95% of all samples spanned 4.8 Ct, or a 28-fold range. Shapiro-Wilkes tests and Quantile-Quan-tile analysis demonstrated that expression was approxi-mately log-normally distributed for most targets, with slight deviations in the tails (data not shown). Median expression values for each immunomodulatory gene eval-uated remained stable across each of the four time points
(Figure 2). Each qRT-PCR assay was performed using an equivalent amount of RNA from all samples as input. Normalizing against any of the four reference genes was not effective at increasing precision of the observed inflammatory gene expression (see Additional File 3).
McLoughlin et al.[15] evaluated expression of 48 inflam-mation and immune-related transcripts by qRT-PCR in healthy individuals at a single time point, including 10 of the genes in the present study. They found a similarly nar-row range of expression between subjects, including standard deviation values that were within 0.2 Ct of that
observed here for most targets examined. Two of the tar-gets with the highest variability in our study, MMP9 and SERPINE1, showed similarly higher variability in that study.
While PPP1CA and B2M had a relatively narrow range of expression, GAPDH and 18S rRNA were more variable among individuals than several of the immunomodula-tory genes and therefore were not suitable for normalizing the data set. GAPDH is elevated in T cells upon activation [32,34] and can fluctuate in response to the changing energy demands of cells [35]. The results presented here support the notion that normalizing qRT-PCR data by input RNA amount is a reasonable approach and may introduce less variability than the use of a single reference gene.
Variation in gene expression over time in samples hybridized on microarrays
Pairwise comparisons were performed to determine whether the mean expression of each probe set on the array varied between any two time points. None of the dif-ferences seen at Days 14 and 28 compared to Day 1
Table 2: Hematology values of all subjects over all time points.
Cell Type Mean ± SD (109/L) Study Range (109/L) Lab Normal Range (109/L) Within-Subject Estimate of Variability (109/ L)
Total WBC 6.25 ± 1.43 3.3–12.3 4.5–10 0.84
Neutrophil 3.38 ± 1.07 1.4–8.8 1.8–7.5 0.70
Lymphocyte 2.16 ± 0.63 1.0–5.7 1.0–4.0 0.34
Monocyte 0.48 ± 0.13 0.03–1.09 0.20–1.00 0.09
Basophil 0.03 ± 0.02 0.01–0.16 0.00–0.20 0.02
Eosinophil 0.19 ± 0.12 0.04–0.69 0.04–0.50 0.05
Platelet 242 ± 54 129–596 150–400 23.11
remained significant after correcting for multiple compar-isons (Figure 3). The Bland-Altman plot [31] (Figure 4) shows there is no difference for samples separated by two weeks (e.g. when Day 14 is compared to Day 1 or when Day 28 is compared to Day 14). However, when Day 90 was compared to Day 180, 248 probe sets were found to be differentially expressed, a higher number than would be expected by random chance. Those 248 probe sets cor-respond to 157 unique genes (excluding probe sets which are not correctly mapped to the genome). Among those 157 genes, 66 genes were found associated with apoptotic activities with log2-fold change ranging from -0.9 to 0.6. It was not possible to draw a conclusion from the compar-ison of the gene signal intensities measured at Day 1 and
at Day 90 (and at Day 1 and Day 180) as samples were processed separately in two batches. The differences we found may be the result of a seasonal effect, a true biolog-ical effect, or experimental bias. The observed stability of the gene expression profiles over a one-month period is consistent with results from other studies [19,21].
Within-individual variability in gene expression over time qRT-PCR
The estimate of total within-individual variance of the eleven inflammatory genes shown in Table 3 reflects the amount of deviation around the mean trend of gene expression for a target gene over time. Total within-indi-vidual variance estimates for the eleven inflammatory
Total ranges of immunomodulatory and reference gene expression (qRT-PCR study) Figure 1
genes ranged from 0.220 to 0.838 Ct2, which was 1–3% of
the mean gene expression for a given gene. The two genes with the highest within-individual variance estimates were MMP9 and SERPINE1, while TNF had the smallest. From the mixed effects models for each mRNA measured by qRT-PCR, it was estimated that the correlation of gene expression among time points in a single individual is less than 50% for all genes assayed.
Microarray
One measure of the temporal variability of a gene is how well its expression is correlated in any individual from one point in time to the next. Using the variance components estimated with the linear mixed effect models, we deter-mined the correlation coefficient among expression meas-ures within a subject over time for each of the 17,329
probe sets satisfying the Shapiro test (see Methods). Only 10% of the probe sets exhibited a coefficient > 0.4 (Figure 5). However, when only probe sets demonstrating robust transcriptional expression with a log2-transformed signal intensity ≥ 7 (raw signal intensity > 100) were considered, the percentage with an intraclass correlation coefficient > 0.4 increased to 23%. The observation that those genes expressed at low levels had the lowest intra-individual correlations may be partly due to the known characteristic of probe sets at the lower end of the quantitative range of a microarray to have poorer reproducibility [36]. For example, Dobbin et al. [37] found that RNA profiles from tumor tissues had weaker correlations within an individ-ual for those genes with low levels of expression. Inspec-tion of the probe sets with the lowest correlaInspec-tion coefficient (< 0.1) but still with a log2 expression signal Immunomodulatory gene expression over time (qRT-PCR study)
Figure 2
Immunomodulatory gene expression over time (qRT-PCR study). Median gene expression for each immunomodula-tory gene is shown, with bars indicating the range from the 25th to the 75th percentile for all subjects.
0 50 100 150 200
2
4
2
6
28
3
0
32
34
36
Study Day
Ct
CXCL1
HMOX1 ICAM1
IL1B IL1RN IL6R MMP9 PTGS2 SERPINE1
TGFB1
intensity ≥ 10 showed that ~90% either do not map to a unique gene locus or do not map to the current version of the human genome, as already observed by Zhang [38].
Age and gender effects
No genes analyzed by either qRT-PCR or microarray were observed to be differentially regulated between the two age groups. An age effect has been observed previously with RNA profiling studies [19,21,39], and might have been expected here, given the large number of genes meas-ured. One explanation is that the broad age range within a given group in this study may have prevented the detec-tion of such an effect. Another is that blood might be less susceptible to senescence effects when compared to other tissues such as brain or muscle [40,41].
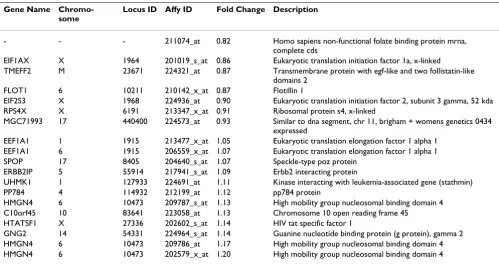
Females showed a small but statistically significant 1.3– 1.5-fold increase in gene expression relative to males for the qRT-PCR targets CXCL1, HMOX1 and ICAM1 (see Additional File 4. On the microarray, a total of 78 unique genes were found to be differentially regulated by gender. As expected, the XIST gene was found to be highly down-regulated in males compared to females, with an average log2-transformed signal intensity equal to 50 in females
and roughly 20 times lower expression in males. Fifteen of the 78 genes had a log2-transformed signal intensity ≥ 7.0 (Table 4). For all of these genes, the mean difference between sexes was less than 20%. Four X chromosome genes were identified as differentially expressed. One of these, RPS4X, is known to escape X inactivation [42] while another, E1F1AX, has family members known to escape X inactivation. Only 23 out of the 78 probe sets mapping on the Y chromosome were present in at least one sample and their log2-transformed signal intensities were always below 7. The majority of the highly expressed probe sets that were differentially regulated by gender are located on autosomal chromosomes (Table 4). Among those genes, flotillin1 (FLOT1), which was down-regulated in males compared to females, was recently identified as an estro-gen-responsive gene [43].
Effect of two severe adverse events on gene expression
A correspondence analysis (see Methods) was performed on a set of 34,573 probe sets for all the samples from the 22 individuals studied with microarrays. This analysis looked for combinations of genes that would explain the overall variability in the data set and identify possible out-liers. Almost all individuals across all time points were in
Time effect of Day 14 versus Day 1 (Microarray study) Figure 3
close proximity to one another (Figure 6). However, data points from two subjects, numbered 121 and 174, were outside of the main cluster.
Subject 121 had anemia secondary to rectal bleeding with a progressive drop in red cell count from baseline to Day 90. The subject's bleeding was stopped surgically on Day 100; on Day 180 red cell parameters had returned to the normal range. The correspondence analysis data points on Days 1, 14, and 28 are outside of the main cluster with the Day 90 profile reaching a maximum distance from the others. The Day 180 point has returned to normal. RBC-associated genes with elevated expression levels included ferrochetalase, carbonic anhydrase, ALAS2, erythrocyte membrane protein band 4.2, glycophorin A and B, and 2,3-bisphosphoglycerate mutase. Some of the genes over-expressed in subject 121, were correlated previously to reticulocyte expressed genes: SLC4A1, EPP42, BCL2L1 and BNIp3L [21]. ALAS2 and carbonic anhydrase have also been identified as genes that are down-regulated in anemia during acute renal allograft rejection [44].
Subject 174 developed lung cancer and began chemother-apy on approximately Day 70. She was a strong outlier in
the correspondence analysis on Day 90. Her monocyte count on that day was severely depressed to 6.5% of the baseline value (from 0.46 × 10⁹/L to 0.03 × 10⁹/L). All
other white cell types were within normal limits on Days 1, 14, 28, and 90. For subject 174, 31 genes were found to be up-regulated. The gene ACRBP was elevated four- fold above the other subjects on Day 90. ACRBP is a member of the cancer/testis family of antigens, is immunogenic, and has been detected in different tumor types [45]. The growth arrest-specific (GAS)2-like 1 gene, an actin-associ-ated protein expressed at high levels in growth-arrested cells [46], was found to be 1.5-fold higher in subject 174, compared to other individuals at Day 90. The changes in gene expression observed in this subject correlated with the onset of chemotherapy and may be largely attributa-ble to treatment. However, for both these cases data is required in larger numbers of patients to draw firm con-clusions.
Effect of infection on gene expression
Eighteen of the eighty subjects in the study had a total of 24 infections. The infections were predominantly upper respiratory infections (sinusitis, rhinitis, nasopharyngitis, or pharyngitis), in addition to gastroenteritis, bronchitis,
Effect of time on gene expression (Microarray study) Figure 4
Table 3: Estimates of different components of within-individual variation (qRT-PCR study).
Gene Variance Within Time Point (Ct2)
Covariance Between Time Points (Ct2)
Total Within-Individual Var-iance (Ct2)
Correlation Between Time Points
CXCL1 0.155 0.108 0.263 0.410
HMOX1 0.150 0.097 0.247 0.393
ICAM1 0.512 0.064 0.576 0.111
IL1B 0.191 0.125 0.315 0.395
IL1RN 0.224 0.135 0.359 0.375
IL6R 0.292 -0.018 0.274 -0.066
MMP9 0.612 0.011 0.622 0.017
PTGS2 0.215 0.104 0.319 0.325
SERPINE1 0.503 0.336 0.838 0.401
TGFB1 0.259 0.084 0.344 0.245
TNF 0.150 0.070 0.220 0.318
Distribution of correlation coefficients among probe sets (Microarray study) Figure 5
and skin infection and oral herpes simplex. Immunomod-ulatory gene expression in subjects with active infection at the time of sampling or within two weeks were slightly elevated relative to the expression levels observed two weeks after recovery and at all other time points (Figure 7). However, the expression of TGFB1 was still increased in samples taken after recovery.
Conclusion
In this study with 80 healthy male and female subjects ≥ 20 years of age, a normal range of gene expression was established for 11 inflammation-related genes and four housekeeping genes. Each gene was stably expressed, independent of age and gender. There was no apparent correlation between values more than three standard devi-ations from the mean with adverse events or hematology values. Nineteen subjects who had infections at the time of or within two weeks before their scheduled blood draws gave an additional sample two weeks after the reso-lution of their infections. The samples collected during the active infection showed slight elevations from the expression levels seen in uninfected subjects. However, the samples taken two weeks later showed increased expression of TGFβ1.
Gene expression levels, as measured by microarray analy-sis, appeared to be constant over one month; however, over three months, a small percentage of genes appeared
to vary. We observed that intra-individual gene correla-tions differ greatly depending on signal intensity. A small proportion of genes were found to be differentially regu-lated according to gender. Differential gene regulation by age (in subjects 25–55 years of age versus subjects > 55 years of age) was not observed. Elevated expression levels of red blood cell-associated genes were observed in one subject who experienced progressive anemia secondary to blood loss. Included among those genes were ferrocheta-lase, carbonic anhydrase, ALAS2, erythrocyte membrane protein band 4.2, glycophorin A and B, and 2,3-bisphos-phoglycerate mutase.
Use of RNA expression studies in clinical trials
Several lessons can be drawn from this study regarding the design and conduct of future clinical trials that test new pharmacological entities and employ gene expression as an assessment:
1. Estimates of sample sizes required to achieve a certain power to detect changes in gene expression of a particular magnitude can be calculated from the estimates of vari-ance components given in the results section, results from other studies, and the estimated effect size from in vitro
work.
2. Samples should be analyzed at the end of the experi-ment rather than on an ongoing basis. A bias was
intro-Table 4: Genes differentially expressed between genders with log-transformed signal intensities ≥ 7 (Microarray study).
Gene Name Chromo-some
Locus ID Affy ID Fold Change Description
- - - 211074_at 0.82 Homo sapiens non-functional folate binding protein mrna,
complete cds
EIF1AX X 1964 201019_s_at 0.86 Eukaryotic translation initiation factor 1a, x-linked
TMEFF2 M 23671 224321_at 0.87 Transmembrane protein with egf-like and two follistatin-like
domains 2
FLOT1 6 10211 210142_x_at 0.87 Flotillin 1
EIF2S3 X 1968 224936_at 0.90 Eukaryotic translation initiation factor 2, subunit 3 gamma, 52 kda
RPS4X X 6191 213347_x_at 0.91 Ribosomal protein s4, x-linked
MGC71993 17 440400 224573_at 0.93 Similar to dna segment, chr 11, brigham + womens genetics 0434
expressed
EEF1A1 1 1915 213477_x_at 1.05 Eukaryotic translation elongation factor 1 alpha 1
EEF1A1 6 1915 206559_x_at 1.07 Eukaryotic translation elongation factor 1 alpha 1
SPOP 17 8405 204640_s_at 1.07 Speckle-type poz protein
ERBB2IP 5 55914 217941_s_at 1.09 Erbb2 interacting protein
UHMK1 1 127933 224691_at 1.11 Kinase interacting with leukemia-associated gene (stathmin)
PP784 4 114932 212199_at 1.12 pp784 protein
HMGN4 6 10473 209787_s_at 1.13 High mobility group nucleosomal binding domain 4
C10orf45 10 83641 223058_at 1.13 Chromosome 10 open reading frame 45
HTATSF1 X 27336 202602_s_at 1.14 HIV tat specific factor 1
GNG2 14 54331 224964_s_at 1.14 Guanine nucleotide binding protein (g protein), gamma 2
HMGN4 6 10473 209786_at 1.17 High mobility group nucleosomal binding domain 4
HMGN4 6 10473 202579_x_at 1.20 High mobility group nucleosomal binding domain 4
XIST gene expression was found to be highly down-regulated in males compared to females. XIST does not appear in this table because the mean
duced when samples from the present study were processed and analyzed with different reagent lots over time in sequential batches This type of bias, also recently described by Yang et al. [47], could lead to the identifica-tion of many artifacts among differentially expressed gene sets.
3. Small elevations in inflammatory gene expression pro-duced during upper respiratory infections generally return to normal levels of expression within two weeks after the infection has resolved.
4. Time and/or seasonal effects may be a factor in trials lasting longer than one month.
5. Gender and age effects are not likely to be problematic in populations from 20 to 65 years of age. The assessment of gene expression profiles in children or very old individ-uals might lead to different conclusions.
Competing interests
This study was funded by Roche and sponsored by Roche Palo Alto.
Correspondence analysis of microarray samples Figure 6
Authors' contributions
CK processed and quantified RNA from PAXgene tubes; developed assays, performed experiments and analyzed data for qRT-PCR, and drafted part of the manuscript. PM performed the microarray experiments, analyzed data and drafted part of the manuscript. CF, MT and MWS per-formed the microarray experiments. AJ perper-formed statisti-cal analyses on the qRT-PCR data and drafted part of the manuscript. GD performed statistical analyses on the
microarray data and drafted part of the manuscript. MN performed statistical analyses on the adverse events and hematology data. LS and TN performed experiments for qRT-PCR. JC conceived of the study and its experimental design, participated in the interpretation of results, and helped prepare the manuscript.
Comparison of 95% confidence intervals of mRNA levels during an infection, at recovery, and at all other time points (qRT-PCR study)
Figure 7
Comparison of 95% confidence intervals of mRNA levels during an infection, at recovery, and at all other time points (qRT-PCR study). A comparison of mRNA levels (in terms of Ct units) for 12 genes in 18 subjects who experienced
Additional material
Acknowledgements
We thank Emanuelle Erhart-Gaudel and the staff of the Roche Clinical Phar-macology Unit in Strasbourg, France, for conducting the clinical trial, David Trollinger of Source Precision Medicine for discussions regarding the genes chosen for qRT-PCR, Xiaoning Wu and Sean Chien for providing technical support for the qRT-PCR experiments, and Laurent Essioux and Brian Rhees for comments regarding the statistical analyses. The study was funded by the Pharmaceutical and Diagnostic Divisions of Hoffman-LaRo-che. All authors read and approved the final manuscript.
References
1. Perou CM, Sorlie T, Eisen MB, Rijn M van de, Jeffrey SS, Rees CA, Pol-lack JR, Ross DT, Johnsen H, Akslen LA, et al.: Molecular portraits of human breast tumours. Nature 2000, 406:747-752.
2. van't Veer LJ, Dai H, Vijver MJ van de, He YD, Hart AA, Mao M, Peterse HL, Kooy K van der, Marton MJ, Witteveen AT, et al.: Gene expression profiling predicts clinical outcome of breast can-cer. Nature 2002, 415:530-536.
3. Paik S, Shak S, Tang G, Kim C, Baker J, Cronin M, Baehner FL, Walker MG, Watson D, Park T, et al.: A multigene assay to predict recurrence of tamoxifen-treated, node-negative breast can-cer. N Engl J Med 2004, 351:2817-2826.
4. Burczynski ME, Dorner AJ: Transcriptional profiling of periph-eral blood cells in clinical pharmacogenomic studies. Pharma-cogenomics 2006, 7:187-202.
5. Aune TM, Maas K, Parker J, Moore JH, Olsen NJ: Profiles of gene expression in human autoimmune disease. Cell Biochem Biophys
2004, 40:81-96.
6. Baechler EC, Batliwalla FM, Reed AM, Peterson EJ, Gaffney PM, Moser KL, Gregersen PK, Behrens TW: Gene expression profiling in human autoimmunity. Immunol Rev 2006, 210:120-137. 7. Bierhaus A, Wolf J, Andrassy M, Rohleder N, Humpert PM, Petrov D,
Ferstl R, von Eynatten M, Wendt T, Rudofsky G, et al.: A mecha-nism converting psychosocial stress into mononuclear cell activation. Proc Natl Acad Sci USA 2003, 100:1920-1925.
8. Nagabhushan M, Mathews HL, Witek-Janusek L: Aberrant nuclear expression of AP-1 and NFkappaB in lymphocytes of women stressed by the experience of breast biopsy. Brain Behav Immun
2001, 15:78-84.
9. Petersen AM, Pedersen BK: The anti-inflammatory effect of exercise. J Appl Physiol 2005, 98:1154-1162.
10. Sureda A, Ferrer MD, Tauler P, Maestre I, Aguilo A, Cordova A, Tur JA, Roche E, Pons A: Intense physical activity enhances neu-trophil antioxidant enzyme gene expression. Immunocyto-chemistry evidence for catalase secretion. Free Radic Res 2007, 41:874-883.
11. van Erk MJ, Blom WA, van Ommen B, Hendriks HF: High-protein and high-carbohydrate breakfasts differentially change the transcriptome of human blood cells. Am J Clin Nutr 2006, 84:1233-1241.
12. Boldrick JC, Alizadeh AA, Diehn M, Dudoit S, Liu CL, Belcher CE, Botstein D, Staudt LM, Brown PO, Relman DA: Stereotyped and specific gene expression programs in human innate immune responses to bacteria. Proc Natl Acad Sci USA 2002, 99:972-977. 13. Spurrell JC, Wiehler S, Zaheer RS, Sanders SP, Proud D: Human
air-way epithelial cells produce IP-10 (CXCL10) in vitro and in vivo upon rhinovirus infection. Am J Physiol Lung Cell Mol Physiol
2005, 289:L85-95.
14. Stockl J, Vetr H, Majdic O, Zlabinger G, Kuechler E, Knapp W: Human major group rhinoviruses downmodulate the acces-sory function of monocytes by inducing IL-10. J Clin Invest 1999, 104:957-965.
15. McLoughlin K, Turteltaub K, Bankaitis-Davis D, Gerren R, Siconolfi L, Storm K, Cheronis J, Trollinger D, Macejak D, Tryon V, Bevilacqua M: Limited dynamic range of immune response gene expres-sion observed in healthy blood donors using RT-PCR. Mol Med 2006, 12:185-195.
16. Baechler EC, Batliwalla FM, Karypis G, Gaffney PM, Moser K, Ort-mann WA, Espe KJ, Balasubramanian S, Hughes KM, Chan JP, et al.: Expression levels for many genes in human peripheral blood cells are highly sensitive to ex vivo incubation. Genes Immun
2004, 5:347-353.
17. Hartel C, Bein G, Muller-Steinhardt M, Kluter H: Ex vivo induction of cytokine mRNA expression in human blood samples. J Immunol Methods 2001, 249:63-71.
18. Campbell C, Vernon SD, Karem KL, Nisenbaum R, Unger ER: Assessment of normal variability in peripheral blood gene expression. Dis Markers 2002, 18:201-206.
19. Eady JJ, Wortley GM, Wormstone YM, Hughes JC, Astley SB, Foxall RJ, Doleman JF, Elliott RM: Variation in gene expression profiles of peripheral blood mononuclear cells from healthy volun-teers. Physiol Genomics 2005, 22:402-411.
20. Radich JP, Mao M, Stepaniants S, Biery M, Castle J, Ward T, Schim-mack G, Kobayashi S, Carleton M, Lampe J, Linsley PS: Individual-specific variation of gene expression in peripheral blood leu-kocytes. Genomics 2004, 83:980-988.
21. Whitney AR, Diehn M, Popper SJ, Alizadeh AA, Boldrick JC, Relman DA, Brown PO: Individuality and variation in gene expression patterns in human blood. Proc Natl Acad Sci USA 2003, 100:1896-1901.
22. Cobb JP, Mindrinos MN, Miller-Graziano C, Calvano SE, Baker HV, Xiao W, Laudanski K, Brownstein BH, Elson CM, Hayden DL, et al.: Application of genome-wide expression analysis to human health and disease. Proc Natl Acad Sci USA 2005, 102:4801-4806. 23. Palmer C, Diehn M, Alizadeh AA, Brown PO: Cell-type specific
gene expression profiles of leukocytes in human peripheral blood. BMC Genomics 2006, 7:115.
24. Fan H, Hegde PS: The transcriptome in blood: challenges and solutions for robust expression profiling. Curr Mol Med 2005, 5:3-10.
25. Kim SJ, Dix DJ, Thompson KE, Murrell RN, Schmid JE, Gallagher JE, Rockett JC: Effects of storage, RNA extraction, genechip type, and donor sex on gene expression profiling of human whole blood. Clin Chem 2007, 53:1038-1045.
Additional file 1
Primers used for qRT-PCR. The table provided describes the primer sequences used for qRT-PCR.
Click here for file
[http://www.biomedcentral.com/content/supplementary/1755-8794-2-33-S1.doc]
Additional file 2
Frequency distributions for white blood cell types for all subjects, all post-enrollment values. The histograms show distributions of cell counts for the major white blood cell types.
Click here for file
[http://www.biomedcentral.com/content/supplementary/1755-8794-2-33-S2.doc]
Additional file 3
Variability of raw and normalized Ct values (qRT-PCR study). The table shows the intra-individual variability in qRT-PCR Ct values for the subjects in the study.
Click here for file
[http://www.biomedcentral.com/content/supplementary/1755-8794-2-33-S3.doc]
Additional file 4
Immunomodulatory genes differentially expressed by gender or age group (qRT-PCR study). The table shows variability in qRT-PCR Ct val-ues between genders and subjects of different age groups.
Click here for file
Publish with BioMed Central and every scientist can read your work free of charge "BioMed Central will be the most significant development for disseminating the results of biomedical researc h in our lifetime."
Sir Paul Nurse, Cancer Research UK
Your research papers will be:
available free of charge to the entire biomedical community
peer reviewed and published immediately upon acceptance
cited in PubMed and archived on PubMed Central
yours — you keep the copyright
Submit your manuscript here:
http://www.biomedcentral.com/info/publishing_adv.asp
BioMedcentral
26. Bolstad BM, Irizarry RA, Astrand M, Speed TP: A comparison of normalization methods for high density oligonucleotide array data based on variance and bias. Bioinformatics 2003, 19:185-193.
27. Huggett J, Dheda K, Bustin S, Zumla A: Real-time RT-PCR nor-malisation; strategies and considerations. Genes Immun 2005, 6:279-284.
28. Fellenberg K, Hauser NC, Brors B, Neutzner A, Hoheisel JD, Vingron M: Correspondence analysis applied to microarray data. Proc Natl Acad Sci USA 2001, 98:10781-10786.
29. Pinheiro JC, Bates DM: Mixed-effects models in S and S-PLUS New York: Springer; 2000.
30. Benjamini Y, Hochberg Y: Controlling the False Discovery Rate – a Practical and Powerful Approach to Multiple Testing.
Journal of the Royal Statistical Society Series B-Methodological 1995, 57:289-300.
31. Bland JM, Altman DG: Statistical methods for assessing agree-ment between two methods of clinical measureagree-ment. Lancet
1986, 1:307-310.
32. Bas A, Forsberg G, Hammarstrom S, Hammarstrom ML: Utility of the housekeeping genes 18S rRNA, beta-actin and glyceral-dehyde-3-phosphate-dehydrogenase for normalization in real-time quantitative reverse transcriptase-polymerase chain reaction analysis of gene expression in human T lym-phocytes. Scand J Immunol 2004, 59:566-573.
33. Silver N, Best S, Jiang J, Thein SL: Selection of housekeeping genes for gene expression studies in human reticulocytes using real-time PCR. BMC Mol Biol 2006, 7:33.
34. Radonic A, Thulke S, Mackay IM, Landt O, Siegert W, Nitsche A: Guideline to reference gene selection for quantitative real-time PCR. Biochem Biophys Res Commun 2004, 313:856-862. 35. Barber RD, Harmer DW, Coleman RA, Clark BJ: GAPDH as a
housekeeping gene: analysis of GAPDH mRNA expression in a panel of 72 human tissues. Physiol Genomics 2005, 21:389-395. 36. Li X, Kim J, Zhou J, Gu W, Quigg R: Use of signal thresholds to
determine significant changes in microarray data analyses.
Genet Mol Biol 2005, 28:191-200.
37. Dobbin KK, Beer DG, Meyerson M, Yeatman TJ, Gerald WL, Jacob-son JW, Conley B, Buetow KH, Heiskanen M, Simon RM, et al.: Inter-laboratory comparability study of cancer gene expression analysis using oligonucleotide microarrays. Clin Cancer Res
2005, 11:565-572.
38. Zhang J, Finney RP, Clifford RJ, Derr LK, Buetow KH: Detecting false expression signals in high-density oligonucleotide arrays by an in silico approach. Genomics 2005, 85:297-308. 39. Tang Y, Lu A, Ran R, Aronow BJ, Schorry EK, Hopkin RJ, Gilbert DL,
Glauser TA, Hershey AD, Richtand NW, et al.: Human blood genomics: distinct profiles for gender, age and neurofi-bromatosis type 1. Brain Res Mol Brain Res 2004, 132:155-167. 40. Welle S, Brooks AI, Delehanty JM, Needler N, Thornton CA: Gene
expression profile of aging in human muscle. Physiol Genomics
2003, 14:149-159.
41. Galvin JE, Ginsberg SD: Expression profiling in the aging brain: a perspective. Ageing Res Rev 2005, 4:529-547.
42. Fisher EM, Beer-Romero P, Brown LG, Ridley A, McNeil JA, Lawrence JB, Willard HF, Bieber FR, Page DC: Homologous ribosomal pro-tein genes on the human X and Y chromosomes: escape from X inactivation and possible implications for Turner syn-drome. Cell 1990, 63:1205-1218.
43. Punyadeera C, Dassen H, Klomp J, Dunselman G, Kamps R, Dijcks F, Ederveen A, de Goeij A, Groothuis P: Oestrogen-modulated gene expression in the human endometrium. Cell Mol Life Sci
2005, 62:239-250.
44. Chua MS, Barry C, Chen X, Salvatierra O, Sarwal MM: Molecular profiling of anemia in acute renal allograft rejection using DNA microarrays. Am J Transplant 2003, 3:17-22.
45. Ono T, Kurashige T, Harada N, Noguchi Y, Saika T, Niikawa N, Aoe M, Nakamura S, Higashi T, Hiraki A, et al.: Identification of proacrosin binding protein sp32 precursor as a human can-cer/testis antigen. Proc Natl Acad Sci USA 2001, 98:3282-3287. 46. Schneider C, King RM, Philipson L: Genes specifically expressed
at growth arrest of mammalian cells. Cell 1988, 54:787-793. 47. Yang H, Harrington CA, Vartanian K, Coldren CD, Hall R, Churchill
GA: Randomization in laboratory procedure is key to obtain-ing reproducible microarray results. PLoS ONE 2008, 3:e3724.
Pre-publication history
The pre-publication history for this paper can be accessed here: