R E S E A R C H
Open Access
Analysis of small-sample clinical genomics studies
using multi-parameter shrinkage: application to
high-throughput RNA interference screening
Mark A van de Wiel
1*, Renée X de Menezes
1, Ellen Siebring-van Olst
2,3, Victor W van Beusechem
2From
Second Annual Translational Bioinformatics Conference (TBC 2012)
Jeju Island, Korea. 13-16 October 2012
Abstract
High-throughput (HT) RNA interference (RNAi) screens are increasingly used for reverse genetics and drug discovery. These experiments are laborious and costly, hence sample sizes are often very small. Powerful statistical techniques to detect siRNAs that potentially enhance treatment are currently lacking, because they do not optimally use the amount of data in the other dimension, the feature dimension.
We introduce ShrinkHT, a Bayesian method for shrinking multiple parameters in a statistical model, where ‘shrinkage’ refers to borrowing information across features. ShrinkHT is very flexible in fitting the effect size distribution for the main parameter of interest, thereby accommodating skewness that naturally occurs when siRNAs are compared with controls. In addition, it naturally down-weights the impact of nuisance parameters (e.g. assay-specific effects) when these tend to have little effects across siRNAs. We show that these properties lead to better ROC-curves than with the popular limma software. Moreover, in a 3 + 3 treatment vs control experiment with‘assay’ as an additional nuisance factor, ShrinkHT is able to detect three (out of 960) significant siRNAs with stronger enhancement effects than the positive control. These were not detected by limma. In the context of gene-targeted (conjugate) treatment, these are interesting candidates for further research.
Introduction
Many clinical genomics studies suffer from low power and low reproducibility caused by small sample sizes. Small sample sizes may be due to high costs per sample, low availability of genomic material (e.g. for rare diseases) or even juridical restrictions (e.g. when administering an experimental drug to patients). The philosophy behind our method is to increase power and reproducibility by retrieving as much information as possible from the ver-tical data direction (feature space: genes, tags, small inter-ference RNAs (siRNAs), etc.) for estimating differential treatment effects from the horizontal data direction (sample space).
In statistical terms the latter is referred to as‘shrinkage’. In a classical setting, a shrinkage estimator is a weighted
average between the estimator from the concerning fea-ture and a pooled estimator from all feafea-tures. Shrinkage of dispersion-related parameters, likes2for the Normal dis-tribution, is now commonly applied to genomics data and has been implemented in popular analysis software like limma [1]. We take a step further. We show that shrinking additional parameters, including the main parameter of interest, e.g. the treatment effect, may further enhance power and reproducibility. Our approach is an Empirical Bayes framework around a Full Bayes fitting method called Integrated Nested Laplace Approximation (INLA [2]). Here, INLA provides a fast, flexible, versatile and accurate alternative to MCMC, whereas our framework uses the high-dimensional aspect of the data to estimate priors, which effectuates shrinkage.
For the analysis of RNA-seq count data, we introduced ShrinkSeq [3]. We showed its improved performance in terms of Receiver Operating Characteristic (ROC)-curves with respect to other methods like edgeR, baySeq and * Correspondence: [email protected]
1
Department of Epidemiology and Biostatistics, VU University Medical Center, PO Box 7057, 1007 MB Amsterdam, the Netherlands
Full list of author information is available at the end of the article
DESeq, in particular when the data contain many zeros and sample sizes are small. Here, we provide several extensions and new insights: 1) ability to handle high-dimensional Gaussian data; 2) model selection properties when nuisance parameters are involved; 3) flexible and powerful inference with potentially asymmetric priors.
High-throughput (HT) RNA interference (RNAi) screens [4] are increasingly used for reverse genetics and drug discovery. Statistical methods used for HT screens data analysis are commonly borrowed from small-molecule screens or even other types of high-dimensional data methods. However, HT screens data differs from other high-dimensional data in fundamental ways. Firstly, HT screens data are more susceptible to technical effects, as the cell culture plates are handled several times over a multiple day period, and the various experimental steps are performed by a variety of equipment. Secondly, studies currently involve a very small (1-3) number of replicates per condition. Hence, statistical inference is often absent in HT RNAi studies: only fold changes and standard deviations are mentioned. Thirdly, HT screens data typically involve a large amount of observations for con-trols, which serve as references for condition effect but are not of primary interest, and a very limited number of observations per siRNA, which are the primary interest. This highly unbalanced design essentially means that clas-sic statistical methods are underpowered to find siRNA-specific effects.
Ideally, HT screens contain two types of controls: a negative one, which in a treatment sensitization setting can be used to estimate the effect of treatment alone, and a positive one, which is a gene known to have an (additional) effect on the response, e.g. cell viability, when silenced. While comparisons to both controls are of interest and our method applies to both, we focus on the one relative to the positive control. Then the lack of power is particularly relevant: an siRNA can only be sig-nificant (in comparison with the positive control) when the differential siRNA-specific cell viability between treatment and‘no treatment’ conditions exceeds that of the positive control. Most data information then arises from treatment effect for controls, with generally hun-dreds of measures per replicate, whilst the main goal typically is to draw conclusions about siRNA-specific treatment sensitivity, for which only a single measure is available per replicate. There is thus great need for methods that can borrow information across features (siRNAs), to improve the chance of finding relevant siRNAs.
In this work, we use data from a cisplatin sensitization HT screen. Cisplatin is a DNA damaging agent that has been used for over 30 years to treat cancer and is part of standard therapy for some cancer-types, including non-small cell lung cancer. Unfortunately, results are
suboptimal and some patients react better than others. Chemo-resistance is a major problem, for which the molecular cause is largely unknown. Cisplatin sensitiza-tion screens aim at identifying genes involved with the sensitivity to cisplatin. This knowledge may render use-ful biomarkers for treatment response, and elucidate which pathways are involved in resistance to cisplatin. Moreover, the identified genes are potential targets for more effective treatment when cisplatin is combined with an inhibitor of the corresponding gene product.
The data were produced as follows. Cells from the estab-lished non-small cell lung cancer (NSCLC) cell line A549 were seeded in 96 well plates. Next day, these cells were transfected with siRNAs targeting a selected set of 960 genes, using a robotic set up. This renders two sets of 24 plates for which each well contains a pool of siRNA tar-geting one gene. The following day a low dose of cisplatin was added to the wells of one set of plates, while the other set received an equal volume of culture medium without cisplatin. Four days after cisplatin exposure, read out of viability commenced for both sets. This procedure was repeated twice. The positive control,BIRC7, is a known inhibitor of apoptosis-related genes and sensitises A549 cells to cisplatin. The negative control consists of a pool of siRNAs that do not target a known human mRNA. The cisplatin concentration used was relatively low: 0.45μg/ml. At that concentration, the reduction of viabi-lity by cisplatin inBIRC7silenced cells, compared to cells treated with non-targeting siRNAs, is most profound. Reducing cisplatin in a clinical setting while preserving toxic effect on the tumor is likely to reduce cytotoxic side effects like kidney and auditory nerve damage.
The HT screen data was read into R and normalized by correcting for a plate or assay effect using a linear regres-sion model on the logarithm of the data values, consider-ing all six screens simultaneously. Subsequently, the treatment effect was estimated for positive controls only, also controlling for possible remaining assay-specific effects. The remaining siRNA observations, corrected for control-related treatment effect, were then studied using two alternative empirical-Bayes approaches. The first one involved studying treatment effect in the corrected siRNA data by using limma. This approach shrinks the effect’s variance only, which leads to a modifiedt-test. The second one is ShrinkHT, which shrinks multiple parameters: effect variance, effect size and possibly also nuisance effects like the assay-specific ones for data with Gaussian errors.
Methods
Introduction to (Bayesian) shrinkage
Consider a simple data set, for which features (e.g. siR-NAs)X2, ..., Xpare measured onn= 6 subjects (divided
featureX1is measured on the same 6 subjects, but also in 4 other studies (so 5 in total) with the same technol-ogy and study design. Feature X1 will be used to illus-trate the potential beneficial effect of shrinkage. A simple Analysis of Variance (ANOVA)-type model for groupsj= 1 andj= 2 is:
Yjk=α+βj+εjk, (1)
whereYjkis the data for subjectkin groupj,ais a com-mon intercept andεjkfollows a central Normal distribu-tion. In addition,b1is set to zero, sob2can be interpreted as the mean log-fold change between groups. In a Bayesian setting, model (1) is not complete: priors need to be speci-fied for all parameters. Let us focus on the prior forb2. In a conventional Bayesian analysis, a flat prior would be used, e.g. a Gaussian with very large variance, f.e.N(0; 1002). This reflects a complete lack of prior believe or evi-dence on the size and direction of the log-fold change. Refer to model (1) with this prior as model m1. Now our method allows to estimate a prior fromX2...,Xp(or from X1...,Xp: becausepis largeX1has a negligible effect on the estimate, so we do not violate the‘do not use the data twice’principle). Suppose the log-fold changes tend to be much more concentrated, reflected by an estimated shrinkage priorN(0,τ2), withτ= 0.5. Use of this prior
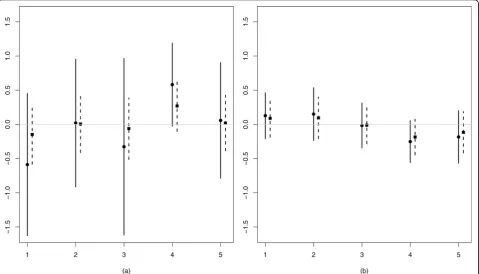
defines model m2. Suppose their is no effect for feature X1, sob2= 0. Figure 1(a) illustrate estimates ofb2forX1 for the five studies under models m1 and m2. We observe two beneficial effects of the shrinkage prior: the means are shrunken towards zero (and hence better reproducible), and the standard deviations are markedly smaller than for the vague prior. For large sample sizes the differences between the shrunken estimates and the ones based on a vague prior diminish (see Figure 1(b)), because the data then dominates the prior.
Use of a shrinkage prior effectuates (Bayesian) shrink-age: (posterior) estimates of the feature-specific log-fold changes are shrunken towards the overall mean log-fold change by using a prior that is concentrated around this mean. Here, the high-dimensional aspect of our data plays an important role: the availability of X1, ...,Xp, with p large, allows us to estimate a common prior, rather than assuming it. In our example, the shrunken prior is correctly positioned forX1. However, if the true
b2 is not well supported by the prior, shrinkage may do more harm than good, because it may introduce a bias. This is the reason why we allow flexible, non-parametric priors, which can accommodate a wide variety of distri-butional properties such as skewness or heavy tails. Below we discuss estimation of such priors.
Figure 1Illustration of shrinkage effect. Estimates ofb2(mean ± standard deviation) for five studies, using model m1 (vague prior; circle/solid
line) and model m2 (shrinkage prior; square/dashed). (a):n= 6, (b):n= 40. Data are generated from model (1) withb2=b1= 0 and
Design of cisplatin sensitization HT screening experiment The analysis of the HT screening data consists of three parts: 1) Estimation of the hyper-parameters (parameters of priors), which effectuates shrinkage; 2) Estimation of the model parameters; 3) Inference. The design of the experiment is given in Table 1. Next, we describe the model for the HT screening data.
Model
The model is the same for all siRNAs and hence we drop the siRNA index when not referring to a specific siRNA. Then,Yjkis thejthobservation for thekthassay for a given
siRNA, wherej= 1 corresponds to‘no treatment’ and j= 2 to‘treatment’.
Yjk= offsetjk+β0+βjtreat+β assay
k +εjk
εjk=dN(0,σ2) βassay
k =dN(0,τ2)for k≥ 2; β assay
1 = 0
βtreat
2 =dFNP; β1treat= 0 σ−2=d(α
1,α2)
(2)
Here, offsetjkis trivially computed from the positive
con-trol data. It is the estimated effect of the positive concon-trols for treatment leveljand assaykusing the same model as above, but with vague priors for all parameters. Since the amount of data on the positive controls is large (288 mea-surements), and the standard deviations of the estimates are small, we do not further propagate the uncertainty of these estimates.
The crux behind our method is that we empirically estimate hyper-parametersτ2,a1,a2and FNP, which is a
non-parametric, log-concave distribution function [5]. The latter provides maximum flexibility for the main parameter of interest,β2treat. In the Results section we show that this flexibility is essential for detecting signifi-cant siRNAs.
Estimation of hyper-parameters
Let us first consider the empirical estimation of the Gaus-sian variance parameterτ2. Suppose we initially do not estimateτ2and just set it to some large value (eg 106) which reflects a vague prior forβkassay. Likewise other hyper-parameters are initialized to induce vague priors, including a vague Gaussian prior to initializeFNP. Then, INLA provides posterior distributions of all parameters.
Now writemikandvikas the posterior mean and variance
ofβikassay, where we add index ito indicate siRNAi. In other words,mikandvikare means and variances
condi-tional on the data for siRNAi. Using the well-known var-iance propagation rule,V(A) =VB(E(A|B)) +EB(V(A|B)),
we may now simply re-estimate the unconditional, prior variance by
ˆ
τ2=Vˆ(m
ik) +v¯ik, (3)
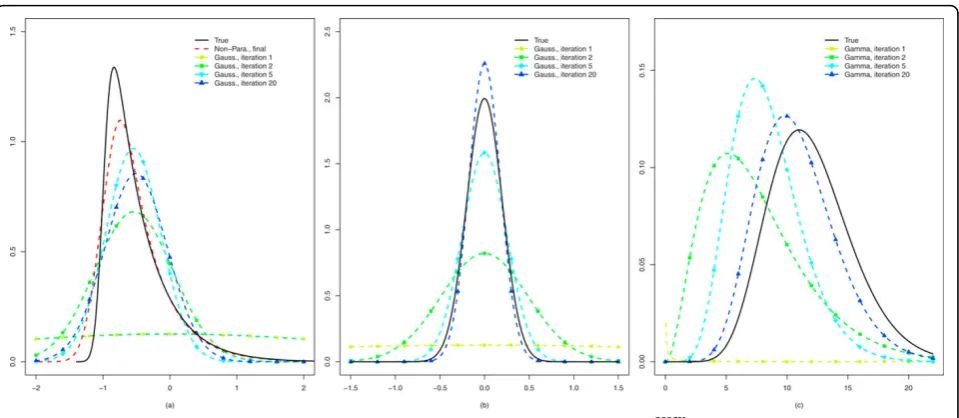
where Vˆ is the sample variance estimator. Now, the procedure may be repeated until convergence, where new posteriors are computed under the updated prior varianceτˆ2. Figure 2(b) shows an example of central Gaussian priors that result from iterative estimates of τ2. The rationale behind this iterative procedure is as follows. Posteriors are a compromise between the prior and the likelihoods (the data). Hence, as long as the common prior‘conflicts’with the data, pooling the pos-teriors, which is what (3) does, leads to a prior that, in a global sense, is more in line with the data. Of course, here it is quintessential to have much data in the verti-cal direction, siRNAs, to ensure that the prior does not tune to one particular siRNA.
For non-Gaussian, parametric distributions the above moment-estimator is replaced by a maximum likeli-hood-based one. Importantly, the procedure above may trivially be extended to estimate multiple priors: at each iteration INLA provides posteriors given all priors, hence accounting for potential interdependencies, whereas the re-estimation of the priors depends only on the marginal posteriors of the concerning parameter.
Finally, let us shortly explain howFNP in model (2) is estimated. INLA can currently not deal with non-para-metric priors. Hence, in the above joint iterative proce-dure we have to assume a parametric prior forβtreat
2 , e.g. Gaussian. Denote this prior withπ(b). Now suppose we want to replace this prior by a non-parametric one π* (b), the density corresponding to distribution function FNP. INLA returns posteriors π(b|Y) under priorπ(b).
The following re-weighting allows to compute a poster-iorπ*(b|Y) under priorπ*(b):
π∗(β\Y)= π (β\Y) π∗(β)/π (β)
π (β\Y) π∗(β)/π (β)dβ,
where the denominator scales the numerator to ensure thatπ∗(β\Y)is a density integrating to one. The principle for estimatingπ∗(β)(and hence FNP) is the
same as with the above joint iterative procedure: itera-tively and alternatingly update π∗(β)and π∗(β\Y). Here, the new update ofπ∗(β)is just a log-concave fit to a large sample of the empirical mixture of posteriors ofβi2treat, where log-concavity helps to stabilize the tails. Table 1 Design of the study
Measurement
y11 y21 y12 y22 y13 y23
Untreated Treated Untreated Treated Untreated Treated
Assay 1 Assay 1 Assay 2 Assay 2 Assay 3 Assay 3
Hence, the joint iterative procedure is followed by a marginal iterative procedure (which updates only one prior) and together they provide estimates of τ2,a1, a2,
FNP and the posteriors ofβi2treat. Several (mathematical) details of the procedure, such as approximate equiva-lence to maximum marginal likelihood, convergence cri-teria and various types of parametric priors are further discussed in [3].
Inference
An important feature of HT screening is that, due to the interpretation of theβi2treat(treatment sensitization effect relative to a positive control), one is mostly interested in βtreat
i2 >0This implies that inference needs to be one-sided. This is particularly important in an FDR setting: if the inference is performed two-sided, so also aims at detectingβi2treat<0, this may heavily bias the results for βtreat
i2 >0, even when those are a posteriori selected. The reason is that the many‘significant’results forβtreat
i2 <0 (which are to be expected: many siRNAs will have smaller effects than the positive control) push the FDR down-wards. This asymmetry for the positive and negative effects is further highlighted in the Results section.
In [3] we argued that in a shrinkage context the pos-terior probability p0i= 1 - pi =1−P(βi2treat>0|Yi)can be interpreted as a local false discovery rate [6], which for cut-off t leads to Bayesian False Discovery Rate (BFDR [7]) when averaged over all p0i ≤t. This can be used analogously to ordinary FDR.
Results
Successful estimation of the priors
To assess whether priors can be successfully estimated in this very challenging setting with only 6 measurements
per siRNA, two conditions and the presence of a three-level nuisance factor (assay), we set up a simulation that is strongly motivated from the data: the model is the same as (2) except for the offset which is not relevant here. Moreover, the effect size distributionFNPis an asymmetric one:Γ(1, 0.5) shifted to the left byΔ= -1, where our main interest is in the positive tail. Finally,a1 and a2 are set to 12 and 1, respectively, such that the resulting Gamma distribution mimics the observed one for the estimates ofs-2andτ= 0.2 which implies small assay effects, as observed in the data as well. Thousand siRNAs are simulated. The results of the iterative algo-rithms are displayed in Figure 2.
Given the sample sizes and the number of model parameters per siRNA, the results are very accurate. From (b) and (c) we conclude that the final parametric estimates (Iteration 20) are fairly close to the true ones for the nuisance parameter and the precision. For the first, the final estimate isτˆ= 0.18, whereas for the latter it is (αˆ1,αˆ2) = (10.90, 1.01). From (a) it is clear that the non-parametric estimate can provide a substantial improvement with respect to the Gaussian one for the parameter of interest. Note that the left-tail is somewhat more difficult to estimate due to its steepness, whereas the right-tail (reflecting positive effects, in which we are interested) is very accurately estimated.
Comparison
We compare ShrinkHT with limma in a data-based simu-lation set-up. Here, the functional screening data serves as a template for the sample sizes, number of features and noise levels. More specifically, we simulate two groups of three samples for 960 features from Gaussian distributions with standard deviations equalling those of
the corresponding data estimates. For the main para-meters of interest, the differences of means, we assume that 80% of these equal exactly 0. The remaining 20% is simulated from four differential effect size distributions: Gamma(0.5, 0.75), halfNormal(0, 0.47), Gamma(0.25, 0.75) and halfNormal(0, 0.25). Here, the half-Normal dis-tributions contain twice the mass of the positive part of the central Normal ones. The first two distribution corre-sponds to a mean differential effect ofδ= 0.375, whereas the latter two correspond toδ/2.
The simulated data were analyzed with ShrinkHT and limma. In this setting, the two approaches differ
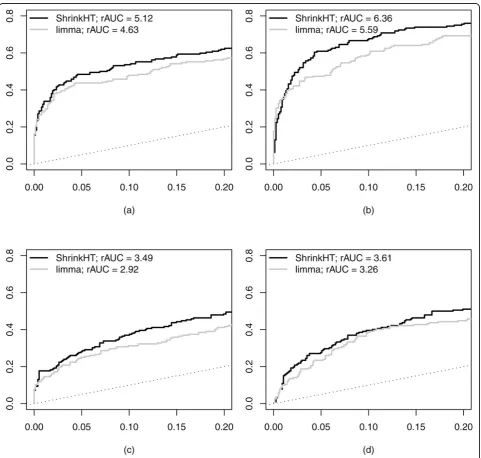
essentially in only one aspect: in addition to the stan-dard deviations, ShrinkHT shrinks the mean differential effects whereas limma does not. After the analysis, sig-nificance results are ranked for both approaches, enabling computation of the False Positive Rate (FPR; 1-specificity) and True Positive Rate (TPR; sensitivity). Figure 3 displays the resulting ROC-curves. For all comparisons we show partial ROC-curves and partial Area-Under-the-Curve (AUC) because in a testing set-ting only small FPR (we use FPR ≤0.2) is relevant [8]. Partial AUC (pAUC) is expressed in terms of relative AUC (rAUC), rAUC = pAUC = (0.22 * 0.5), where the
denominator is the expected AUC for a non-informative decision procedure.
Figure 3 clearly shows the benefit of additional shrinkage in ShrinkHT. For example, for FPR = 0.05, the TPRs of ShrinkHT are 1.11, 1.29, 1.13 and 1.16 times higher than those of limma for cases (a)-(d), respectively.
Analysis of HT screening data
To illustrate the effect of several levels of shrinkage, we computeeqN: the‘equivalent number of replicates’, which equalseqN=N/p*, with total sample sizeN= 6 andp*the effective number of parameters in the model [9]. High values ofeqNlead to more precise, and hence more repro-ducible, estimates of the parameters. Shrinkage can poten-tially decreasep*and hence increaseeqN. We consider four scenarios: 1) no shrinkage (flat priors); 2) shrinkage of sdsonly; 3) shrinkage ofsandβ2treat; 4) shrinkage ofs, βtreat
2 andβ
assay
k .
In scenario 1)eqNequals 1.5 for all siRNAs. This is to be expected, because with flat priors and Gaussian mod-elsp*is just the number of free parameters [9], which is 4 in model (2). In scenario 2)eqNalso equals 1.5 for all siRNAs, becausesis a hyper-parameter in the hierarchi-cal model, which does not contribute to the computation ofp*[9]. Hence shrinkage of this parameter has no effect oneqN. For scenario 3) the mean eqNequals 1.73 (sd: 0.01), whereas for scenario 4) the meaneqNequals 3.21 (sd: 0.08). Hence, in particular shrinkage of the 2 free assay parameters has a very beneficial effect oneqN. In fact, under scenarios 1) and 2) sample size N should be more than doubled to obtain approximately the same value ofeqN:N′= 13 would result in eqN′= 13 = 4 = 3.25. The gain ineqNfor scenario 4 is due to the strong reduction ofp*, which results from the very narrow cen-tral Gaussian prior for βkassay: standard deviation
ˆ
τ = 0.095. Hence, the assay parameters are strongly shrunken towards 0, which illustrates the quasi-para-meter-selection property of our method.
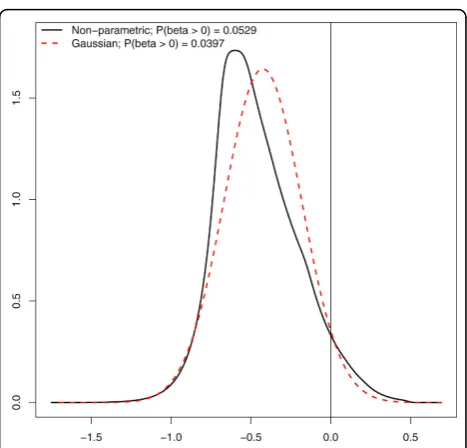
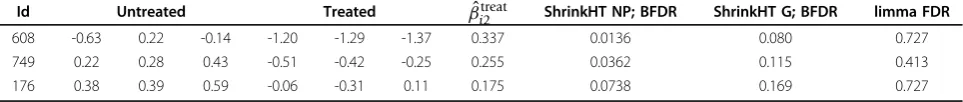
An interesting aspect of HT screens data is that when comparing treatment enhancement effect of siRNAs with that of the positive control it is likely that relatively many siRNAs are less effective than the positive control. Here, we show that it is quintessential to account for this potential asymmetry in the statistical analysis. Figure 4 shows the estimated Gaussian (and hence esti-mated) treatment effect size distribution, and the flex-ible, non-parametric one, which allows for skewness. Importantly, the two differ strongly on the area of pri-mary interest, the positive area, reflected in the 0.0529/ 0.0397 = 1.33 times larger mass in this area for the non-parametric one. More importantly, the practical conse-quence is that at a 0.1 cut-off for the BFDR the non-para-metric prior leads to 3 detections of siRNAs that have a stronger effect than the positive control, whereas the
Gaussian prior results in only 1 detection (see Table 2). At Benjamini-Hochberg FDR cut-of 0.1, limma returns no detections when one-sided testing is used. However, the comparison with limma should be interpreted tenta-tively, because the true false positive rate is unknown.
Table 2 also shows the posterior mean estimates of βtreat
i2 when using the non-parametric treatment effect size prior. So, for example, the enhancement effect of siRNA 608 on cell viability is estimated to be 20.337= 1.26 times larger than that of the positive control. Note that our shrinkage implies that this estimate is intrinsi-cally corrected for selection bias [10].
Conclusion
We discussed ShrinkHT, a new method for analyzing HT screening data. Its efficiency and power were demon-strated in both simulation and real data settings. We showed that it is able to detect siRNAs that sensitize cells to cisplatin with a stronger effect than the positive control. It is important to have several candidates that exhibit strong effects, because in the trajectory of further valida-tion many siRNAs are likely to fail. HT screens are expen-sive and laborious which explains the small sample sizes (often smaller than 3 vs 3) found in literature. Still, even when such small sample size studies are considered as pilots it is important to select the right features for further experiments and to have a good estimate of the false dis-covery rate to minimize the risk of wasting resources and time.
Figure 4Estimates of Gaussian and non-parametric prior. Gaussian and non-parametric estimates of the treatment
sensitization effect size(β2treat)density and the prior probabilities
While we focused on the comparison with the positive control, the comparison with the negative control is at least as important. Here, the gain of ShrinkHT with respect to other methods is relatively less when consider-ing treatment sensitization, because these effects tend to be large when compared to the negative control. On the other hand, the siRNAs that sensitize the treatmentless than the negative control are also of interest, because these may protect the cells against the treatment. Those protective effects are likely to be smaller and less prevalent than enhancement effects. The adaptivity of the prior towards non-symmetric situations like these renders ShrinkHT very suitable to find such protective effects.
For some HT screens many siRNAs have significantly larger effects than the negative control, whereas none of these has a significantly stronger effect than the positive control (or a good positive control is lacking). For exam-ple, silencing of the commonly used positive control gene PLK1usually completely kills cells irrespective of the treat-ment modality. Then, inference with respect to the con-trols is only partly helpful for selecting siRNAs that sensitize treatment for further validation. In such a case, our method allows a potentially useful alternative: infer-ence with respect to the mean or mode. In an empirical Bayes setting, the prior can be assumed known when esti-mating marginal posteriors and hence also when drawing inference from these. Hence, we may base the ‘ null-hypothesis’on e.g. the mean of the prior of the primary parameter of interest,βtreat, and declare an siRNA signifi-cant if its effect is signifisignifi-cantly larger than this mean. Since the prior mean reflects the average posterior mean over all siRNAs, such significance should be interpreted as a rela-tive statement: the concerning siRNA has a significantly larger effect than the average. In our setting, 181 siRNAs showed such a significant effect at BFDR≤0.1.
In silico validation of our approach is not straightfor-ward. Large sample HT screens are not available, which disallows a sample splitting approach like we performed for RNA-seq data [3]. For those data we demonstrated better reproducibility of the results from our approach with respect to others. On genome-wide screens, pathway (enrichment) analysis could be useful, but our selected set of 960 genes is likely too small for this purpose. Biological validation of significant siRNAs (hits) is planned for the near future. Follow up in RNAi screens with pools of
siRNAs targeting the mRNA of one gene, such as in our example data set, starts with the process called deconvolu-tion; each of the single siRNAs from a hit pool is tested to see if it elicits the same effect. Often this is accompanied by quantification of the knock down of the targeted mRNA, in order to detect possible off target effects of the siRNAs. In this particular screen, deconvolution will be combined with a dose response curve to cisplatin to truly assess the sensitizing effect of siRNAs targeting the gene of interest.
ShrinkHT is part of the R-package‘ShrinkBayes’, under the function name ‘ShrinkGauss’. ShrinkBayes also includes ShrinkSeq for the analysis of RNA-seq data. The package is available from http://www.few.vu.nl/~mavdwiel. We are convinced that ShrinkHT contributes to powerful and reliable detection of siRNAs which, in the context of gene-targeted (conjugate) treatment, are interesting candi-dates for further validation.
Authors’contributions
MvdW developed the analysis method and software (ShrinkHT). MvdW and RdM performed statistical analyses. ESvO, VvB and RdM designed the RNAi HTS experiment. ESvO performed the experiment. MvdW drafted the manuscript. All authors read and approved the final manuscript.
Competing interests
The authors declare that they have no competing interests.
Acknowledgements
We thank Ida van der Meulen-Muileman for technical assistance in liquid handling.
Ellen Siebring-van Olst is supported by the Walter Bruckerhoff Stiftung. High-throughput screens were conducted at the RNA Interference Functional Oncogenomics Laboratory (RIFOL) core facility at the VUmc Cancer Center Amsterdam, which was established with support from the Stichting VUmc CCA.
Declarations
The publication costs for this article were shared by all authors: the Departments of Epidemiology & Bio-statisics, Medical Oncology and Pulmonary Diseases, VU University Medical Center, Amsterdam, provided funding in three equal parts.
This article has been published as part ofBMC Medical GenomicsVolume 6 Supplement 2, 2013: Selected articles from the Second Annual Translational Bioinformatics Conference (TBC 2012). The full contents of the supplement are available online at http://www.biomedcentral.com/bmcmedgenomics/ supplements/6/S2.
Author details
1Department of Epidemiology and Biostatistics, VU University Medical Center,
PO Box 7057, 1007 MB Amsterdam, the Netherlands.2RNA Interference
Functional Oncogenomics Laboratory (RIFOL), Department of Medical Table 2 Results of the analysis
Id Untreated Treated βˆi2treat ShrinkHT NP; BFDR ShrinkHT G; BFDR limma FDR
608 -0.63 0.22 -0.14 -1.20 -1.29 -1.37 0.337 0.0136 0.080 0.727
749 0.22 0.28 0.43 -0.51 -0.42 -0.25 0.255 0.0362 0.115 0.413
176 0.38 0.39 0.59 -0.06 -0.31 0.11 0.175 0.0738 0.169 0.727
1st
column: siRNA id; 2nd to 7th
column: log2cell viability data for untreated and treated cell lines, corrected for the differential effect in positive control; 8th column: estimate of treatment sensitization effect (’untreated - treated’) in excess of the positive control when ShrinkHT is used with a non-parametric prior; 9th and 10th
column: BFDRs when using a non-parametric and Gaussian prior; 11th
Oncology, VU University Medical Center, Amsterdam, the Netherlands.
3Department of Pulmonary Diseases, VU University Medical Center,
Amsterdam, the Netherlands.
Published: 7 May 2013
References
1. Smyth GK:Linear models and empirical Bayes methods for assessing differential expression in microarray experiments.Stat Appl Genet Mol Biol
2004,3:Article3.
2. Rue H, Martino S, Chopin N:Approximate Bayesian inference for latent Gaussian models by using integrated nested Laplace approximations (with discussion).J R Statist Soc B2009,71:319-392.
3. Van de Wiel M, Leday G, Pardo L, Rue H, van der Vaart A, van Wieringen W:
Bayesian analysis of RNA sequencing data by estimating multiple shrinkage priors.Biostatistics2013,14:113-128, doi: 10.1093/biostatistics/kxs031. 4. Mullenders J, Bernards R:Loss-of-function genetic screens as a tool to
improve the diagnosis and treatment of cancer.Oncogene2009,
28:4409-4420.
5. Lutz D, Rufibach K:logcondens: Computations related to univariate log-concave density estimation.J Statist Software2011,39:1-28.
6. Efron B, Tibshirani R, Storey JD, Tusher V:Empirical Bayes analysis of a microarray experiment.J Amer Statist Assoc2001,96:1151-1160. 7. Ventrucci M, Scott EM, Cocchi D:Multiple testing on standardized
mortality ratios: a Bayesian hierarchical model for FDR estimation. Biostatistics2011,12:51-67.
8. Dodd LE, Pepe MS:Partial AUC estimation and regression.Biometrics
2003,59:614-623.
9. Spiegelhalter DJ, Best NG, Carlin BP, van der Linde A:Bayesian measures of model complexity and fit.J R Statist Soc B2002,64:583-639.
10. Crager MR:Gene identification using true discovery rate degree of association sets and estimates corrected for regression to the mean.Stat Med2010,29:33-45.
doi:10.1186/1755-8794-6-S2-S1
Cite this article as:van de Wielet al.:Analysis of small-sample clinical genomics studies using multi-parameter shrinkage: application to high-throughput RNA interference screening.BMC Medical Genomics2013 6(Suppl 2):S1.
Submit your next manuscript to BioMed Central and take full advantage of:
• Convenient online submission
• Thorough peer review
• No space constraints or color figure charges
• Immediate publication on acceptance
• Inclusion in PubMed, CAS, Scopus and Google Scholar
• Research which is freely available for redistribution